View EAS service metrics on the monitoring page to understand service calls and operations.
View service monitoring information
-
Log on to the PAI console. Select a region on the top of the page. Then, select the desired workspace and click Elastic Algorithm Service (EAS).
-
Click the target service name to enter the details page. Switch to the Monitoring tab.
-
View service monitoring information.
Switch Dashboards
Dashboards are divided into service and instance dimensions. Switch between them as follows:

-
Service: Service dimension. Default service monitoring dashboard name format is
Service-<service_name>, where<service_name>is the EAS service name. -
Instance: Instance dimension, divided into single instance and multiple instances.
-
Single Instance: Displays monitoring data for a single instance. Switch between different instances to view their data.

-
Multiple Instance: Displays monitoring data for multiple instances. Select multiple instances to compare and view their data.

-
Switch Time Range
Click
 on the right side of the Monitoring area to switch the time range displayed on the dashboard.
 Important
Minute-level monitoring metrics are retained for a maximum of 1 month. Second-level monitoring metrics are retained for a maximum of 1 hour.
ImportantLLM-related monitoring items display only when the service tag contains
"ServiceEngineType": "vllm"or"ServiceEngineType" : "sglang". -
Monitoring metrics
Service Monitoring Dashboard (Minute-Level)
Monitor the following metrics on this dashboard:
|
Metric |
Description |
|
|
QPS |
Requests per second for the service. Requests with different return codes are calculated separately. For services with multiple instances, this metric is the sum across all instances. The 1d offset indicates QPS data for the same time on the previous day for sequential analysis. |
|
|
Response |
Total responses received by the service within the selected time range. Responses with different return codes are calculated separately. For services with multiple instances, this metric is the sum across all instances. |
|
|
RT |
Request response time.
|
|
|
Daily Invoke |
Daily service calls. Calls with different return codes are calculated separately. For services with multiple instances, this metric is the sum across all instances. |
|
Single Instance Monitoring Dashboard (Minute-Level)
Monitor the following metrics on this dashboard:
|
Metric |
Description |
|
QPS |
Requests per second received by this instance. Requests with different return codes are calculated separately. |
|
RT |
Response time of requests for this instance. |
|
Response |
Total responses received by this instance within the selected time range. Responses with different return codes are calculated separately. |
Multiple Instance Monitoring Dashboard
Minute-level and second-level monitoring metrics are detailed below.
-
Minute-Level
Metric
Description
Instance QPS
Requests per second for each instance. Requests with different return codes are calculated separately.
Instance RT
Average response time for each instance.
Instance CPU
CPU usage for each instance, in CPU cores.
Instance Memory -- RSS
Resident physical memory size for each instance.
Instance Memory -- Cache
Cache size for each instance.
Instance GPU
GPU utilization for each instance.
Instance GPU Memory
GPU memory usage for each instance.
Instance TCP Connections
Number of TCP connections for each instance.
-
Second-Level
ImportantData precision is accurate to 5 seconds. Only the last 1 hour of data is retained.
Metric
Description
Instance QPS Fine
Requests per second received by each instance. Requests with different return codes are calculated separately.
Instance RT Fine
Average response time for requests received by each instance.
GPU Monitoring Dashboard
Monitor the following GPU metrics at service and instance levels. Service-level metrics represent the average across all instances.
|
Metric |
Description |
|
GPU Utilization |
GPU utilization of the service at that time. |
|
GPU Memory |
GPU memory usage and total GPU memory of the service at that time.
|
|
Memory Copy Utilization |
GPU memory copy utilization of the service at that time. |
|
GPU Memory Utilization |
GPU memory utilization of the service at that time. Calculation: Memory usage ÷ Total memory. |
|
PCIe |
PCIe (Peripheral Component Interconnect Express) rate of the service at that time, measured by DCGM. PCIe is a high-speed serial computer expansion bus standard.
|
|
Memory Bandwidth |
GPU memory bandwidth metric of the service at that time. |
|
SM Utilization and Occupancy |
SM (Streaming Multiprocessor) related metrics of the service at that time. SMs are core components of a GPU, responsible for executing and scheduling parallel computing tasks.
|
|
Graphics Engine Utilization |
GPU graphics engine utilization of the service at that time. |
|
Pipe Active Ratio |
Activity rate of the GPU compute pipelines of the service at that time.
|
|
Tflops Usage |
Tflops (Tera floating-point operations per second) compute volume of the GPU compute pipelines of the service at that time.
|
|
DRAM Active Ratio |
Activity rate of the GPU device memory interface sending or receiving data at that time. |
|
SM Clock |
SM clock frequency of the service at that time. |
|
GPU Temperature |
GPU temperature related metrics of the service at that time.
|
|
Power Usage |
GPU power consumption of the service at that time. |
VLLM Monitoring Dashboard
If the service has multiple instances, throughput-related metrics are the sum of instances. Latency-related metrics are the average of instances.
|
Metric |
Description |
|
Requests Status |
Total requests for the service at that time.
|
|
Token Throughput |
Number of input and generated tokens for all requests of the service at that time.
|
|
Request Completion Status |
Completion status statistics for all requests of the service at that time.
|
|
Time To First Token |
Time to first token latency for all requests of the service at that time (time from receiving a request to generating the first token).
|
|
Time Per Output Token |
Time per output token latency for all requests of the service at that time (average time required for each output token after the first token is generated).
|
|
E2E Request Latency |
End-to-end latency for all requests of the service at that time (time from receiving a request to returning all tokens).
|
|
Queue Time |
Queue waiting latency for all requests of the service at that time (time requests wait in queue for engine processing).
|
|
Inference Time |
Inference latency for all requests of the service at that time (time requests are processed by the engine).
|
|
Prefill Time |
Prefill stage latency for all requests of the service at that time (time the engine processes request input tokens).
|
|
Decode Time |
Decode stage latency for all requests of the service at that time (time the engine generates output tokens).
|
|
Input Token Length |
Number of input tokens processed by the service at that time.
|
|
Output Token Length |
Number of output tokens generated by the service at that time.
|
|
Request Parameters(params_n & max_tokens) |
Parameter N and parameter max_tokens for all requests of the service at that time.
|
|
GPU KV Cache Usage |
Average GPU KV cache utilization of the service at that time. |
|
CPU KV Cache Usage |
Average CPU KV cache utilization of the service at that time. |
|
Prefix Cache Hit Rate |
Average prefix cache hit rate for all requests of the service at that time.
|
|
HTTP Requests by Endpoint |
Number of requests for the service at that time, grouped by request method, path, and response status code. |
|
HTTP Request Latency |
Average latency for different request paths of the service at that time. |
|
Speculative Decoding Throughput |
Speculative decoding count for the service at that time. For services with multiple instances, this metric is the average across all instances.
|
|
Speculative Decoding Efficiency |
Speculative decoding performance of the service at that time.
|
|
Token Acceptance by Position |
Number of Drafts Tokens accepted at different generation positions for the service at that time. For services with multiple instances, this metric is the average across all instances. |
SGLang Monitoring Dashboard
If the service has multiple instances, throughput-related metrics are the sum of instances. Latency-related metrics are the average of instances.
|
Metric |
Description |
|
Requests Num |
Total requests for the service at that time.
|
|
Token Throughput |
Number of input and generated tokens for all requests of the service at that time.
|
|
Time To First Token |
Time to first token latency for all requests of the service at that time. Time to first token latency is the time from receiving a request to generating the first token.
|
|
Time Per Output Token |
Time per output token latency for all requests of the service at that time. Time per token latency is the average time required for each subsequent output token after the first token is generated.
|
|
E2E Request Latency |
End-to-end latency for all requests of the service at that time. End-to-end latency is the time from receiving a request to returning all tokens.
|
|
Cache Hit Rate |
Average prefix cache hit rate for all requests of the service at that time. |
|
Used Tokens Num |
Number of KV cache tokens used by the service at that time. For services with multiple instances, this metric is the average across all instances. |
|
Token Usage |
Average KV cache token utilization of the service at that time. For services with multiple instances, this metric is the average across all instances. |
FAQ
Q: LLM Monitoring Dashboard Missing from Monitoring Page
Problem Description: After deploying a model using EAS custom deployment, the monitoring page only shows general Service and GPU monitoring, and LLM monitoring is missing.
Root Cause: The service configuration lacks the key tag ServiceEngineType. This tag explicitly declares the backend inference engine type.
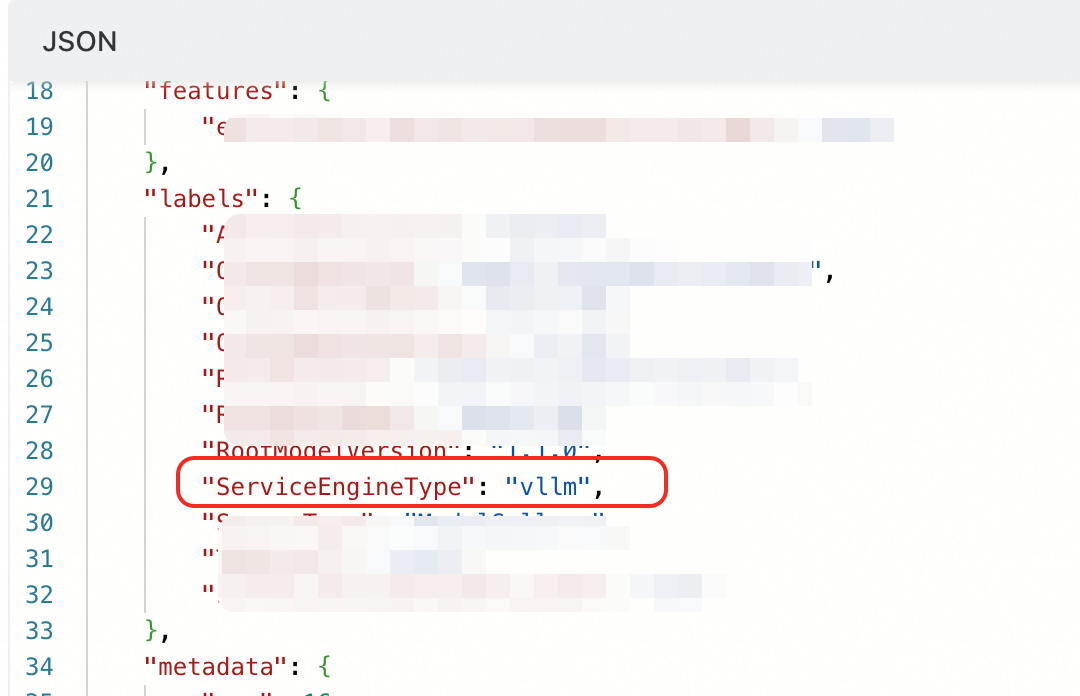
Other parameters provided by Model Gallery deployment do not affect LLM monitoring, except for the ServiceEngineType tag.
Solution: Update the service configuration. Add the ServiceEngineType tag. Set its value based on the inference deployment engine used (only vllm or sglang are supported).
Q: Why do /metrics 200 frequently appear in logs?
After the ServiceEngineType tag is correctly configured and takes effect, the EAS backend periodically calls the inference deployment framework's /metrics API operation. This occurs approximately every 10-15 seconds, including the collection interval and polling across all pods. This API operation provides real-time framework metrics in Prometheus format, which the frontend uses to render LLM monitoring data.
Reference
-
After enabling service monitoring alerts, you will receive alert notifications when the service triggers alert rules.
-
View EAS Cloud Monitor events through the Cloud Monitor console or API operation to perform O&M, auditing, or alert settings for these events.
-
Set custom monitoring metrics for Auto Scaling based on business logic. For more information, see Custom Monitoring and Scaling Metrics.