Report custom metrics from your service code and use them in EAS monitoring dashboards and auto scaling rules.
How it works
-
Add a reporting call to your service code that periodically POSTs metric data to
http://localhost:8080/api/builtin/realtime_metrics. -
Declare the metric in your service JSON configuration. EAS reads this declaration at deployment time and creates a monitoring dashboard.
-
After deployment, view the metric on the Service Monitoring tab. Data appears within one minute and is retained for one week.
-
(Optional) Use the custom metric in an auto scaling rule.
Limitations
-
The
metricsfield is supported only for services deployed with a custom image or custom processor. -
Auto scaling supports only QPS (queries per second) and CPU utilization as built-in scaling triggers. To scale on other signals, use custom metrics.
Prerequisites
Ensure the following conditions are met:
-
A service is deployed with a custom image or custom processor.
Step 1: Report metrics from your service code
Add a periodic call in your service code to POST metric data to the following endpoint:
POST http://localhost:8080/api/builtin/realtime_metricsThe request body is a JSON array. Each element represents one metric sample:
[
    {
        "name": "qps",
        "tags": {
            "status": "200"
        },
        "value": 20
    },
    {
        "name": "qps",
        "tags": {
            "status": "400"
        },
        "value": 13
    }
]| Field | Required | Description |
|---|---|---|
name |
Yes | Metric name. Must match the name declared in the service JSON configuration. |
value |
Yes | Numeric value of the metric sample. |
tags |
No | Key-value pairs that add dimensions to the metric. Tags split one metric into multiple series. For example, track QPS separately for each HTTP status code. In auto scaling rules, reference a tagged metric as custom[<name>]@<tag-key>[<tag-value>]. |
To report a metric without dimensions, omit tags:
[
    {
        "name": "qps",
        "value": 20
    }
]
Step 2: Declare the metric in your service configuration
Add a metrics field to your service JSON configuration. EAS uses this declaration to create the monitoring dashboard.
Example: deploy a custom image service with a qps metric and a status tag:
{
  "name": "metrics_test",
  "containers": [
    {
      "image": "registry-vpc.cn-chengdu.aliyuncs.com/eas/eas-image-****:metrics",
      "command": "python3 -u /image.py",
      "port": 5000
    }
  ],
  "metrics": [
    {
      "name": "qps",
      "tags": "status"
    }
  ],
  "metadata": {
    "instance": 1,
    "cpu": 2,
    "memory": 1000
  }
}
Replace the image value with your own image URL. The metrics field supports the following parameters:
| Parameter | Required | Description |
|---|---|---|
name |
Yes | Metric name. EAS creates a dashboard for this metric. Auto scaling rules reference it as custom[<name>]. |
tags |
No | Tag key name that splits the metric into series. For example, "tags": "status" separates values for status=200 and status=400. Reference individual series in auto scaling rules as custom[<name>]@status[<value>]. |
For other configuration parameters, see JSON deployment parameters.
Deploy the service:
-
Go to the Deploy Service page. For more information, see Model service deployment by using the PAI console.
-
In the Configuration Editor section, click JSON Deployment and paste your JSON configuration.
-
Click Deploy.
Step 3: View custom metrics
After deployment, metric data appears in the dashboard within one minute. Data is retained for one week.
To view custom metrics:
-
On the EAS-Online Model Services page, click the service name to open Service Details.
-
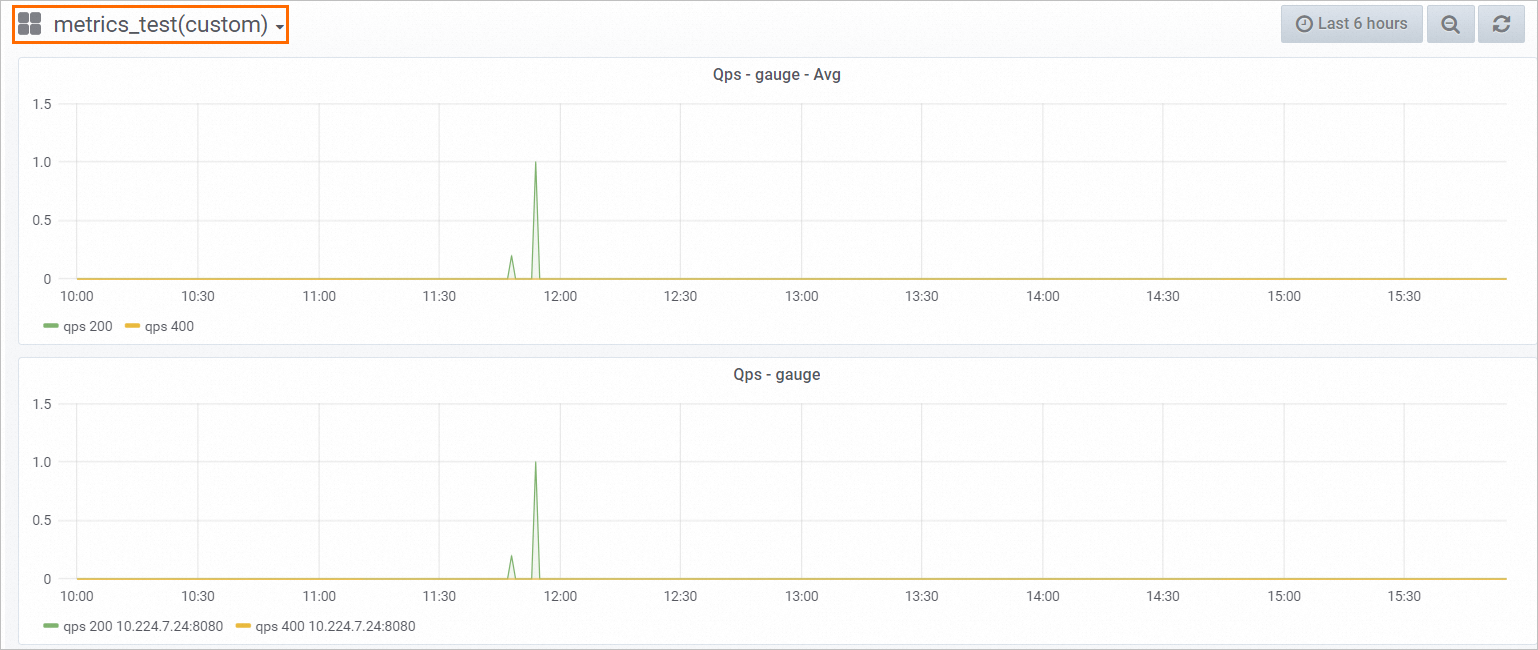
On the Service Monitoring tab, select the custom metric from the upper-left drop-down list.
The dashboard shows:
-
Average metric value across all instances
-
Metric value for each individual instance
Step 4: Configure auto scaling
Custom metrics work the same as built-in metrics in auto scaling rules. The metric name format depends on whether tags are configured.
For more information about auto scaling, see Horizontal auto scaling.
Auto scaling metric name syntax
| Configuration | Format | Example |
|---|---|---|
| No tags | custom[<metric-name>] |
custom[qps] |
| With a tag | custom[<metric-name>]@<tag-key>[<tag-value>] |
custom[qps]@status[200] |
Syntax breakdown: custom[qps]@status[200]=3
-
custom[qps]-- custom metric namedqps -
@status[200]-- filter by tagstatus=200 -
=3-- scaling threshold. EAS scales out when the average exceeds 3 and scales in when it drops below 3.
Configure with eascmd
For more information, see the "Method 2: Manage the horizontal auto scaling feature by using a client" section in Enable or disable the horizontal auto-scaling feature.
No tags -- scale when average QPS exceeds 3:
eascmd autoscale service_name -Dmin=1 -Dmax=10 -Dstrategies.custom[qps]=3With a tag -- scale based on QPS where status=200:
eascmd autoscale service_name -Dmin=1 -Dmax=10 -Dstrategies.custom[qps]@status[200]=3Configure in the console
For more information, see the "Method 1: Manage the horizontal auto scaling feature in the console" section in Enable or disable the horizontal auto-scaling feature.
In the Auto Scaling Settings dialog box, in the Custom Scaling Metric section, enter:
-
No tags: enter
custom[qps]as the metric name and3as the metric value.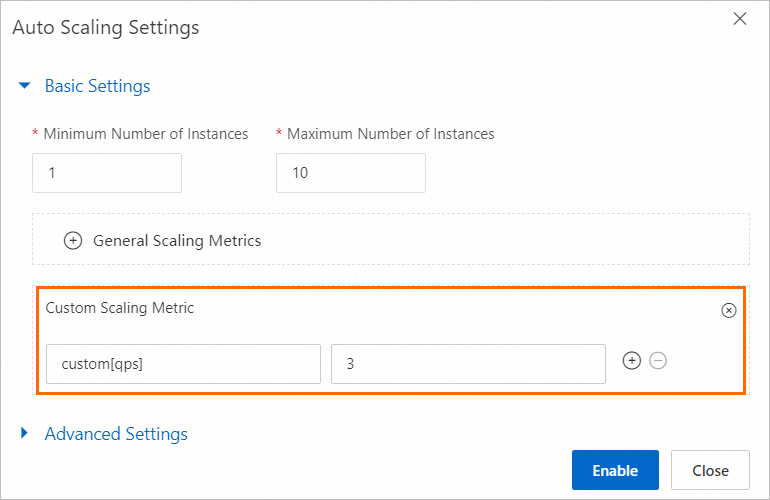
-
With a tag: enter
custom[qps]@status[200]as the metric name and3as the metric value.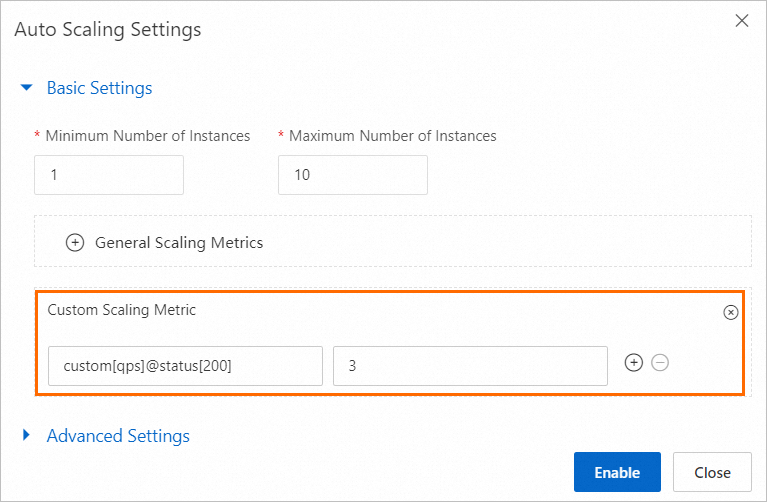
What's next
-
Horizontal auto scaling: configure scaling policies with built-in or custom metrics.
-
Custom images: deploy services with your own container image.
-
Custom processors: extend EAS inference with custom processing logic.