Monitor the resource usage of PAI-Data Science Workshop (DSW) instances using detailed metrics for CPU, memory, and GPU. You can also configure alerts and notifications by using CloudMonitor or Application Real-Time Monitoring Service (ARMS). When a resource metric is abnormal, such as when GPU utilization exceeds a threshold, the system triggers an alert, helping you track the instance's load status in real time.
Applicable scope
Monitoring currently supports DSW instances created from Subscription Resources (General-purpose Computing Resources and Lingjun Intelligent Computing Resources). It does not support DSW instances created from Public Resources.
Overview of monitoring methods
DSW provides several monitoring methods. Choose the method that best suits your needs and use case.
Monitoring method | Features | Scenarios | Billing information |
| View the real-time resource status of a single instance during development or debugging. | Free of charge | |
| Perform routine, automated monitoring and set up anomaly alerts for DSW instances in a production environment. | CloudMonitor is billed separately. For more information about billing, see CloudMonitor billing information. | |
| Customize monitoring dashboards, perform multi-dimensional data analysis, or integrate DSW monitoring into a unified ARMS observability system. | ARMS is billed separately. For more information about billing, see ARMS billing information. |
View the monitoring page in the DSW console
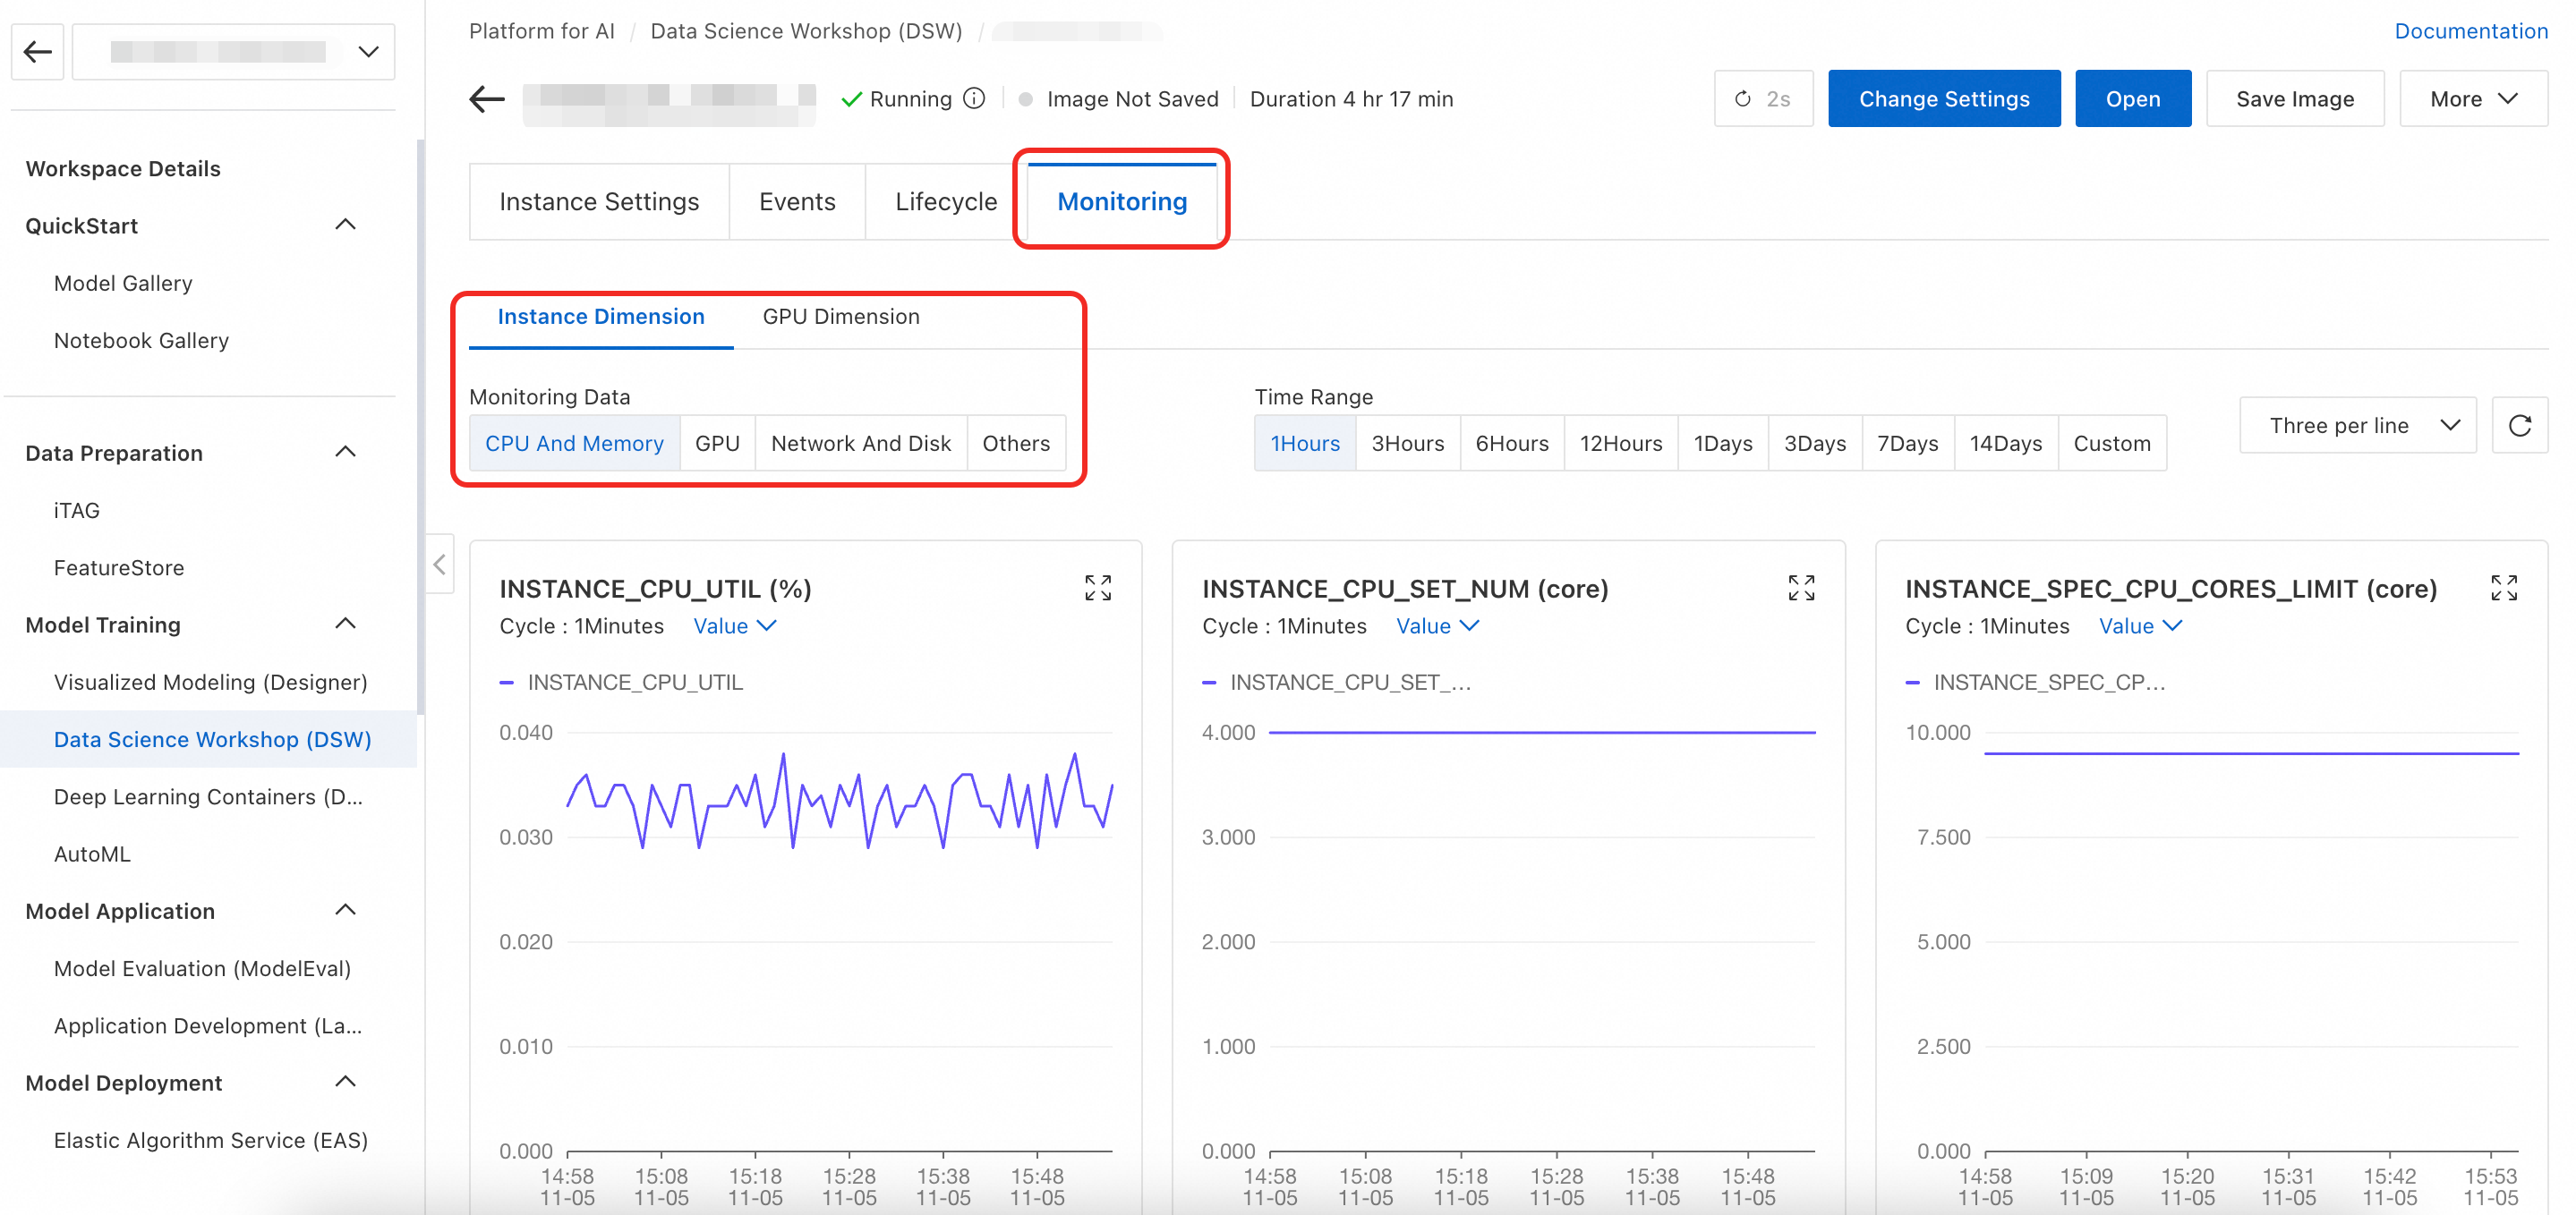
On the DSW instance list page, click an instance name to open its details page. Click the Monitoring tab. This page shows the instance's resource status, including CPU, memory, and GPU.
Use CloudMonitor to configure monitoring and alerts
CloudMonitor is a service that monitors Alibaba Cloud resources and internet applications. It provides a one-stop, enterprise-grade monitoring solution for cloud users. Log in to the CloudMonitor console to view DSW instance monitoring data and configure alert notifications. CloudMonitor also supports subscribing to metric data through an API to build your own monitoring systems and dashboards.
View monitoring data
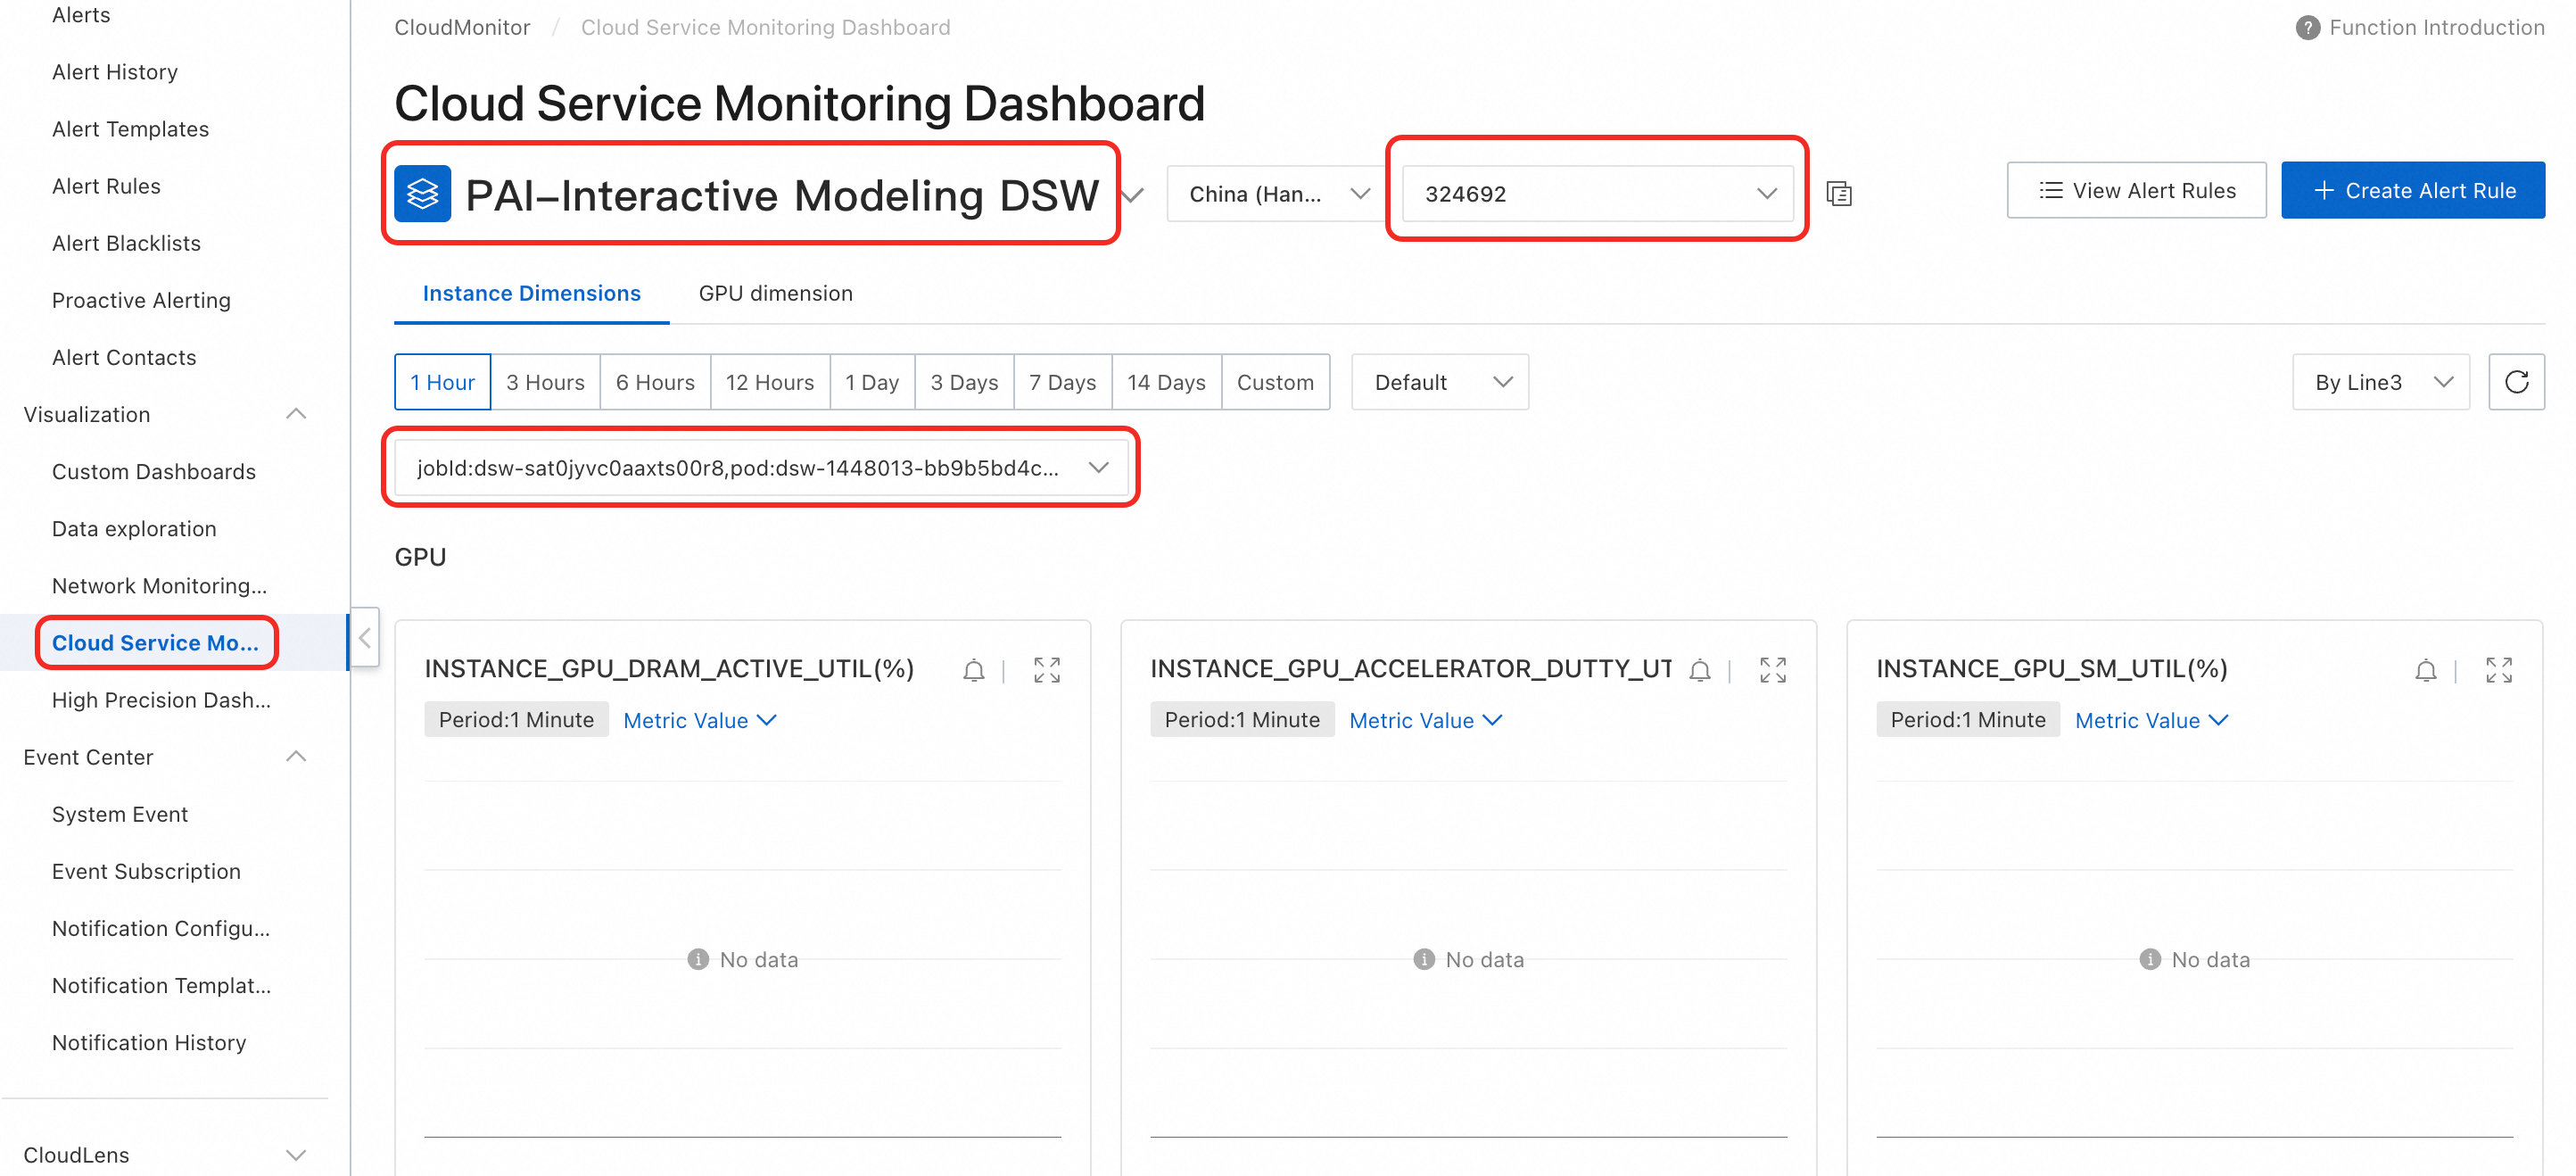
Log on to the CloudMonitor console. In the navigation pane on the left, click Cloud Service Monitoring. Search for and select PAI-Interactive Modeling DSW, then select the workspace and instance you want to query.
To obtain the workspace ID, see Manage workspaces. To obtain the instance ID, see Access and manage DSW in the console.
Configure monitoring alerts
You can use the monitoring and alert feature to monitor the resource usage of DSW instances and configure flexible alert rules.
Configure alert contacts
Log on to the Cloud Monitor console.
In the left-side navigation pane, choose .
On the Alert Contacts tab, click Create Alert Contact.
In the Set Alert Contact panel, enter the name, email address, and webhook URL of the alert contact.
Click OK.
On the Alert Contact Group tab, click Create Alert Contact Group.
In the Create Alert Contact Group panel, enter a name for the alert contact group and add alert contacts to the alert contact group.
Click Confirm.
Configure alert rules
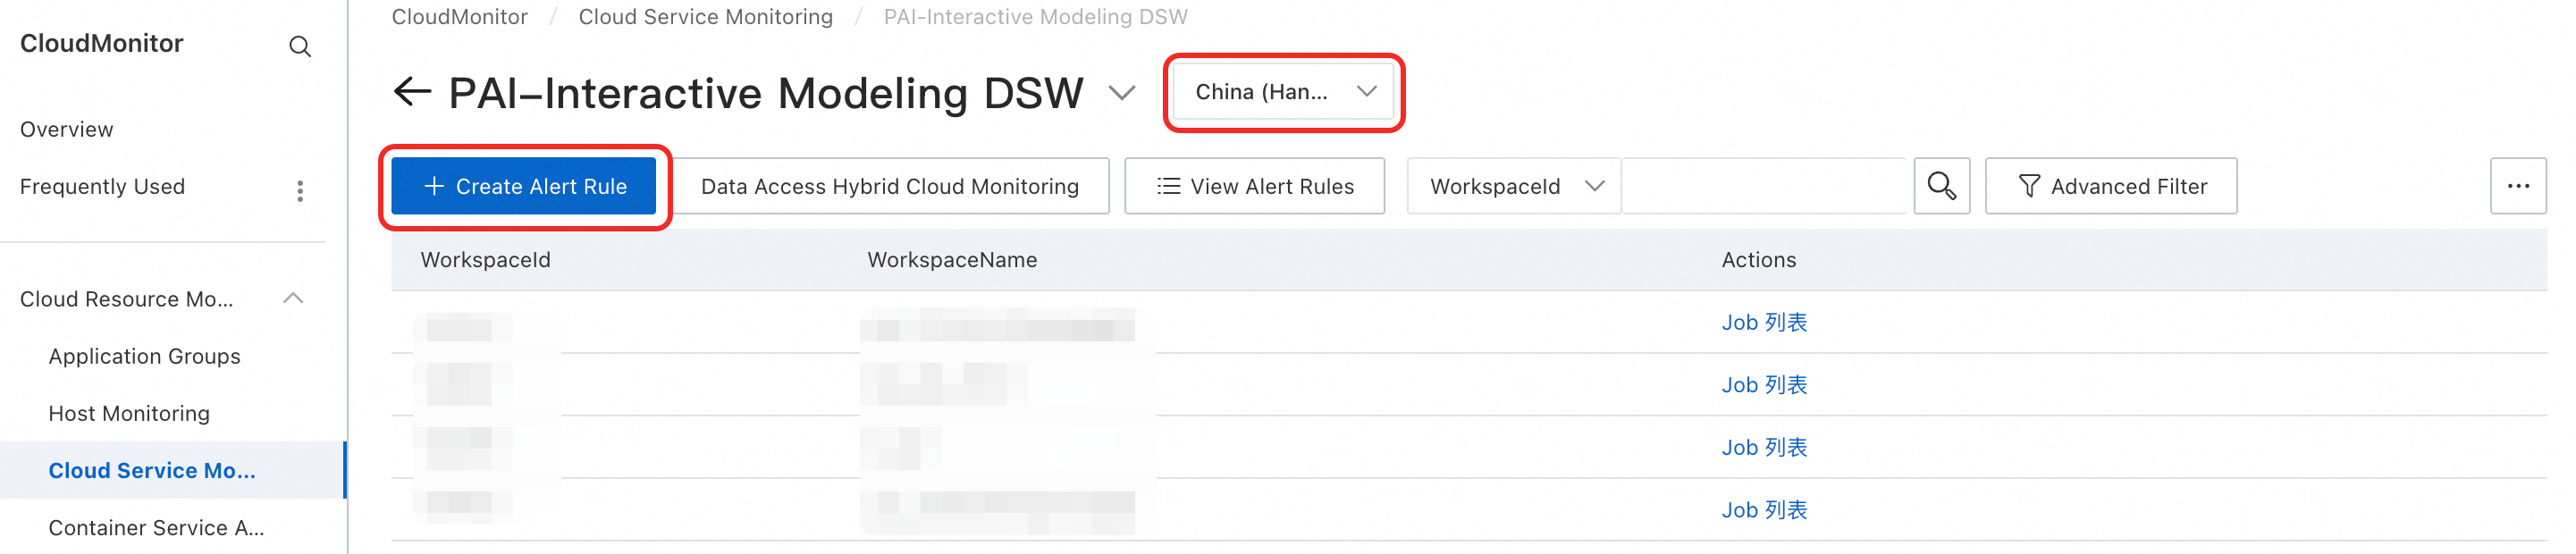
In the navigation pane on the left of the CloudMonitor console, click . Then, search for and select PAI-Interactive Modeling DSW.
On the PAI-Interactive Modeling DSW page, select the service region and click Create Alert Rule.
On the Create Alert Rule page, configure the following key parameters and click Confirm. For more information about the parameters, see Create an alert rule.
Parameter
Description
Product
Select PAI-Data Science Workshop (DSW).
Resource Range
The scope to which the alert rule applies:
All Resources: The alert rule applies to all DSW resources.
Application Group: The alert rule applies to all resources within a specified DSW application group.
Instance: The alert rule applies to instances under a specified DSW workspace.
Rule Description
The conditions that trigger the alert. For instructions on how to set the rule description, see Create an alert rule.
Mute Period
The interval between repeated notifications for an unresolved alert.
Effective Period
The period when the alert rule is active. The rule only checks if an alert needs to be triggered during this period.
Alert Contact Group
The contact group to which alerts are sent. Ensure the group contains alert contacts.
On the PAI-Data Science Workshop (DSW) page, click View Alert Rules to see details of created alert rules, alert history, and more.
Use ARMS to configure monitoring and alerts
Application Real-Time Monitoring Service (ARMS) is an Alibaba Cloud-native observability platform. With ARMS, you can customize a Grafana dashboard for DSW and use Prometheus to configure flexible alert rules.
Provision monitoring data
Follow these steps:
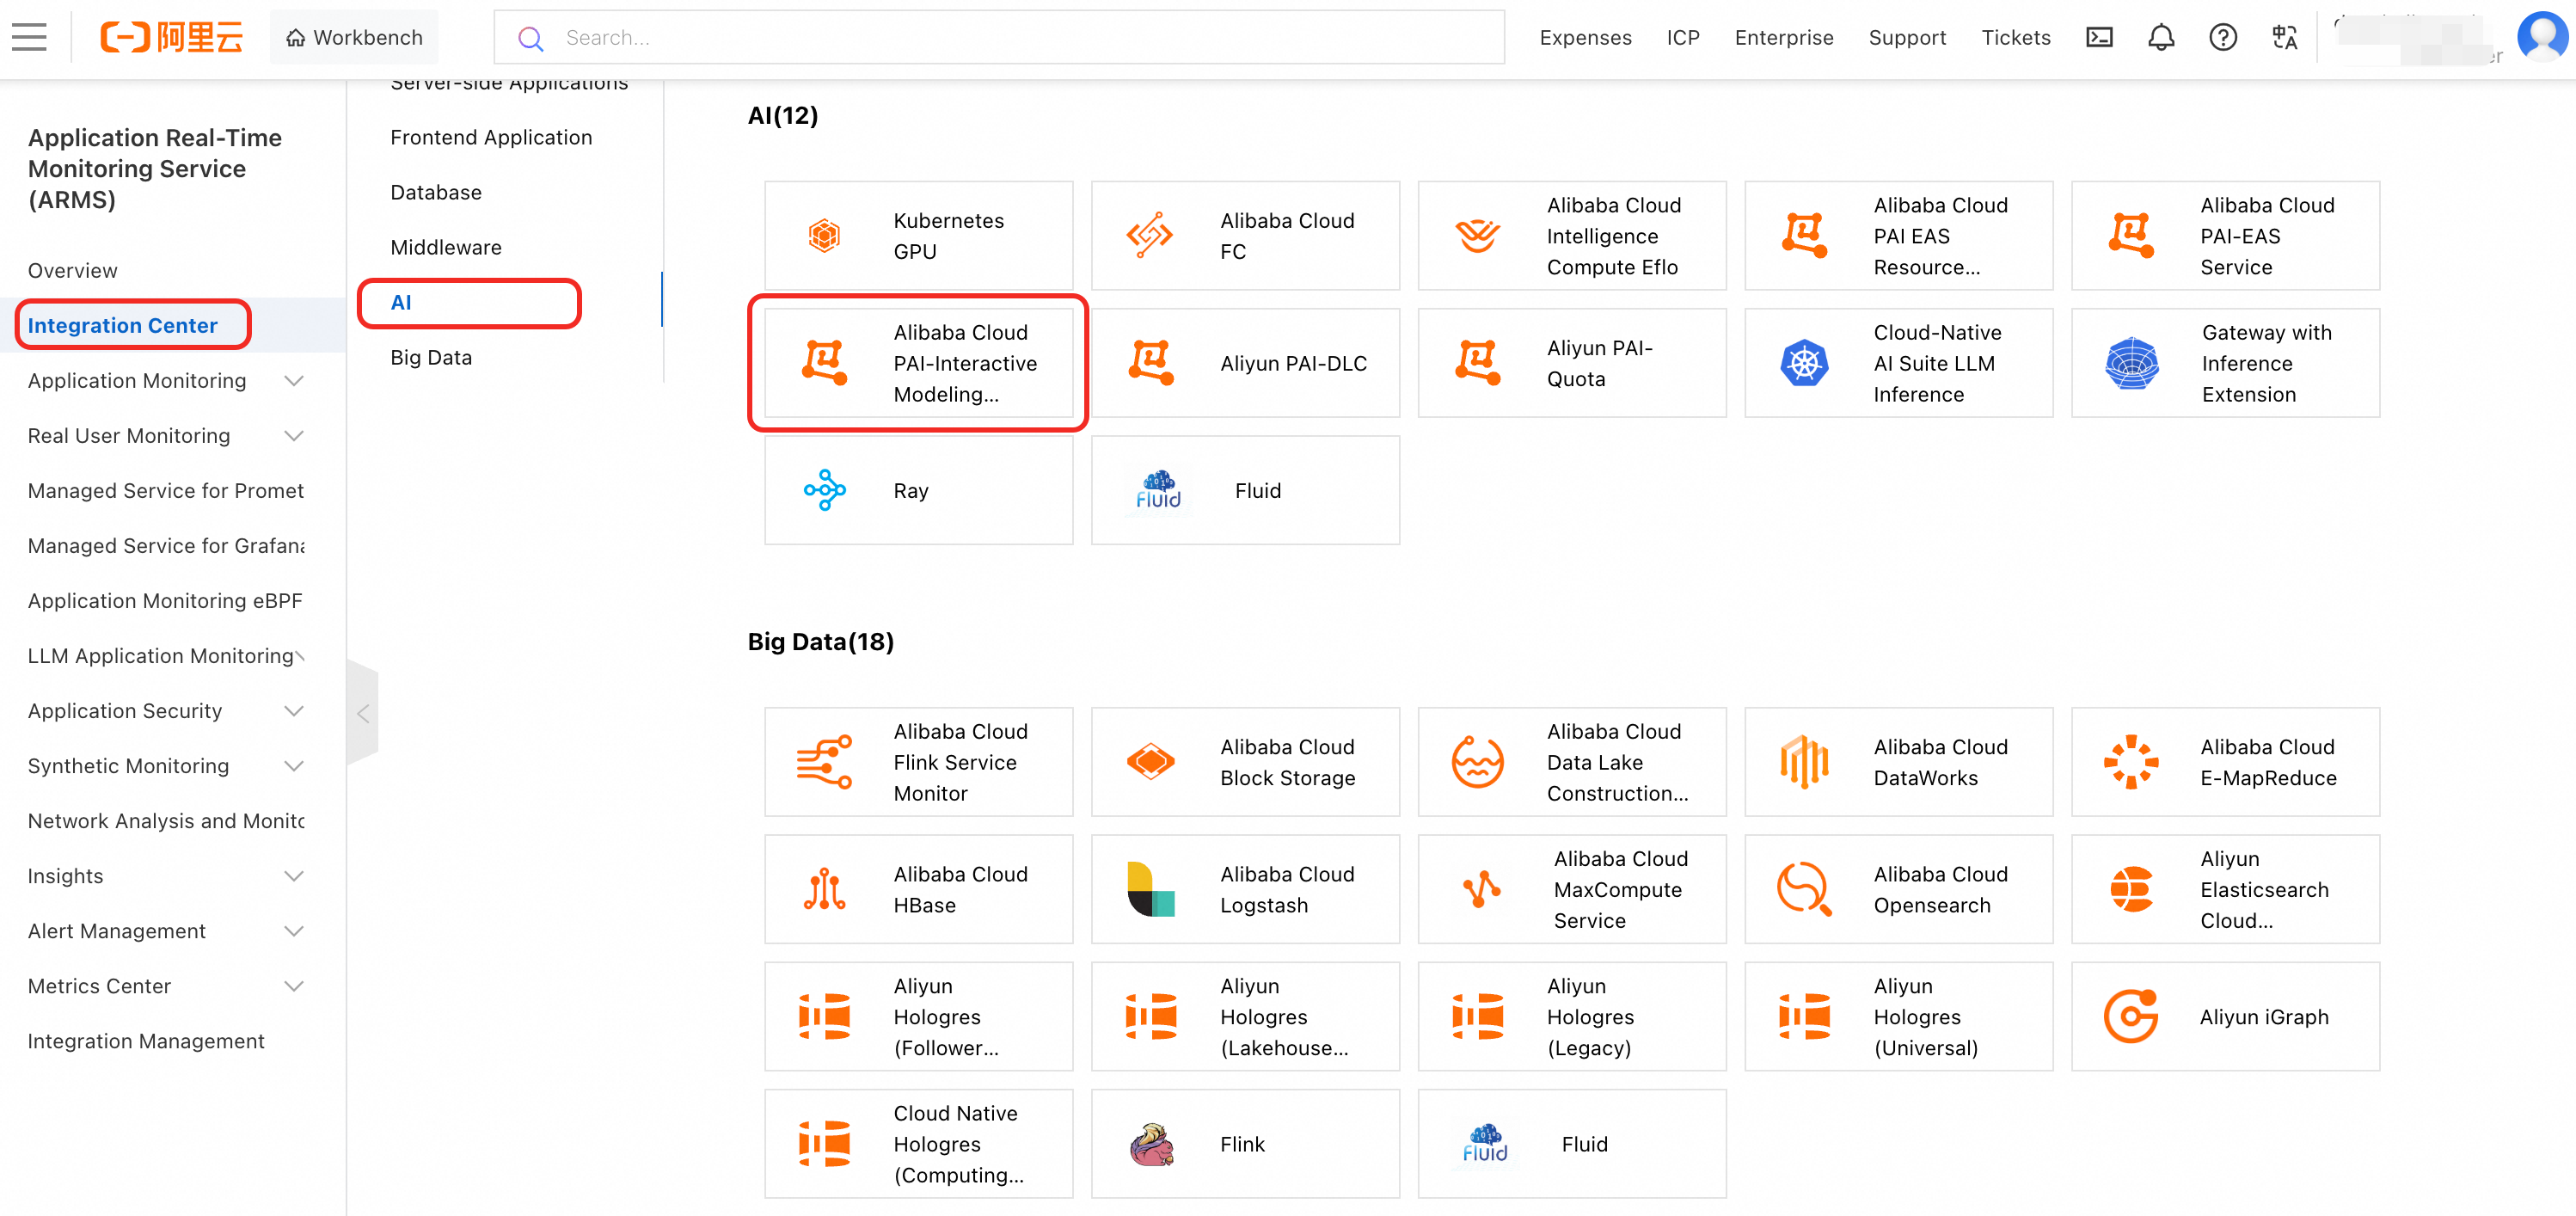
Log on to the ARMS console. In the navigation pane on the left, click Integration Center > AI, and then click Alibaba Cloud PAI-Interactive Modeling (DSW).
In the Start Integration tab of the panel that appears, select a region for storage, configure an Access Name, and then click OK.
Provisioning DSW takes one to two minutes. You can also switch to the Preview, Collect Metrics, or Alert Rule Template tab to view the monitoring dashboard, supported metrics, or alert rule details, respectively.
After provisioning is complete, in the navigation pane on the left, choose Provisioning > Integration Management to see the Alibaba Cloud PAI-Interactive Modeling (DSW) component.
View the Grafana dashboard
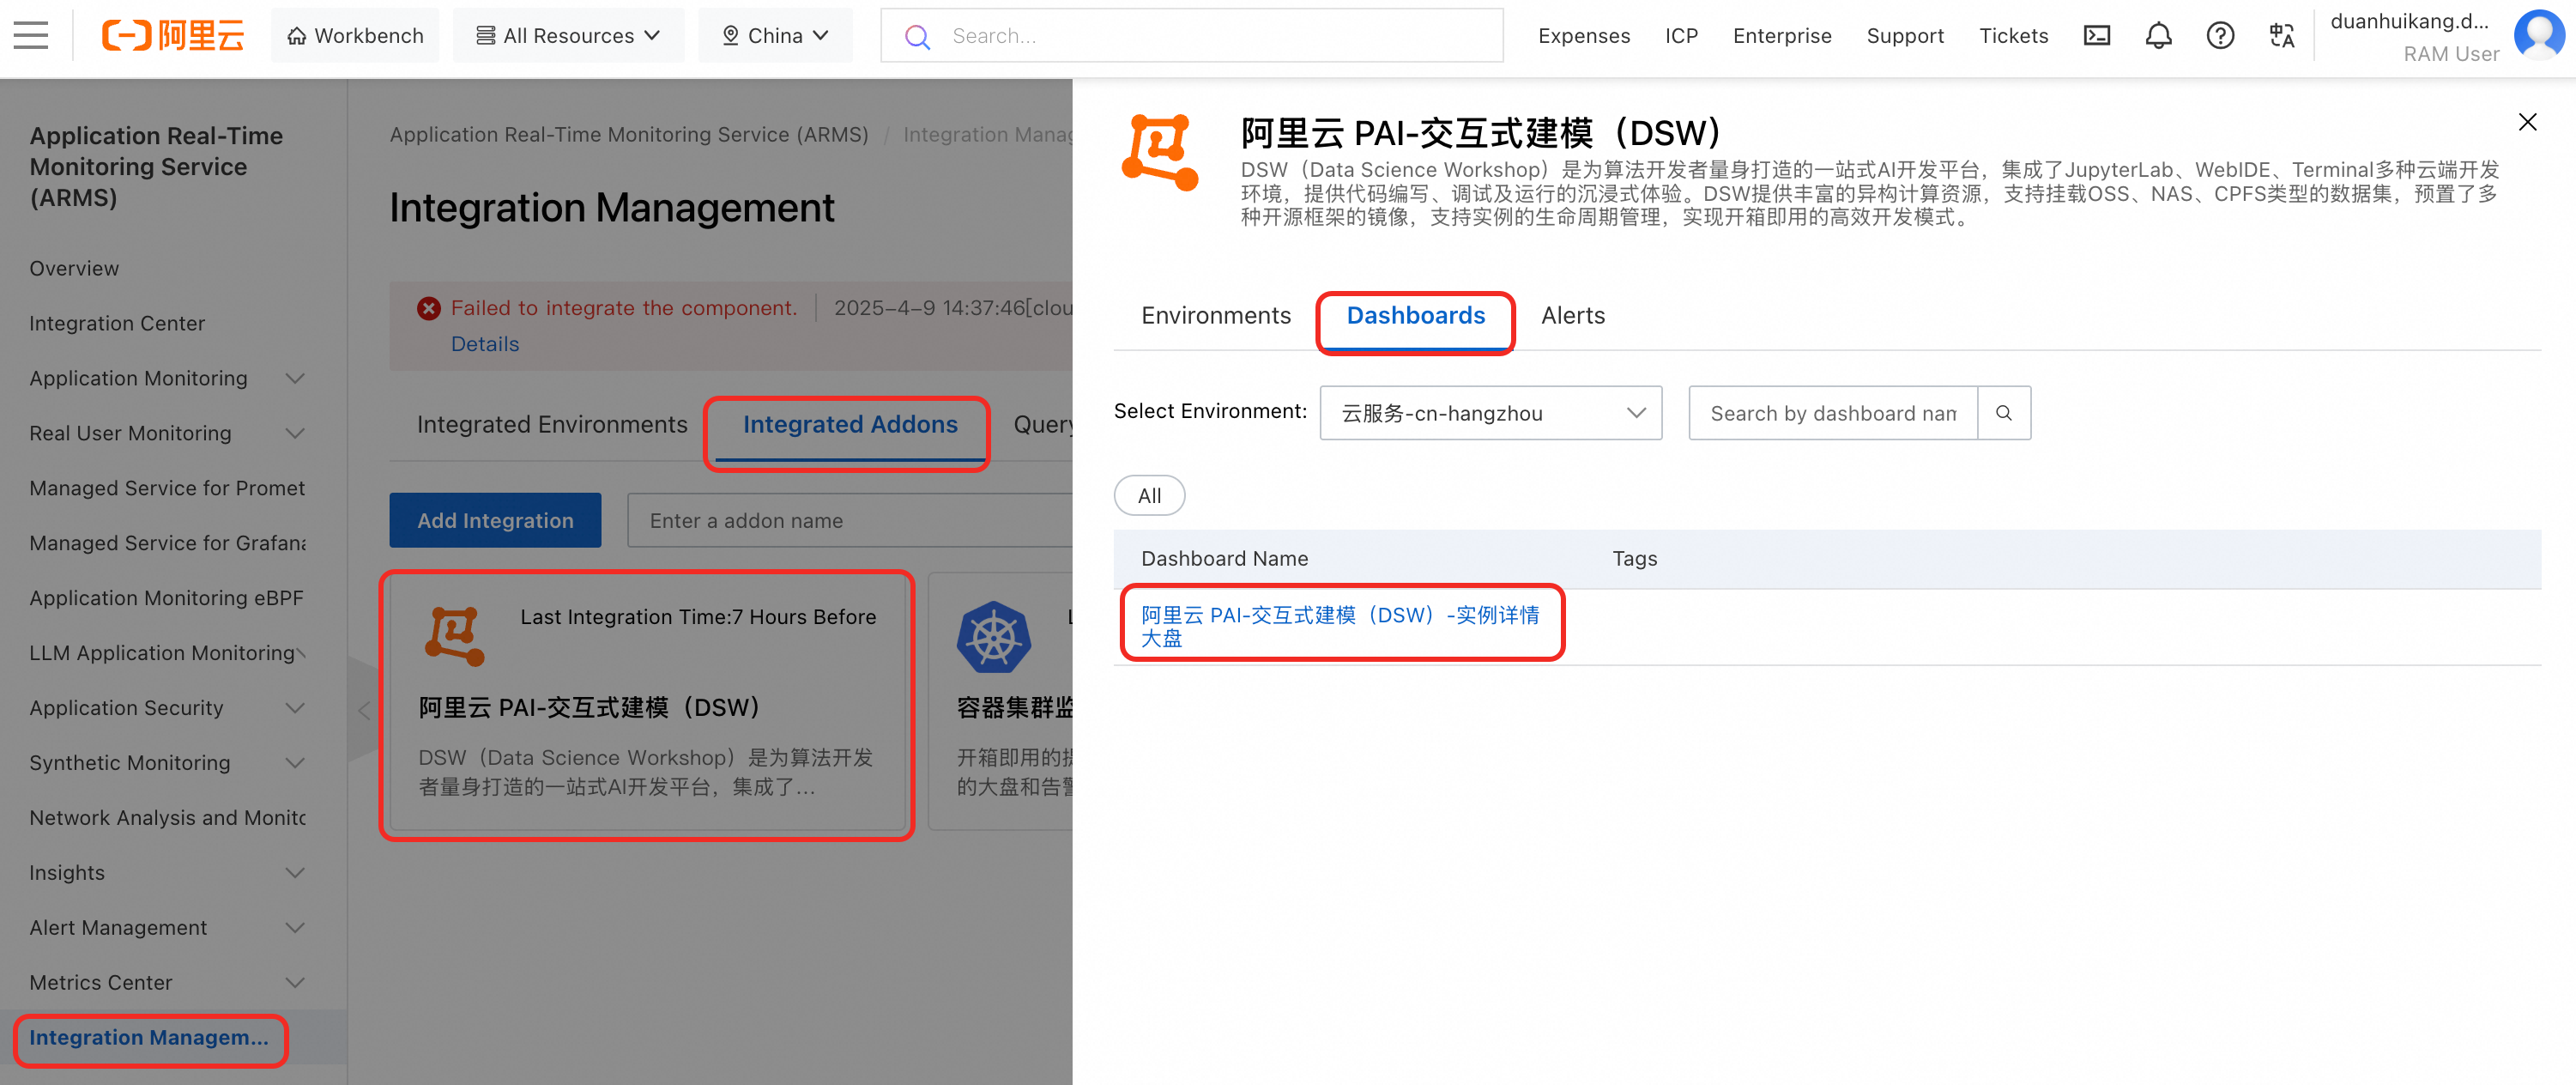
Log on to the ARMS console. In the navigation pane on the left, click Integration Management > Integrated Addons > Alibaba Cloud PAI-Interactive Modeling (DSW) > Dashboard. Click a dashboard name to view the built-in Grafana dashboard.
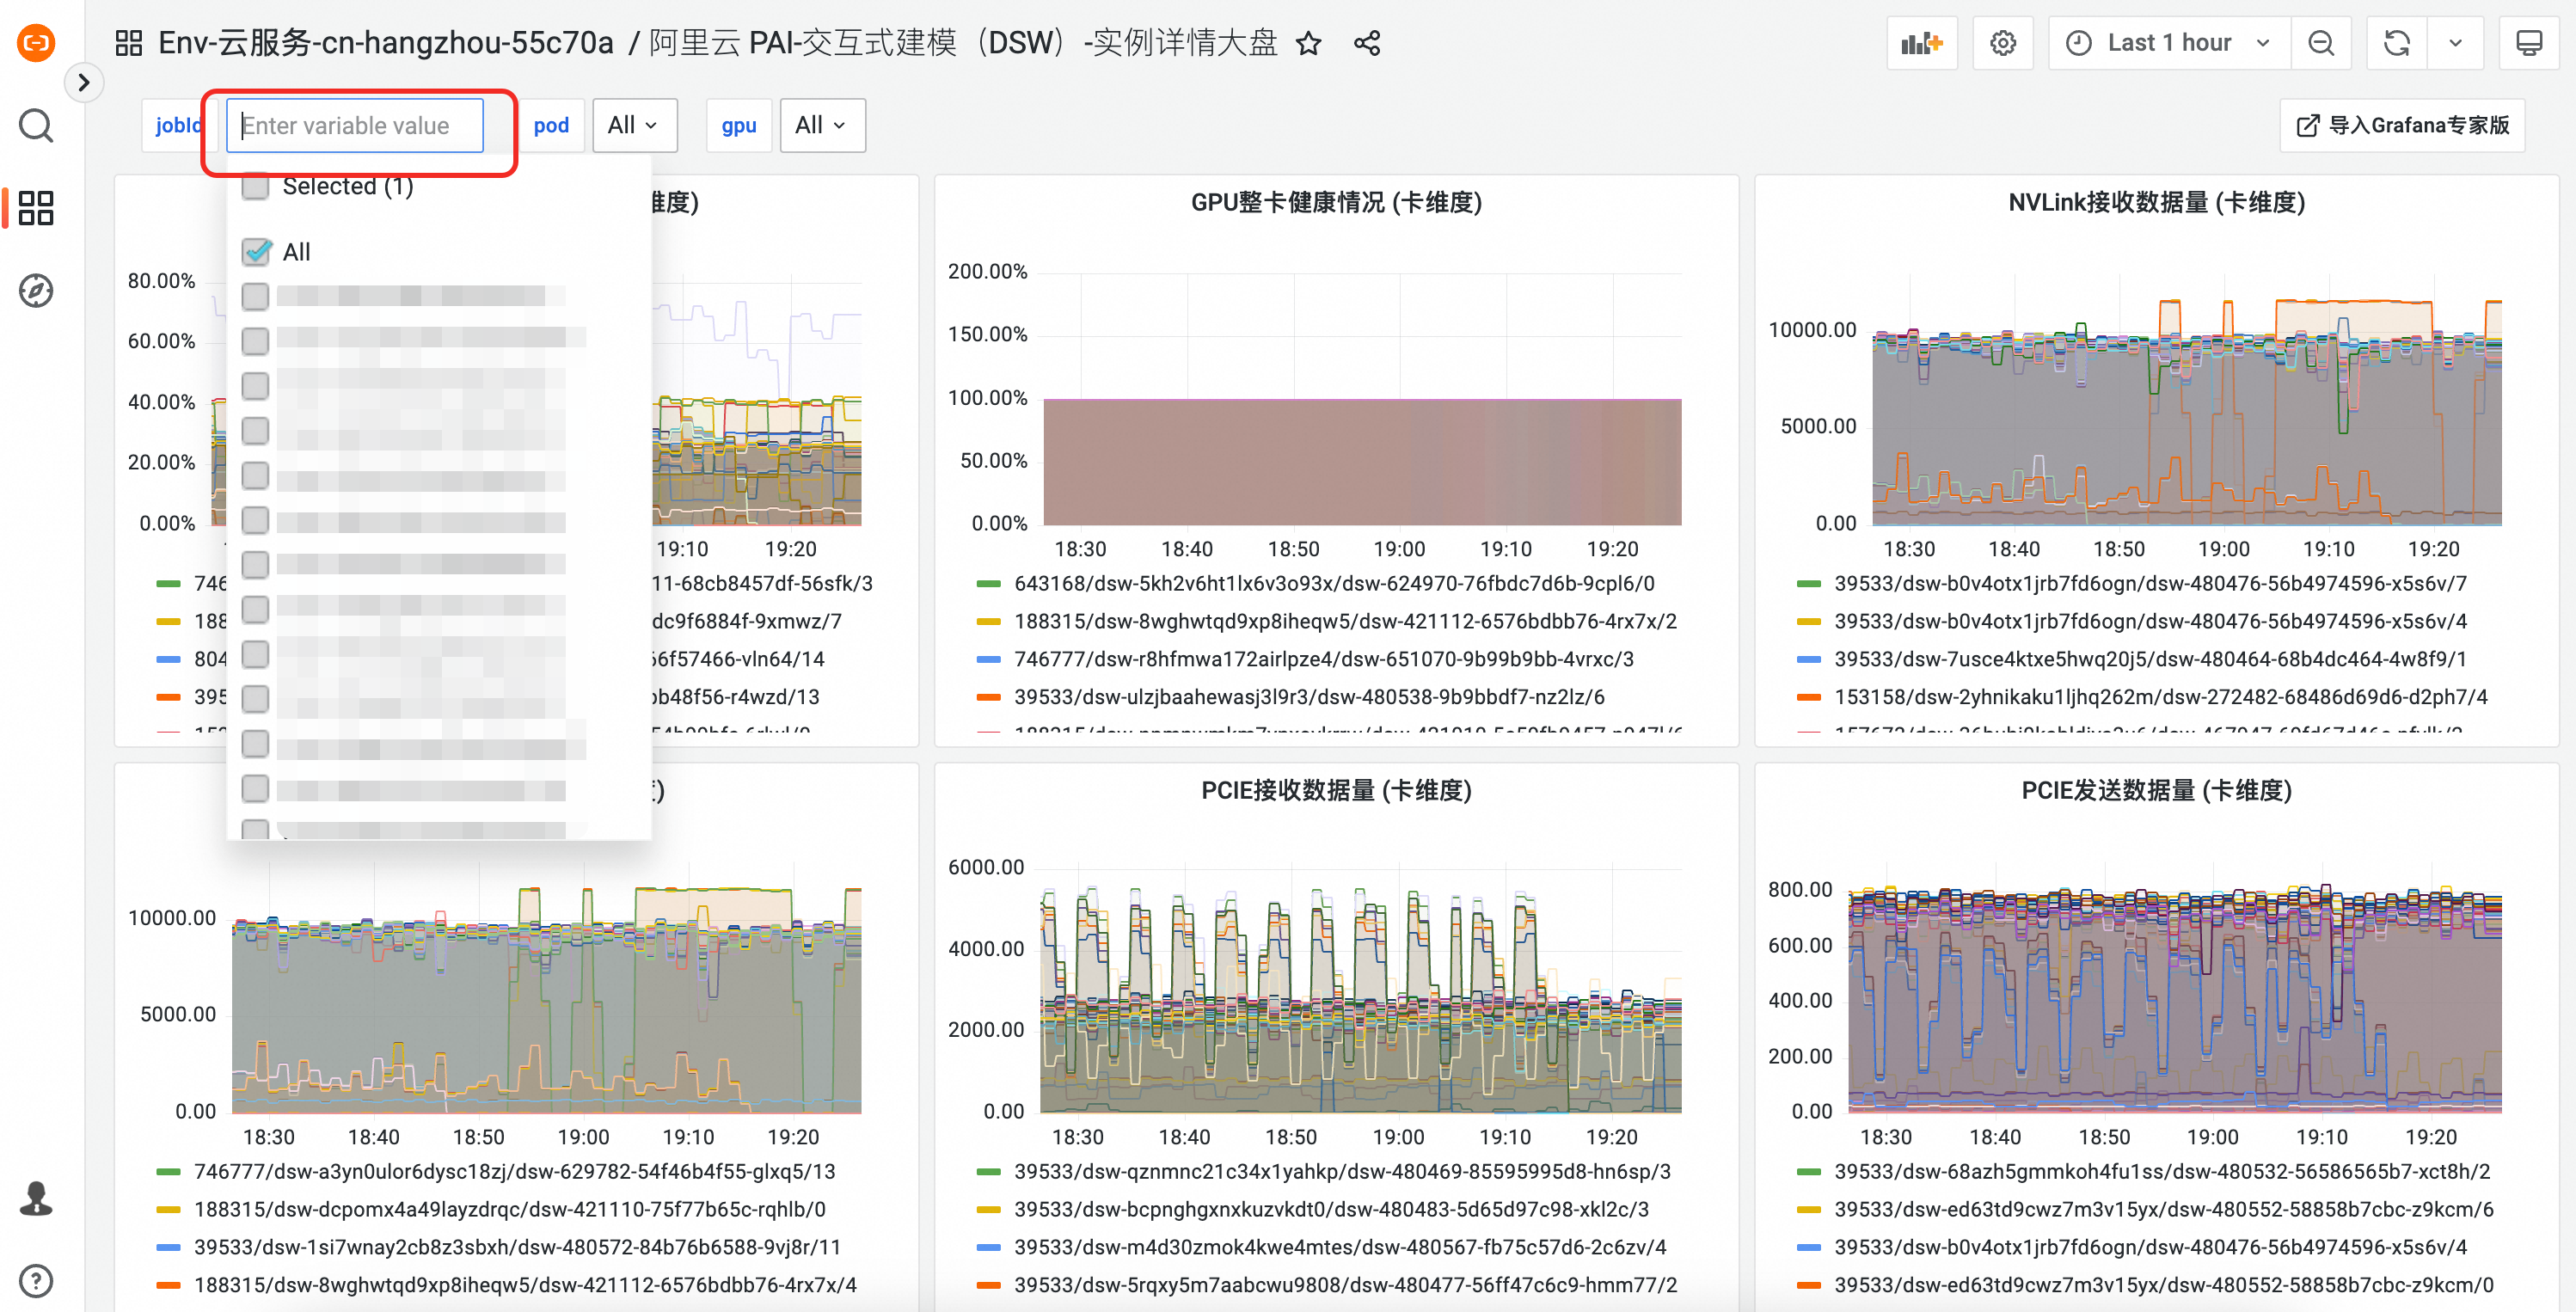
The Grafana dashboard page lets you view the status of a specific DSW instance by its ID.
Configure Prometheus alerts
Log on to the ARMS console. In the navigation pane on the left, click Integration Management > Integrated Addons > Alibaba Cloud PAI-Interactive Modeling (DSW) > Alerts to view the built-in alert rules.
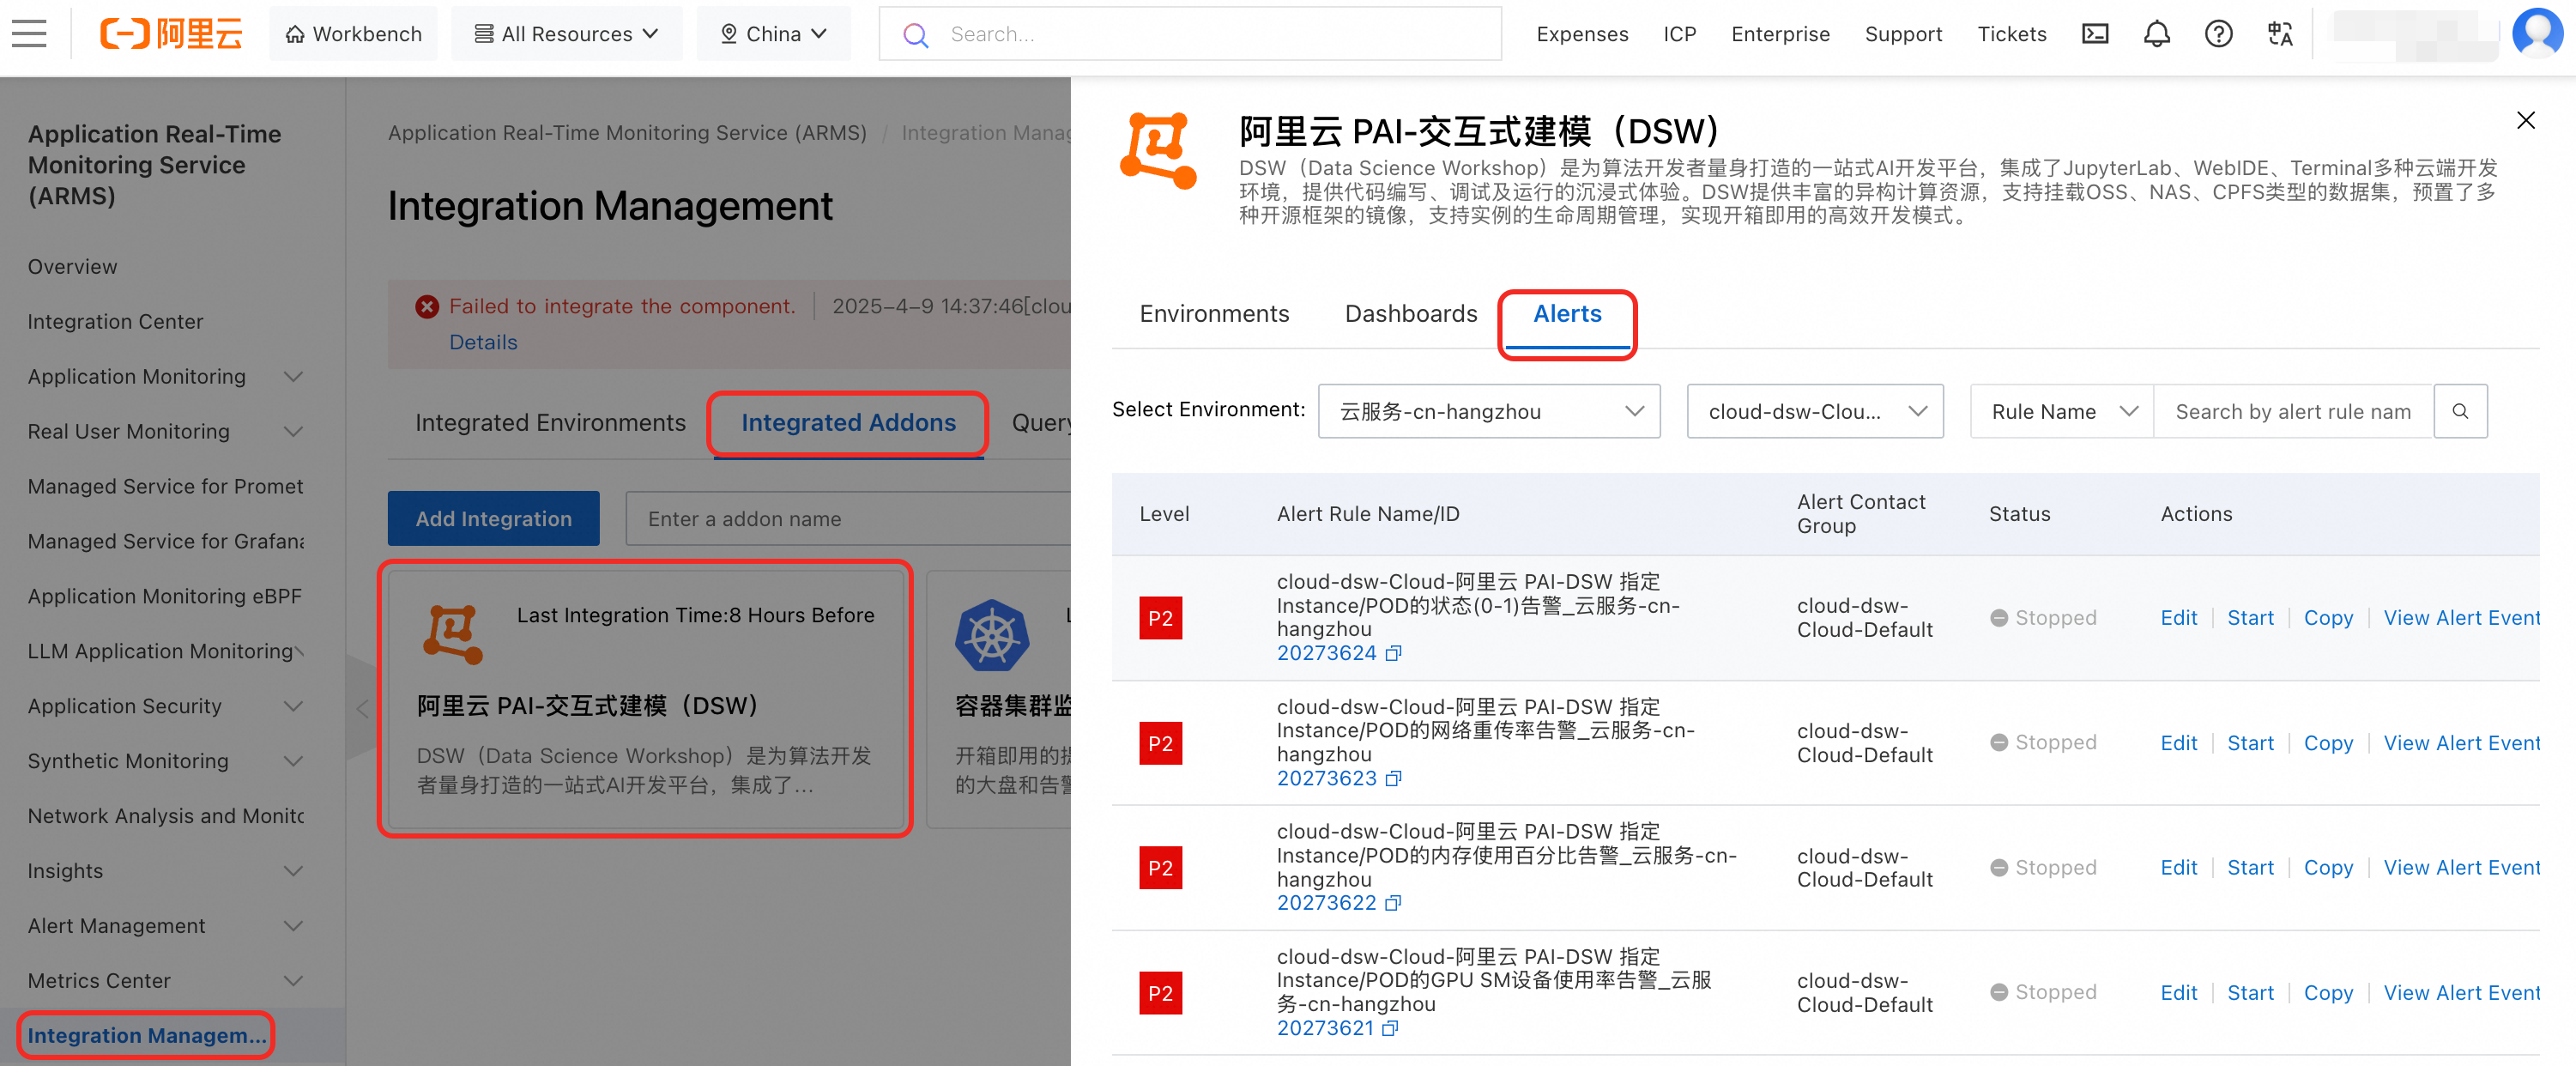
The built-in alert rules generate alert events but do not send notifications. You can configure notifications to be sent to email or other platforms using one of the following two methods:
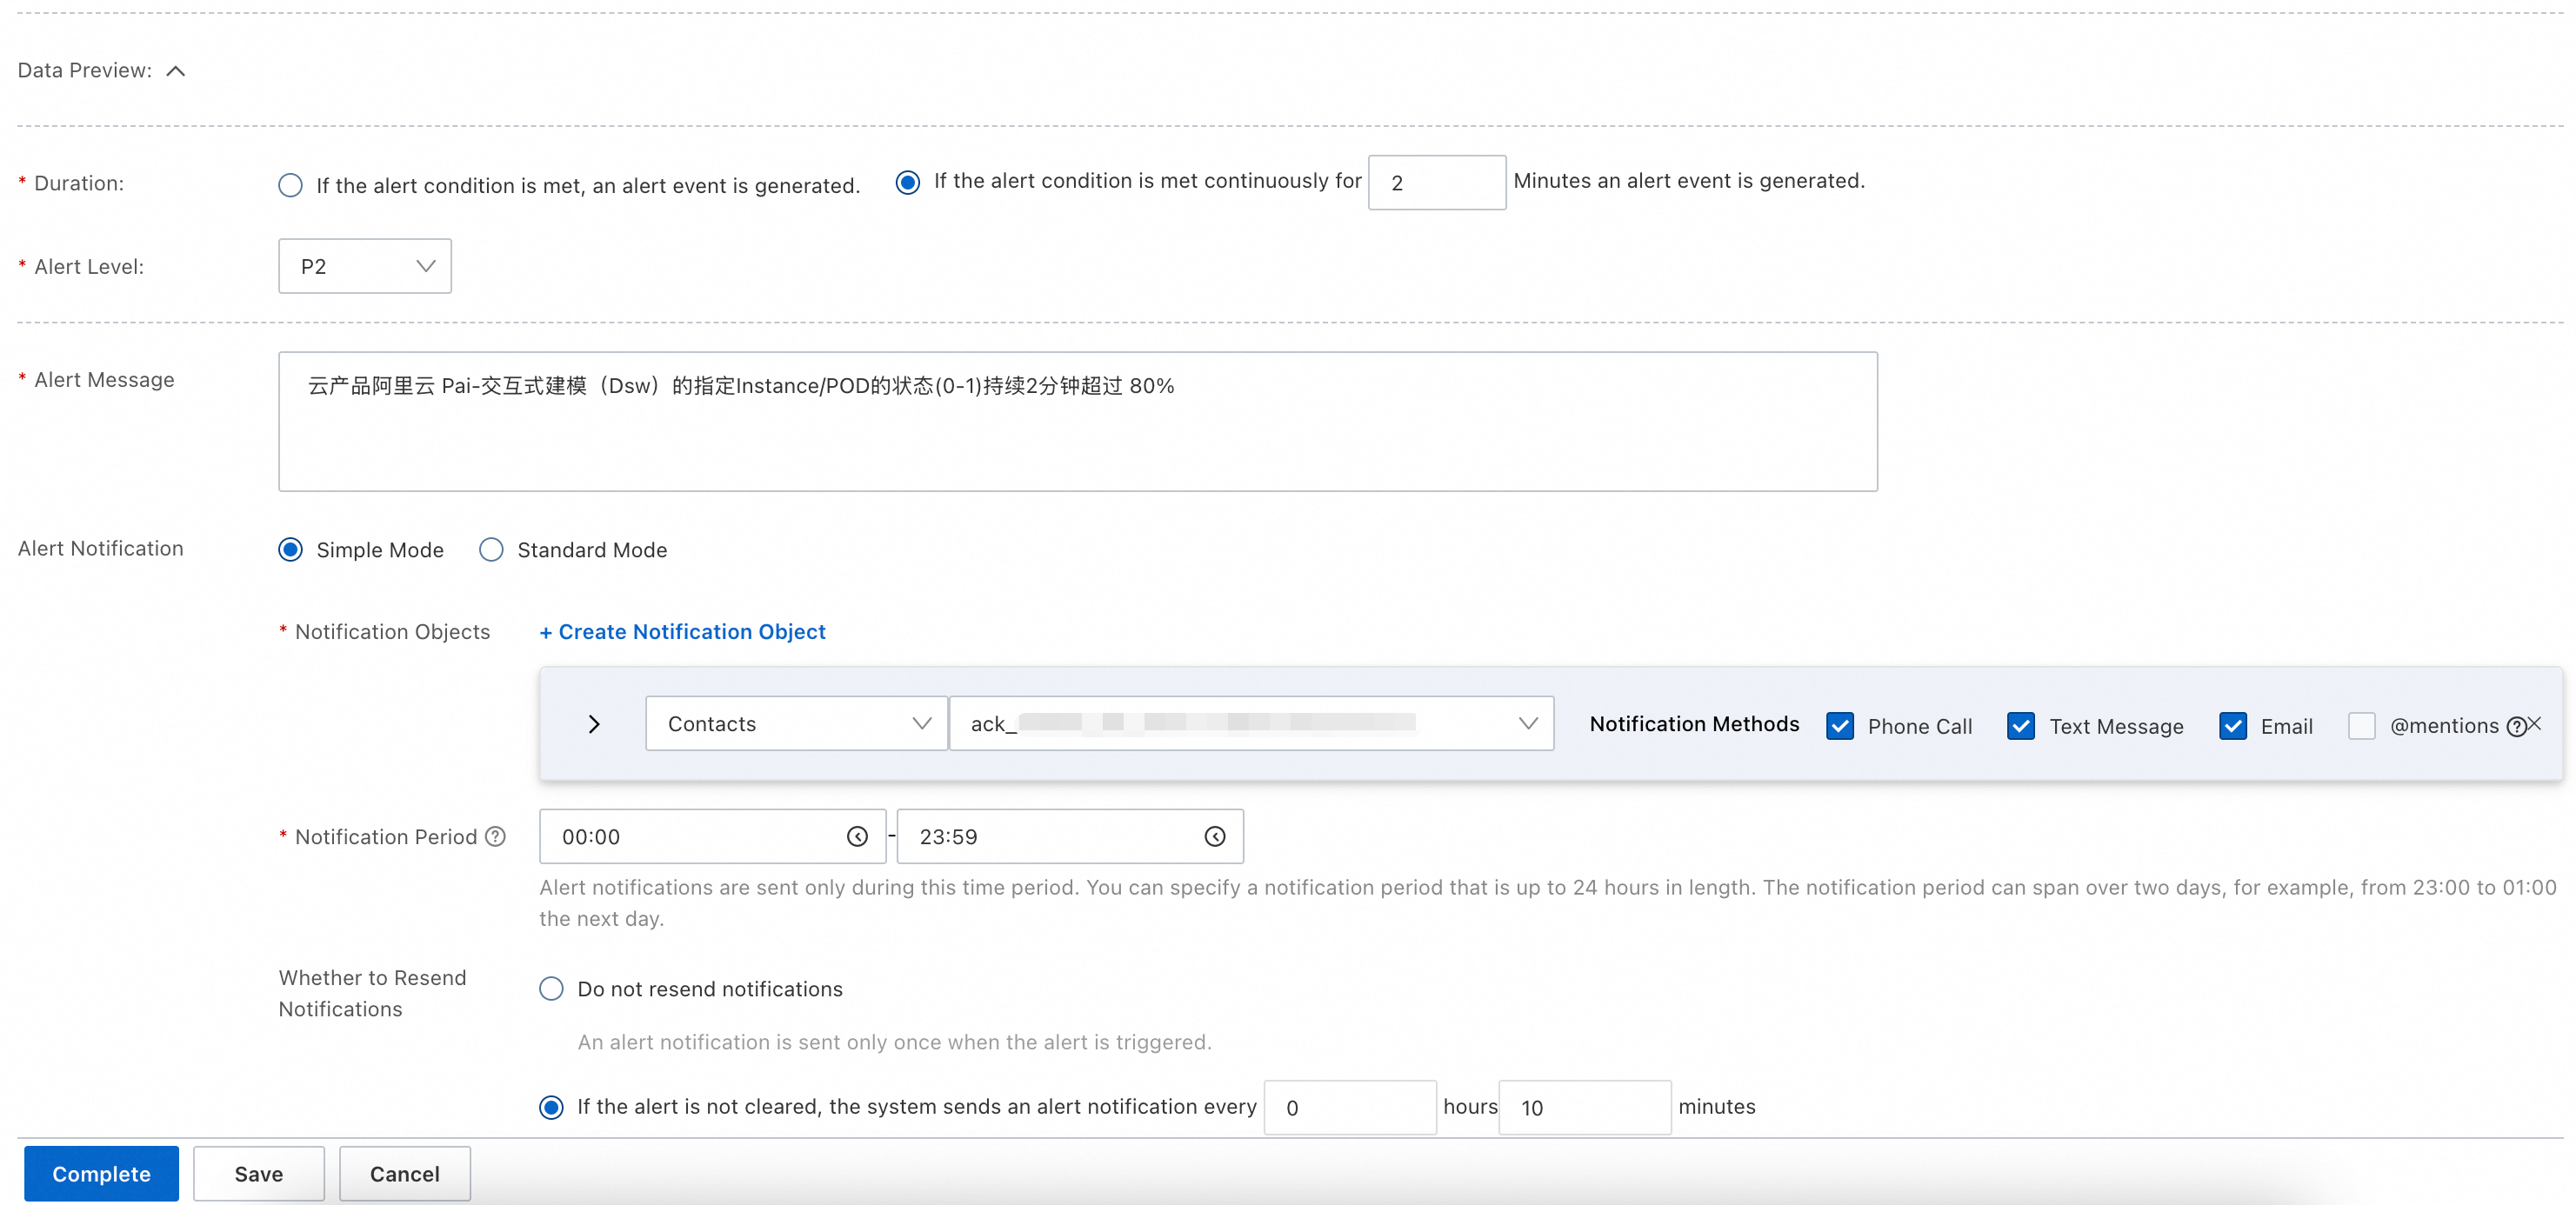
Configure notifications by editing an alert rule. In the Actions column of an alert rule, click Edit to open the Prometheus alert rule configuration page. Configure alert conditions, content, and notifications as needed. For more information about alert configuration, see Create a Prometheus alert rule.
Set up a notification policy to define matching rules for alert events. When an event matches a rule, the system sends an alert to the specified notification object using your chosen method. For more information, see Notification policies.