In Machine Learning Designer, you can use the preset logistic regression template to build a model to predict the examination results of students by considering various factors, such as family background and study behavior, and identify the primary factors that influence the learning outcomes of students. This topic describes how to use the preset logistic regression template.
Background information
After you obtain the prediction model that is described in this topic, you can import your data to a MaxCompute table to perform offline prediction.
Prerequisites
A workspace is created. For more information, see Create and manage a workspace.
MaxCompute resources are associated with the workspace. For more information, see Manage workspaces.
Dataset
In this example, the dataset contains 25 feature columns and one target column. The following table describes the columns.
Column | Type | Description |
sex | STRING | The gender of the student. Valid values: F and M. F indicates that the student is a female, and M indicates that the student is a male. |
address | STRING | The area of residence of the student. Valid values: U and R. U indicates that the student lives in the urban area. R indicates that the student lives in the rural area. |
famsize | STRING | The number of family members. Valid values: LE3 and GT3. LE3 indicates that the number of family members is less than or equal to three. GT3 indicates that the number of family members is greater than three. |
pstatus | STRING | Specifies whether the student lives with parents. Valid values: T and A. T indicates that the student lives with parents. A indicates that the student does not live with parents. |
medu | DOUBLE | The education level of the mother of the student. Valid values: 0 to 4. A greater value indicates a higher level of education. |
fedu | DOUBLE | The education level of the father of the student. Valid values: 0 to 4. A greater value indicates a higher level of education. |
mjob | STRING | The employment sector of the mother of the student. For example, the mother may work in the education, health, or services industry. |
fjob | STRING | The employment sector of the father of the student. For example, the father may work in the education, health, or services industry. |
guardian | STRING | The guardian of the student. Valid values: mother, father, and other. |
traveltime | DOUBLE | The travel time from home to school. Unit: minutes. |
studytime | DOUBLE | The study time per week. Unit: hours. |
failures | DOUBLE | The number of failed examinations. |
schoolsup | STRING | Specifies whether the student receives supplemental educational training. Valid values: yes and no. |
fumsup | STRING | Specifies whether the student has a tutor. Valid values: yes and no. |
paid | STRING | Specifies whether the student receives after-school tutoring for examinations. Valid values: yes and no. |
activities | STRING | Specifies whether the student is enrolled in extracurricular classes. Valid values: yes and no. |
higher | STRING | Specifies whether the student pursues higher education. Valid values: yes and no. |
internet | STRING | Specifies whether the student has access to the Internet at home. Valid values: yes and no. |
famrel | DOUBLE | The family relationship quality of the student. Valid values: 1 to 5. A greater value indicates a better family relationship. |
freetime | DOUBLE | The free time of the student after school. Valid values: 1 to 5. A greater value indicates more free time after school. |
goout | DOUBLE | The frequency of social activities with friends. Valid values: 1 to 5. A greater value indicates more frequent social interactions with friends. |
dalc | DOUBLE | The daily alcohol consumption of the student. Valid values: 1 to 5. A greater value indicates higher consumption. |
walc | DOUBLE | The weekly alcohol consumption of the student. Valid values: 1 to 5. A greater value indicates higher consumption. |
health | DOUBLE | The health status of the student. Valid values: 1 to 5. A greater value indicates a better health status. |
absences | DOUBLE | The attendance of the student. Valid values: 0 to 93. |
g3 | STRING | The examination result. The result is evaluated on a scale up to 20 points. |
The following figure shows the dataset that is used in this example. 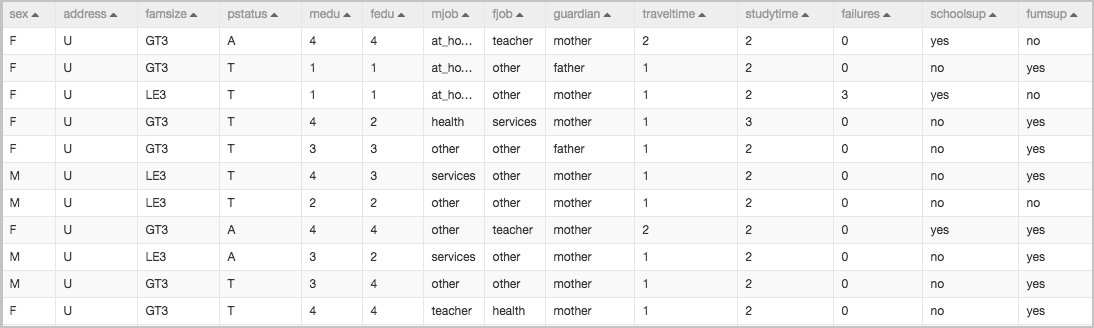
Procedure
Go to the Machine Learning Designer page.
Log on to the PAI console.
In the left-side navigation pane, click Workspaces. On the Workspaces page, click the name of the workspace that you want to manage.
In the left-side navigation pane, choose .
Create a pipeline.
On the Visualized Modeling (Designer) page, click the Preset Templates tab.
Find the Online Prediction - Student Examination Performance Prediction template and click Create.
In the Create Pipeline dialog box, configure the parameters. You can use their default values.
The value specified for the Data Storage parameter is the Object Storage Service (OSS) bucket path of the temporary data and models generated during the runtime of the pipeline.
Click OK.
It requires about 10 seconds to create the pipeline.
On the Pipelines tab, double-click Online Prediction - Student Examination Performance Prediction to open the pipeline.
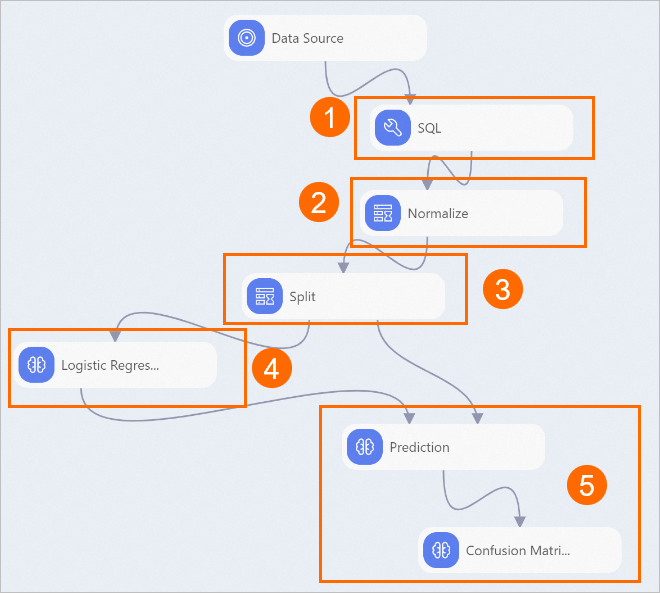
View the components of the pipeline on the canvas. The following figure shows the pipeline that is automatically created by using the preset template.
Component
Description
1
The SQL component structures text data from the input dataset based on the following rules:
Converts yes to 0 and no to 1.
Abstracts categorical text data based on business scenarios. For example, the component converts the value teacher of the mjob field to 1 and other values to 0. After abstraction, the mjob field indicates whether the mother works in the education industry.
Converts values that are greater than 18 to 1 and other values to 0 for the target column g3.
2
The Normalize component scales down the values of all fields to a range between 0 and 1 to offset the imbalance between field values.
3
The Split component follows an 8:2 ratio to split the input dataset into a training dataset and a prediction dataset.
4
The Logistic Regression component uses the logistic regression algorithm to generate an offline prediction model.
5
The Confusion Matrix component evaluates the accuracy of the model.
Run the pipeline and view the prediction results.
In the upper-left corner of the canvas, click the Run icon
 to run the pipeline.
 After the pipeline completes, right-click the Confusion Matrix component on the canvas and select Visual Analysis in the shortcut menu.
In the Confusion Matrix dialog box, click the Statistics tab. The results on the tab show that the prediction accuracy of the model is greater than 80%.
References
For more information about algorithm components, see the following topics: