Heart disease is a major health risk. By analyzing patient examination data, you can identify key risk factors and enable early prevention. This tutorial demonstrates how to create a heart disease prediction model using a data mining pipeline on real patient data.
Prerequisites
-
You have created a workspace. For more information, see Create and manage workspaces.
-
You have associated MaxCompute resources with your workspace. For more information, see Create and manage workspaces.
Data mining process
Heart disease prediction
-
Go to the Machine Learning Designer page.
-
Log on to the PAI console.
-
In the left-side navigation pane, click Workspaces. On the Workspaces page, click the name of the workspace that you want to manage.
-
In the left-side navigation pane, choose .
-
-
Create the pipeline.
-
On the Designer page, click the Preset Templates tab.
-
In the Heart Disease Prediction section of the template list, click Create.
-
In the Create Pipeline dialog box, configure the parameters. You can use the default settings.
The Data Storage parameter specifies an Object Storage Service (OSS) bucket path to store temporary data and models generated during the pipeline run.
-
Click Confirm.
Wait for about 10 seconds for the pipeline to be created.
-
In the pipeline list, select the heart disease prediction pipeline and click Open.
-
The system automatically builds the pipeline based on the preset template, as shown in the following figure.

Area
Description
①
Data preprocessing: This stage involves data cleaning, filling missing values, and transforming data types. Because each patient can be either sick or healthy, heart disease prediction is a binary classification problem. The input data for this pipeline includes 14 feature columns and 1 target column. For more information about the fields, see Appendix: Heart disease dataset. During data preprocessing, string values are converted to numeric types based on the meaning of each field. Examples:
-
二值类数据:以sex字段为例,其取值为female或male,可以使用0表示female,1表示male。
-
Multi-valued data: For example, the cp field represents chest pain, and the pain levels can be mapped to numerical values from 0 to 3 in increasing order of severity.
The following is a sample SQL script for data preprocessing.
select age,
(case sex when 'male' then 1 else 0 end) as sex,
(case cp when 'angina' then 0  when 'notang' then 1 else 2 end) as cp,
trestbps,
chol,
(case fbs when 'true' then 1 else 0 end) as fbs,
(case restecg when 'norm' then 0  when 'abn' then 1 else 2 end) as restecg,
thalach,
(case exang when 'true' then 1 else 0 end) as exang,
oldpeak,
(case slop when 'up' then 0  when 'flat' then 1 else 2 end) as slop,
ca,
(case thal when 'norm' then 0  when 'fix' then 1 else 2 end) as thal,
(case status  when 'sick' then 1 else 0 end) as ifHealth
from  ${t1};
②
Feature engineering: This stage involves deriving new features and scaling existing ones. This pipeline first uses the Type Transform component to convert input features to the DOUBLE type because the logistic regression model requires input data of the DOUBLE type. Then, the pipeline uses the Feature Select Runner component to determine the impact of each feature on the outcome, which is reflected by information entropy and the Gini index. The pipeline also uses the Normalize component to scale each feature to a 0-to-1 range. This process, known as normalization, eliminates the impact of different units and scales on the result. The formula is
result=(val-min)/(max-min).③
Model training and prediction:
-
Use the Split component to divide the dataset into a training set and a prediction set at a 7:3 ratio.
-
Use the Logistic Regression component to train the model.
NoteIf you want to export a PMML model file, on the Field Setting tab of this component, select the Whether To Generate PMML checkbox. Then, click a blank area of the canvas and configure the data storage path on the Pipeline Attributes tab.
-
Pass the trained model and the prediction set to the Predicted component to generate predictions.
④
Use the Confusion Matrix and Evaluate components for model evaluation.
-
-
-
Run the pipeline and view the results.
-
Click
 at the top of the canvas.
 -
After the pipeline finishes running, right-click the Logistic Regression component on the canvas and choose to export the trained heart disease prediction model.
-
Right-click the Predicted component on the canvas and choose to view the prediction results.
-
-
Evaluate the model performance.
-
Right-click the Evaluate component on the canvas and click Visual Analysis.
-
In the Evaluate dialog box, click the Indicator Data tab to view the model evaluation metrics.
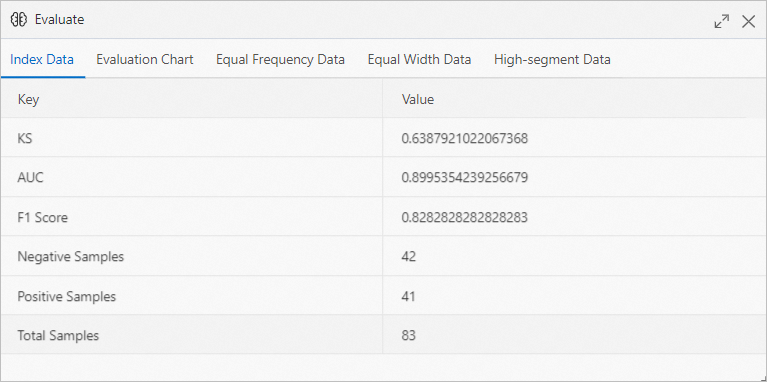 The AUC value for this model exceeds 0.9, which indicates excellent predictive performance.
 -
Right-click the Confusion Matrix component on the canvas and click Visual Analysis.
-
In the Confusion Matrix dialog box, click the Summary tab to view information such as the model accuracy.
-
Appendix: Heart disease dataset
This pipeline uses an open-source dataset from the UCI Machine Learning Repository. It contains physical examination records of 303 patients from a region in the United States. The following table describes the fields.
|
Parameter |
Type |
Description |
|
age |
STRING |
Age of the patient. |
|
sex |
STRING |
Gender of the patient. Valid values: female and male. |
|
cp |
STRING |
The types of chest pain, in descending order of severity, are typical, atypical, non-anginal, and asymptomatic. |
|
trestbps |
STRING |
Resting blood pressure. |
|
chol |
STRING |
Cholesterol. |
|
fbs |
STRING |
Fasting blood glucose. If the blood glucose level is greater than 120 mg/dL, the value is true. Otherwise, the value is false. |
|
restecg |
STRING |
The possible results for the T wave of an electrocardiogram, from mild to severe, are norm and hyp. |
|
thalach |
STRING |
Maximum heart rate achieved. |
|
exang |
STRING |
Indicates whether the user has angina. true indicates the presence of angina, and false indicates the absence of angina. |
|
oldpeak |
STRING |
ST depression induced by exercise relative to rest. |
|
slop |
STRING |
The slope of the ST segment of an electrocardiogram (ECG). Valid values include down, flat, and up. |
|
ca |
STRING |
Number of major vessels colored by fluoroscopy. |
|
thal |
STRING |
The occurrence types, in ascending order of severity, are norm, fix, and rev. |
|
status |
STRING |
Indicates the health status. buff means healthy, and sick means sick. |
Pipelines created from the template include this dataset. To download the dataset or learn more, see Heart Disease Data Set.
Next steps
Once the pipeline runs successfully, you can deploy the model as an online service for inference. For more information about deployment, see Deploy a model as an online service and PMML.