After you report application data to Managed Service for OpenTelemetry, the Provided Services tab shows every operation your application exposes -- API calls, message queue consumers, scheduled tasks, and internal methods. Use this tab to monitor request volume, error rates, and response time (the RED metrics: Rate, Errors, Duration) across all operations, then drill into any operation for SQL analysis, dependency mapping, and trace-level diagnostics.
Prerequisites
Before you begin, make sure that you have:
An application whose data is reported to Managed Service for OpenTelemetry. For setup instructions, see Connection description
View provided services
Log on to the Managed Service for OpenTelemetry console. In the left-side navigation pane, click Applications.
On the Applications page, select a region in the top navigation bar and click the name of the application.
Click the Provided Services tab.
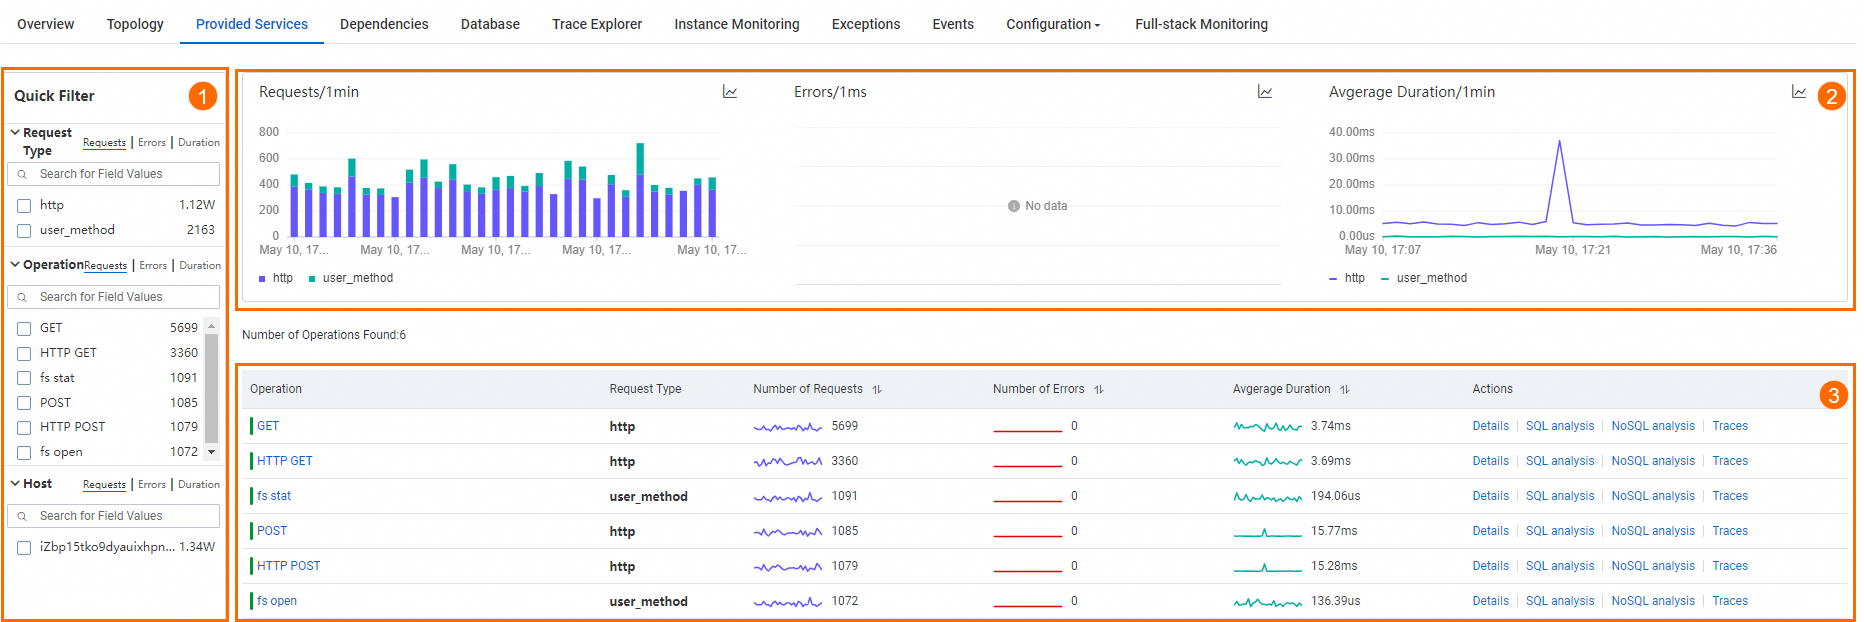
The Provided Services tab has three sections: quick filters, trend charts, and the service list.
Quick filters
The filter bar at the top (area 1 in the preceding figure) narrows both the trend charts and the service list. Filter by any combination of:
request type -- The protocol or framework (for example, HTTP, gRPC, or Dubbo). See Request types for the full list.
operation -- A specific API endpoint or method name.
host -- The server instance handling requests.
Trend charts
The middle section (area 2) displays time series curves for three RED metrics:
| Metric | What it tells you |
|---|---|
| Request count | Traffic volume over time (Rate) |
| Error count | Failure volume over time (Errors) |
| Average response time | Latency trend over time (Duration) |
Tracking these three metrics together helps you spot anomalies quickly. For example, a spike in errors alongside rising response time often signals a downstream dependency issue.
Compare metrics across dates
Click the  icon to compare metric data from different dates within the same time window. This is useful for detecting regressions -- for example, comparing today's error rate with the same period last week to determine whether a recent deployment introduced new failures.
Switch chart type
Click the  icon to switch between a trend chart and a column chart view.
Service list
The table at the bottom (area 3) lists every operation detected for the application:
| Column | Description |
|---|---|
| Operation name | The endpoint, method, or consumer identifier |
| Request type | The protocol or framework category |
| Requests | Total request count in the selected time range |
| Errors | Total error count in the selected time range |
| Average response time | Mean response time per request |
Available actions
| Action | How to access | Result |
|---|---|---|
| View operation details | Click an operation name | Opens the operation details page with metrics, SQL analysis, dependencies, and traces |
| View operation summary | Click Details in the Actions column | Opens a summary panel with request count, error count, and average response time |
| View traces | Click Traces in the Actions column | Opens Trace Explorer filtered to that operation |
Operation details
Click an operation name in the service list to open its detail page. The detail page provides the following tabs, each focused on a different dimension of the operation's behavior.
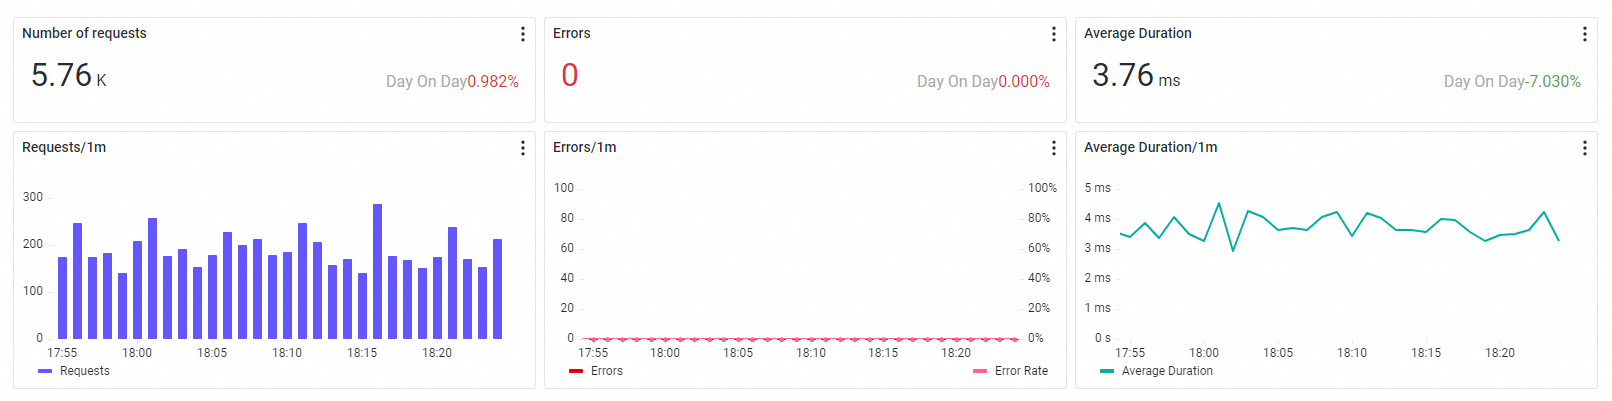
Metrics and time series
The Overview tab shows the same three RED metrics -- request count, error count, and average response time -- scoped to the selected operation, along with time series curves.
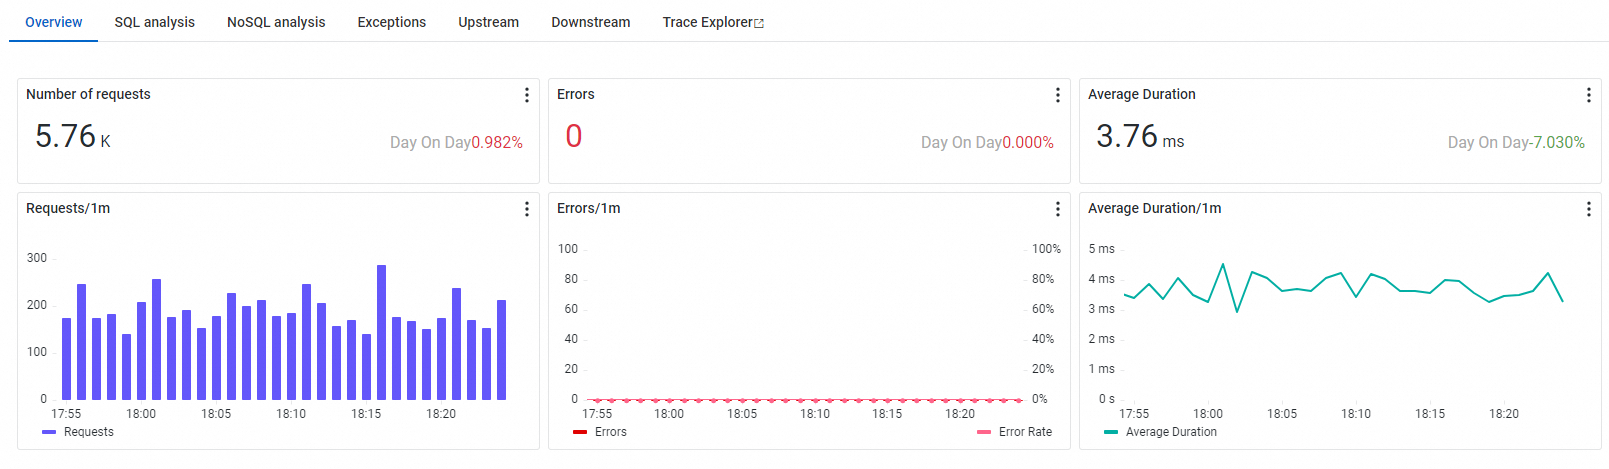
Use this tab to assess the health of a single operation. For example, if the service list shows a high error count for an operation, open its overview to check whether errors are sustained or intermittent.
SQL and NoSQL analysis
The SQL analysis and NoSQL analysis tabs list all database queries initiated by the selected operation. Filter queries by host to isolate traffic to a specific database instance.
Upstream and downstream services
The Upstream and Downstream tabs show which operations call this operation (upstream) and which operations this operation depends on (downstream). Each dependency row includes request count, error count, and response time.
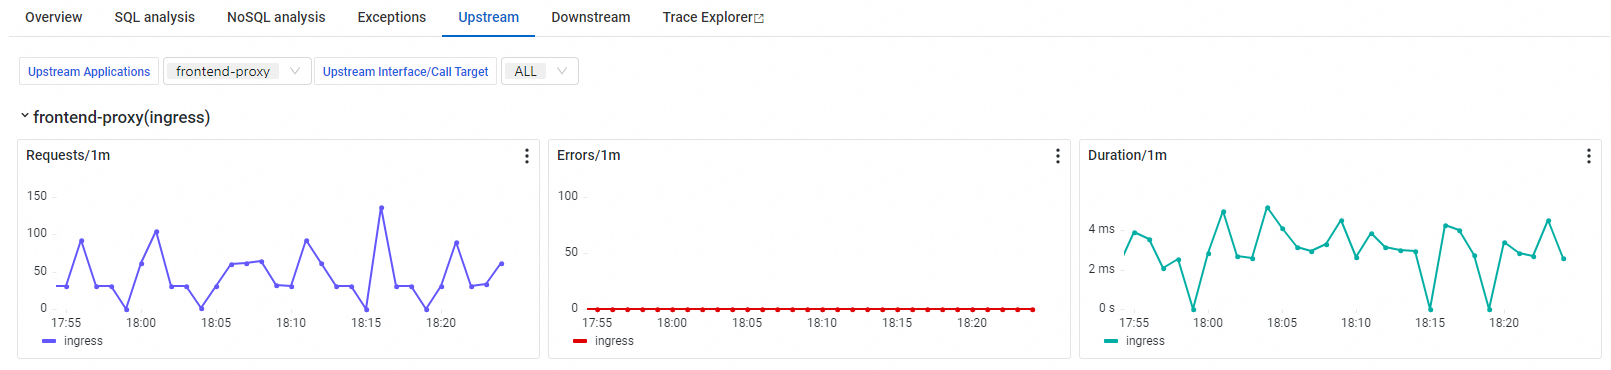
Use these tabs to identify which dependency contributes the most to overall response time. A downstream service with a high response time often explains elevated latency at the current operation level.
Trace analysis
Trace Explorer combines filter conditions and aggregation dimensions to support real-time trace analysis. Use it for custom diagnostics across different troubleshooting scenarios. For detailed usage, see Trace Explorer.

Request types
Each operation is classified by request type. The following tables list all supported types.
Server requests
| Type | Description |
|---|---|
| HTTP | HTTP request |
| Dubbo | Dubbo Remote Procedure Call (RPC) request |
| HSF | High-Speed Service Framework (HSF) RPC request |
| DSF | Distributed Service Framework (DSF) RPC request |
| gRPC | gRPC request |
| Thrift | Thrift RPC request |
| Sofa | SOFARPC request |
| Server | Common server-side request |
Message consumers
| Type | Description |
|---|---|
| kafka | Kafka message queue consumer |
| Consumer | Common message consumer |
Scheduled tasks
| Type | Description |
|---|---|
| SchedulerX | Scheduled task run through SchedulerX |
| Spring_Scheduled | Scheduled task using the @Scheduled annotation in Spring |
| JDK_Timer | Scheduled task using a Java Development Kit (JDK) timer |
| XXL_Job | Scheduled task run through XXL-JOB |
| Quartz | Scheduled task run through Quartz Scheduler |
Internal and common methods
| Type | Span type | Description |
|---|---|---|
| user_method | internal | An application-internal method call |
| Span | unknown | A generic method call with no specific classification |
What's next
Create alert rules for specific operations or all operations to get notified when error rates or response times exceed your thresholds. See Create an alert rule.