When applications produce a high volume of errors, pinpointing which exceptions need immediate attention is difficult. The exception analysis feature of Application Real-Time Monitoring Service (ARMS) helps you recognize and diagnose system exceptions or data errors, surfaces frequency trends, and provides stack-level detail. This helps you prioritize and resolve the issues that affect your system most.
With exception analysis, you can:
Filter exceptions by name, operation, application, or instance to isolate root causes.
Visualize exception frequency through stacked trend charts and compare data across time periods.
Drill into individual exceptions to inspect stack traces and distribution across operations and instances.
Open the exception analysis page
Log on to the Managed Service for OpenTelemetry console.
In the left-side navigation pane, choose .
In the upper-right corner of the page, select a time range for analysis.
The page contains three sections:

| Section | Description |
|---|---|
| Quick Filter (area 1) | Filter controls for exception name, operation name, application name, and instance. Narrow the data displayed in the trend chart and exception list. |
| Trend chart (area 2) | A stacked bar chart showing exception counts over the selected time range. Each color segment represents a different exception name, so you can spot spikes for specific error types at a glance. |
| Exception list (area 3) | A table listing each exception with its name, source application, occurrence count, percentage of total exceptions, and a summary. |
Filter exceptions
In the Quick Filter section, select one or more filters to refine the displayed data:
| Filter | Description |
|---|---|
| Exception name | Filter by exception class or error type. |
| Operation name | Filter by the specific operation that triggered the exception. |
| Application name | Scope results to a specific application. |
| Instance | Scope results to a specific application instance. |
Analyze exception trends
The trend chart displays exception counts as a stacked bar chart over the selected time range. Each bar is segmented by exception name, helping you identify:
Which exceptions occur most frequently.
When spikes or new exception types appear.
How exception volume changes over time.
To compare data across time periods or switch chart types:
Click the
 icon above the chart.
In the dialog box that appears, view metric data for a specific period, or compare data during the same time window across different dates.
Switch between chart types by using the toolbar icons:
Icon Chart type 
Column chart 
Trend line chart
Investigate specific exceptions
The exception list provides three ways to investigate a specific exception.
View application monitoring details
Click the application name in the exception list to view the monitoring details.
For more information, see View monitoring details (new).
View the exception overview
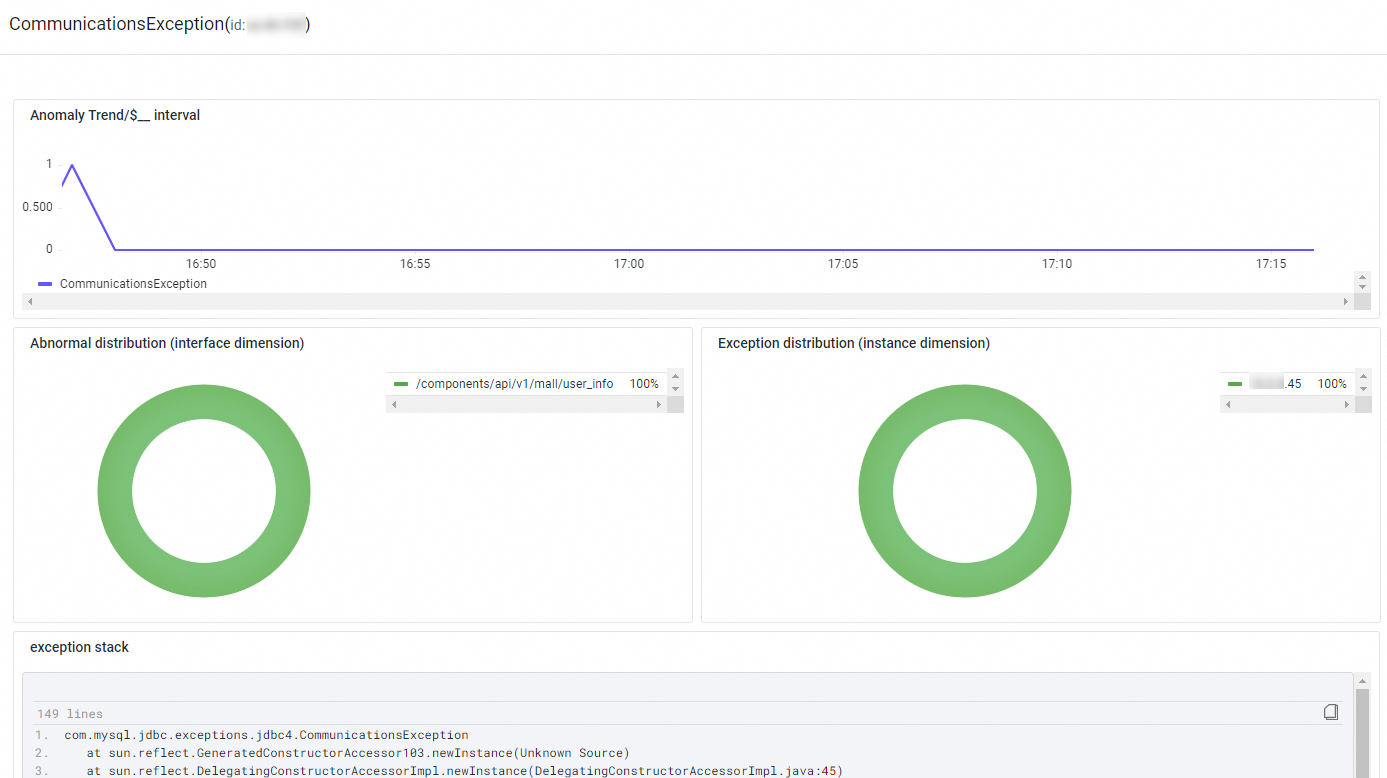
Click Overview in the Actions column to open a detailed breakdown of the selected exception:
| Panel | Description |
|---|---|
| Exception count trend | A time-series chart showing how often this exception occurs over the selected period. |
| Distribution by operation | Which operation calls trigger this exception, and how frequently. |
| Distribution by instance | Which application instances report this exception. |
| Exception stack | The full stack trace for the selected exception. |
View related traces
Click Traces in the Actions column to view the trace information.
For more information, see Trace Explorer.