Trace Explorer queries, filters, and analyzes stored trace data in real time. Combine filter conditions with aggregation dimensions to diagnose performance bottlenecks, identify error patterns, and pinpoint root causes across distributed services.
Typical troubleshooting workflow:
Open Trace Explorer in the Managed Service for OpenTelemetry console.
Filter traces by status, duration, or service name to isolate the problem.
Open the trace details to identify which span caused the latency or error.
Run slow or failed trace analysis to surface the dimensions most correlated with the issue.
Prerequisites
Before you begin, make sure that:
Application data is reported to Managed Service for OpenTelemetry. For setup instructions, see Integration guide
Query traces
Open Trace Explorer
Log on to the Managed Service for OpenTelemetry console.
In the left-side navigation pane, click Trace Explorer.
In the top navigation bar, select a region.
In the upper-right corner, select a time range.
Filter traces
Use any combination of the following methods to narrow down trace results:
Quick Filter: Filter traces by status, duration, application name, span name, or host address in the Quick Filter section. Selected conditions appear in the search bar.
Drop-down filter panel: Click the search bar to open the drop-down filter panel. Modify existing conditions or add custom filters.
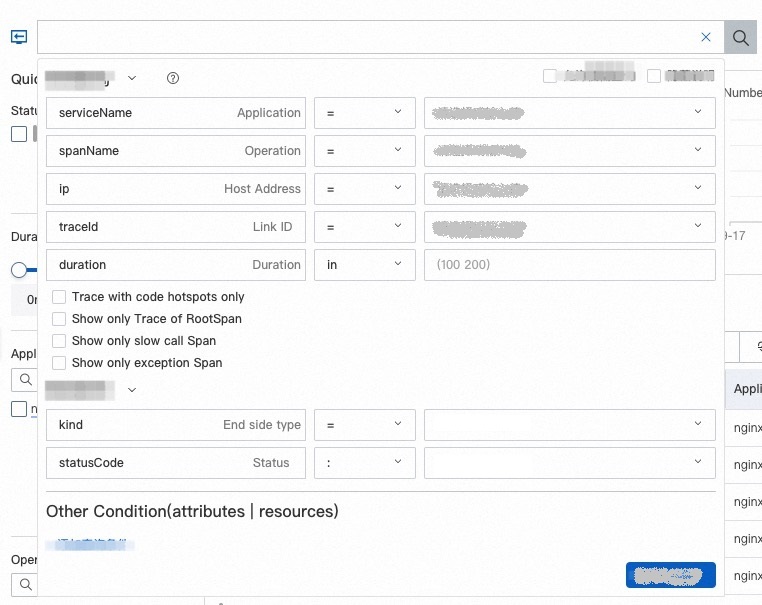
Query statement: Enter a query statement directly in the search bar. For syntax details, see Usage methods of Trace Explorer.
 icon next to the Aggregation Dimension drop-down list to save your current filter conditions as a view. Click Saved View to access all saved views, or click a specific view to load its filter conditions.
Aggregate results
After filtering, aggregate the queried data by specific dimensions to identify patterns. Select an aggregation dimension from the drop-down list to group trace results.
Trace list
After you apply filter conditions, the Trace Explorer page displays:
Column charts of call counts and HTTP errors
A time series curve of duration
A trace list
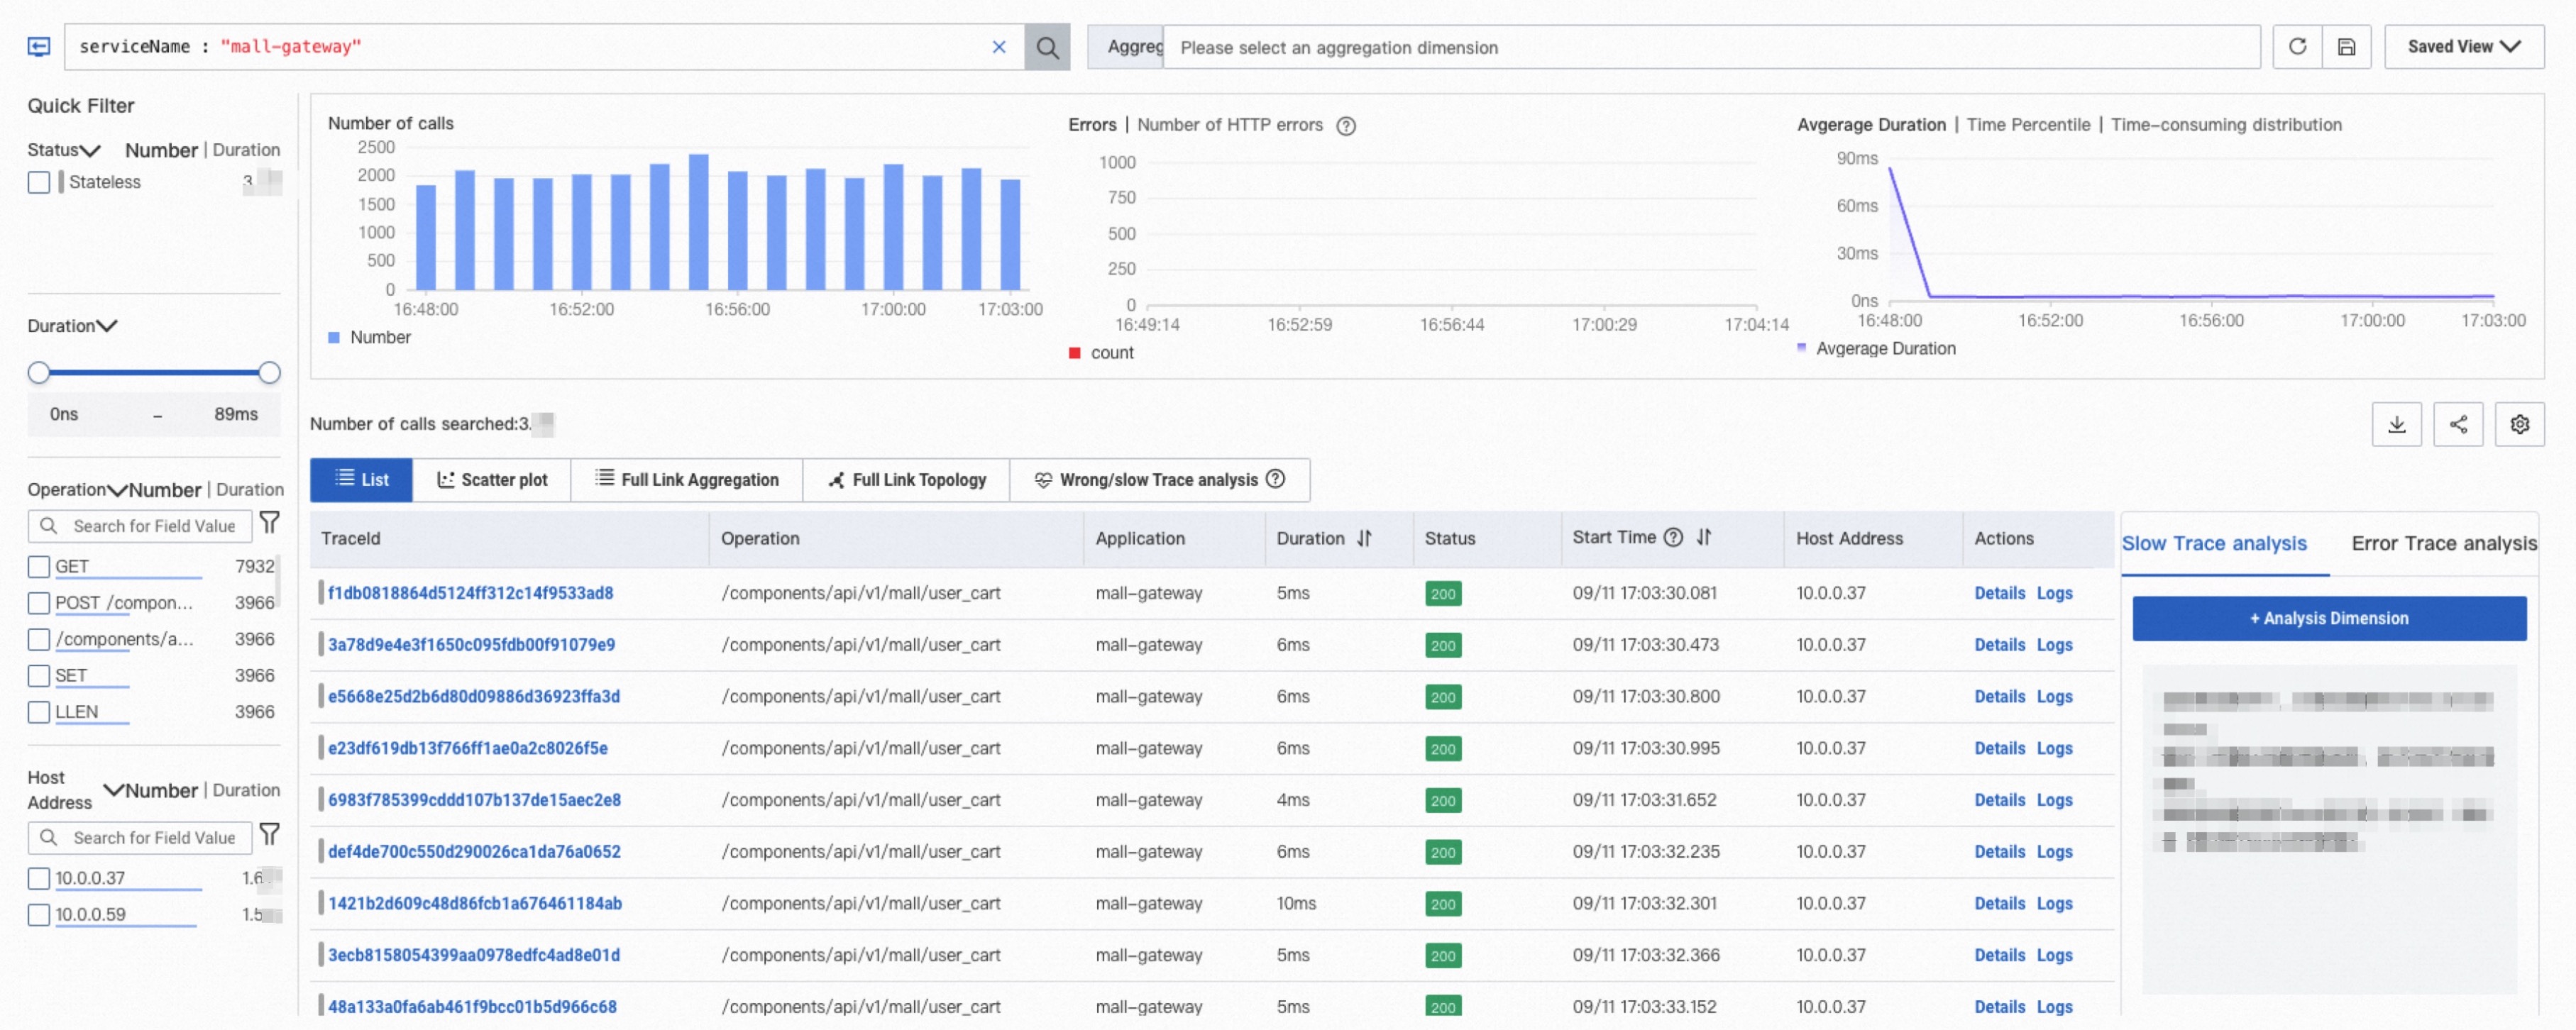
In the trace list:
Click a trace ID or Details in the Actions column to open the trace details and topology. See Trace details.
Click Logs in the Actions column to view trace logs. See Use the log analysis feature.
Click the
 icon in the upper-right corner to show or hide columns.
Hover over a span value and click the
 icon to add that value as a filter condition.
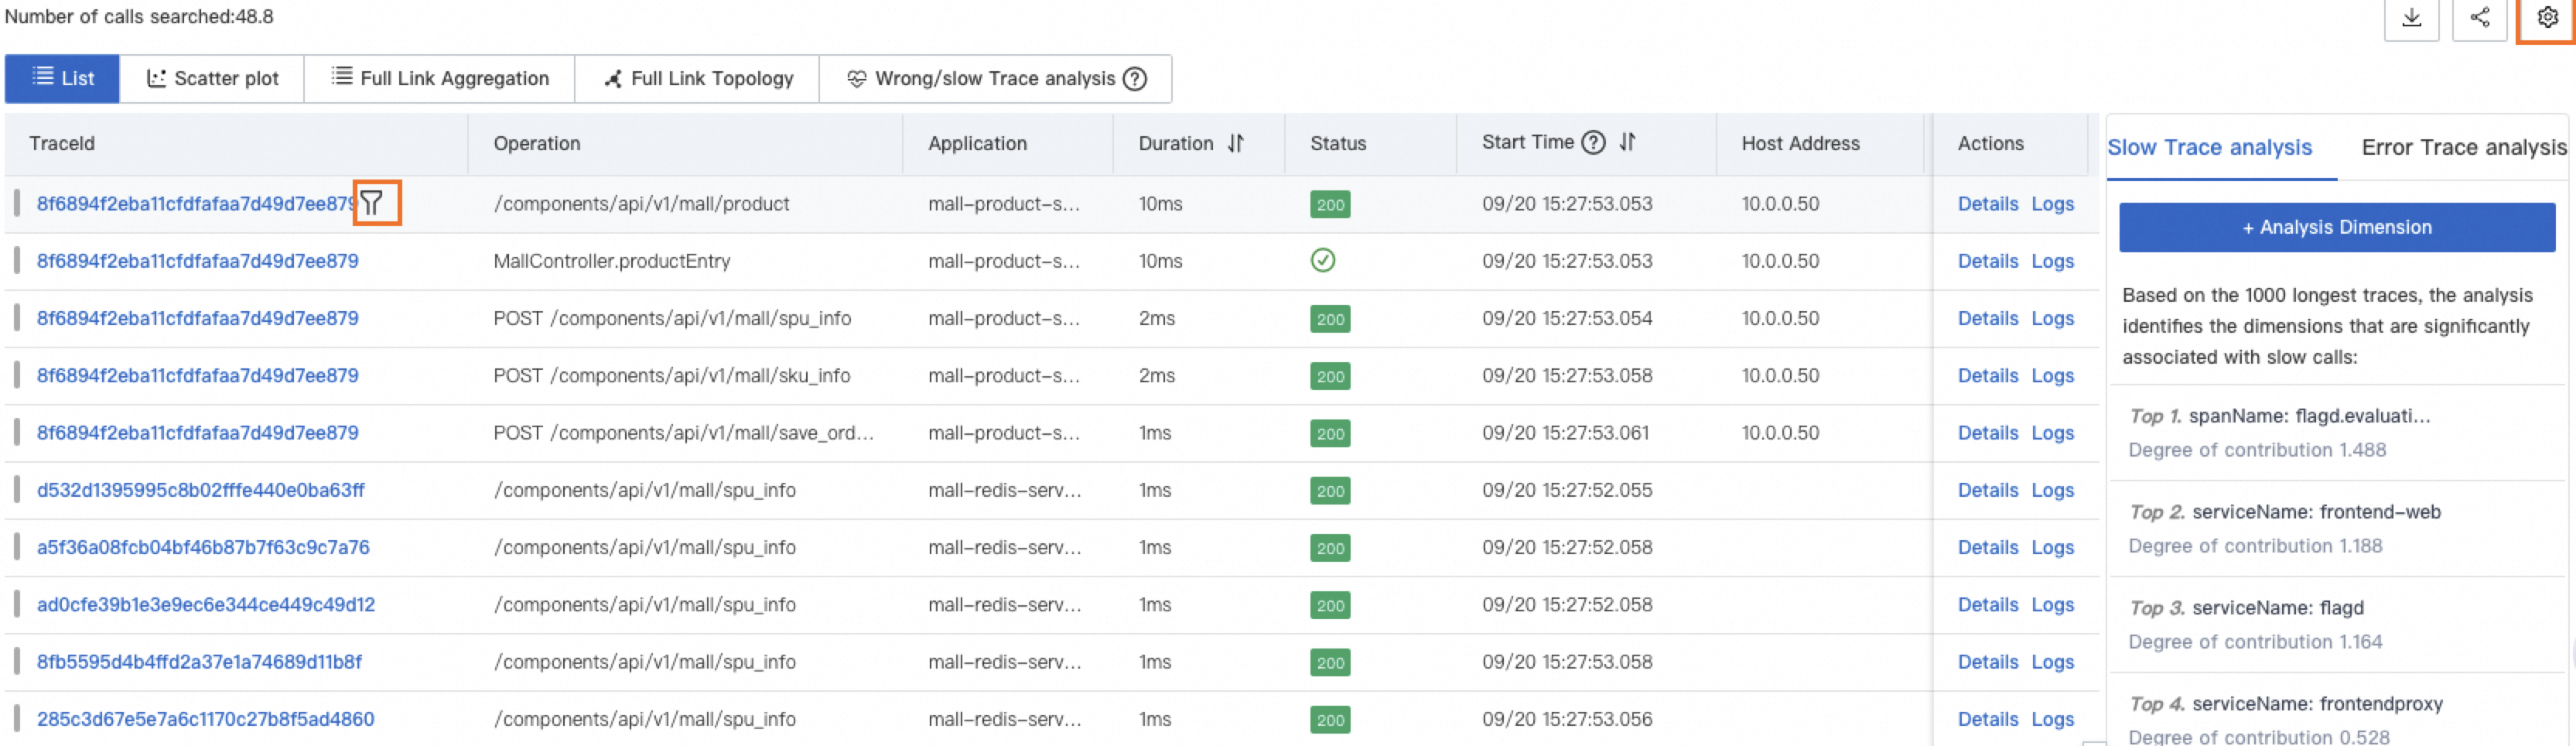
Scatter plot
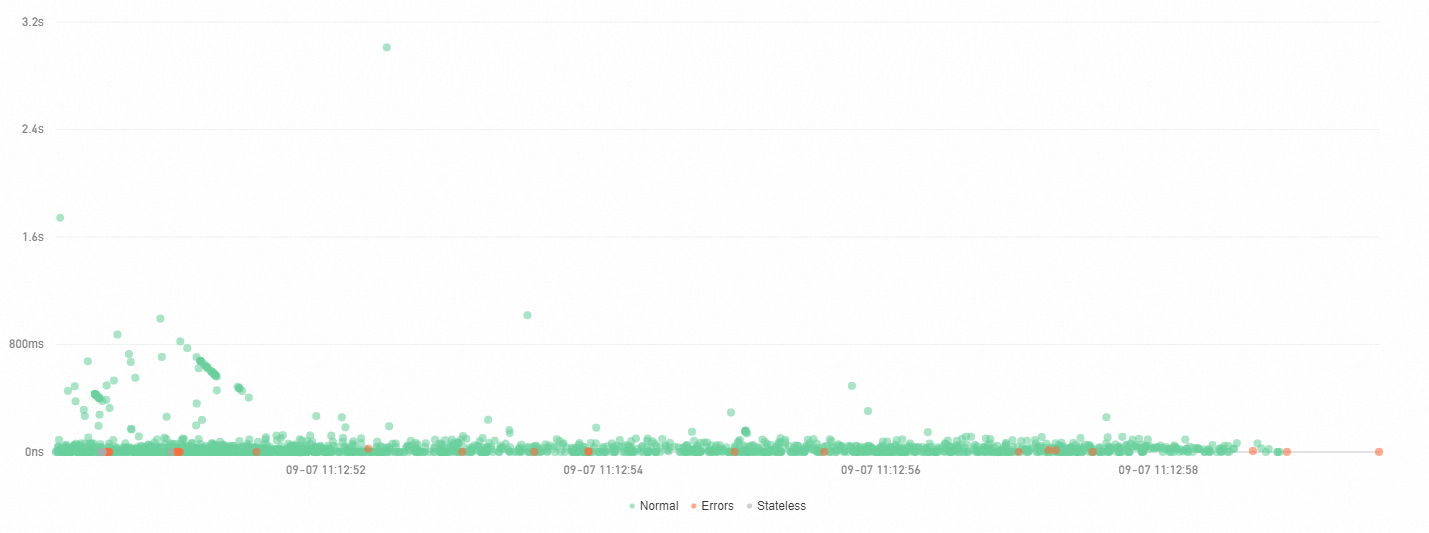
Use the scatter plot to spot outlier traces -- requests with unusually high latency that may indicate performance problems.
On the Scatter plot tab, the X axis represents time and the Y axis represents duration. Each point is one trace. Hover over a point to view basic trace information, or click it to open the trace details. See Trace details.
Trace aggregation
Trace aggregation breaks down filtered traces at the span level, showing how each span contributes to overall request performance.
While standard filtering analyzes individual spans, trace aggregation queries up to 5,000 distributed traces by the specified conditions, retrieves all spans by trace ID, and aggregates them. This preserves trace integrity and provides a complete picture of span-level behavior across requests.
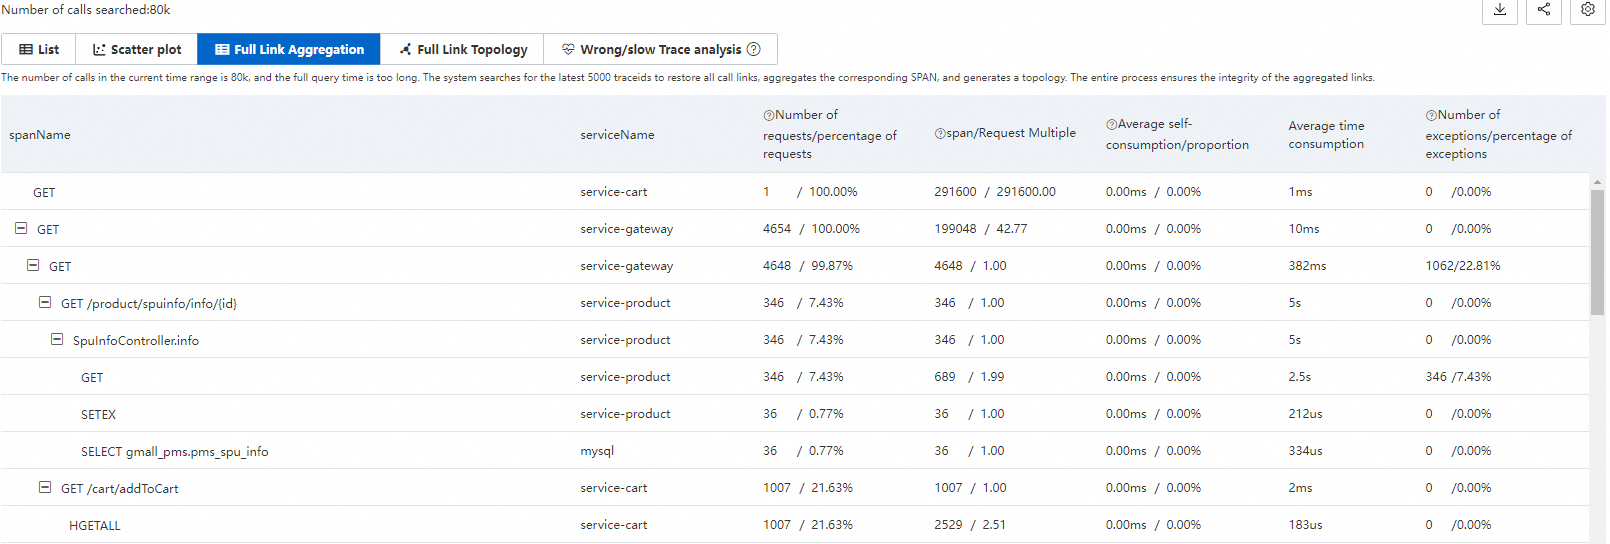
Aggregation metrics
Metric | Description |
spanName | The span name. |
serviceName | The service that generated the span. |
Requests / request ratio | The number and percentage of requests that call this span. Formula: Requests calling this span / Total requests x 100%. |
Spans / request multiple | The average number of times each request calls this span. Formula: Total span count / Request count. For example, 2.0 means each request calls this span twice on average. |
Average self-time / proportion | The average time spent in this span alone, excluding child spans. Formula: Total span duration - Duration of all child spans. For asynchronous calls, self-time equals the total span duration. |
Average duration | The average total duration of this span. |
Exceptions / exception ratio | The number and percentage of requests that encounter exceptions in this span. Formula: Requests with exceptions / Total requests x 100%. A single request may have multiple exceptions if the request multiple is greater than 1. |
Worked example
Consider a trace where Span A calls Span B and Span C:
spanName | serviceName | Requests / request ratio | Spans / request multiple | Average self-time / proportion | Average duration | Exceptions / exception ratio |
A | demo | 10 / 100.00% | 10 / 1.00 | 5.00 ms / 25.00% | 20 ms | 2 / 20.00% |
- B | demo | 4 / 40.00% | 8 / 2.00 | 16.00 ms / 100.00% | 16 ms | 2 / 50.00% |
- C | demo | 1 / 10.00% | 1 / 1.00 | 4.00 ms / 100.00% | 4 ms | 1 / 100.00% |
How to read this data:
Request distribution: Of the 10 total requests, all 10 call Span A (100%), only 4 call Span B (40%), and only 1 calls Span C (10%). The remaining requests skip Span B and Span C due to conditional logic or exceptions.
Span frequency: Span A is called once per request (multiple = 1.00). Span B has 8 total spans across 4 requests, so each request calls Span B twice on average (multiple = 2.00).
Self-time breakdown: Span A's average self-time is 5.00 ms, which is 25% of its 20 ms total duration. The remaining 75% is spent in child spans (B and C). Span B and Span C have 100% self-time because they have no child spans.
Exception distribution: Span A has 2 exceptions across 10 requests (20%). Span B has 2 exceptions across 4 requests (50%). Because Span B's request multiple is 2.0, the likely pattern is: 2 of the 4 requests had an exception on the first call to Span B, while the second call succeeded.
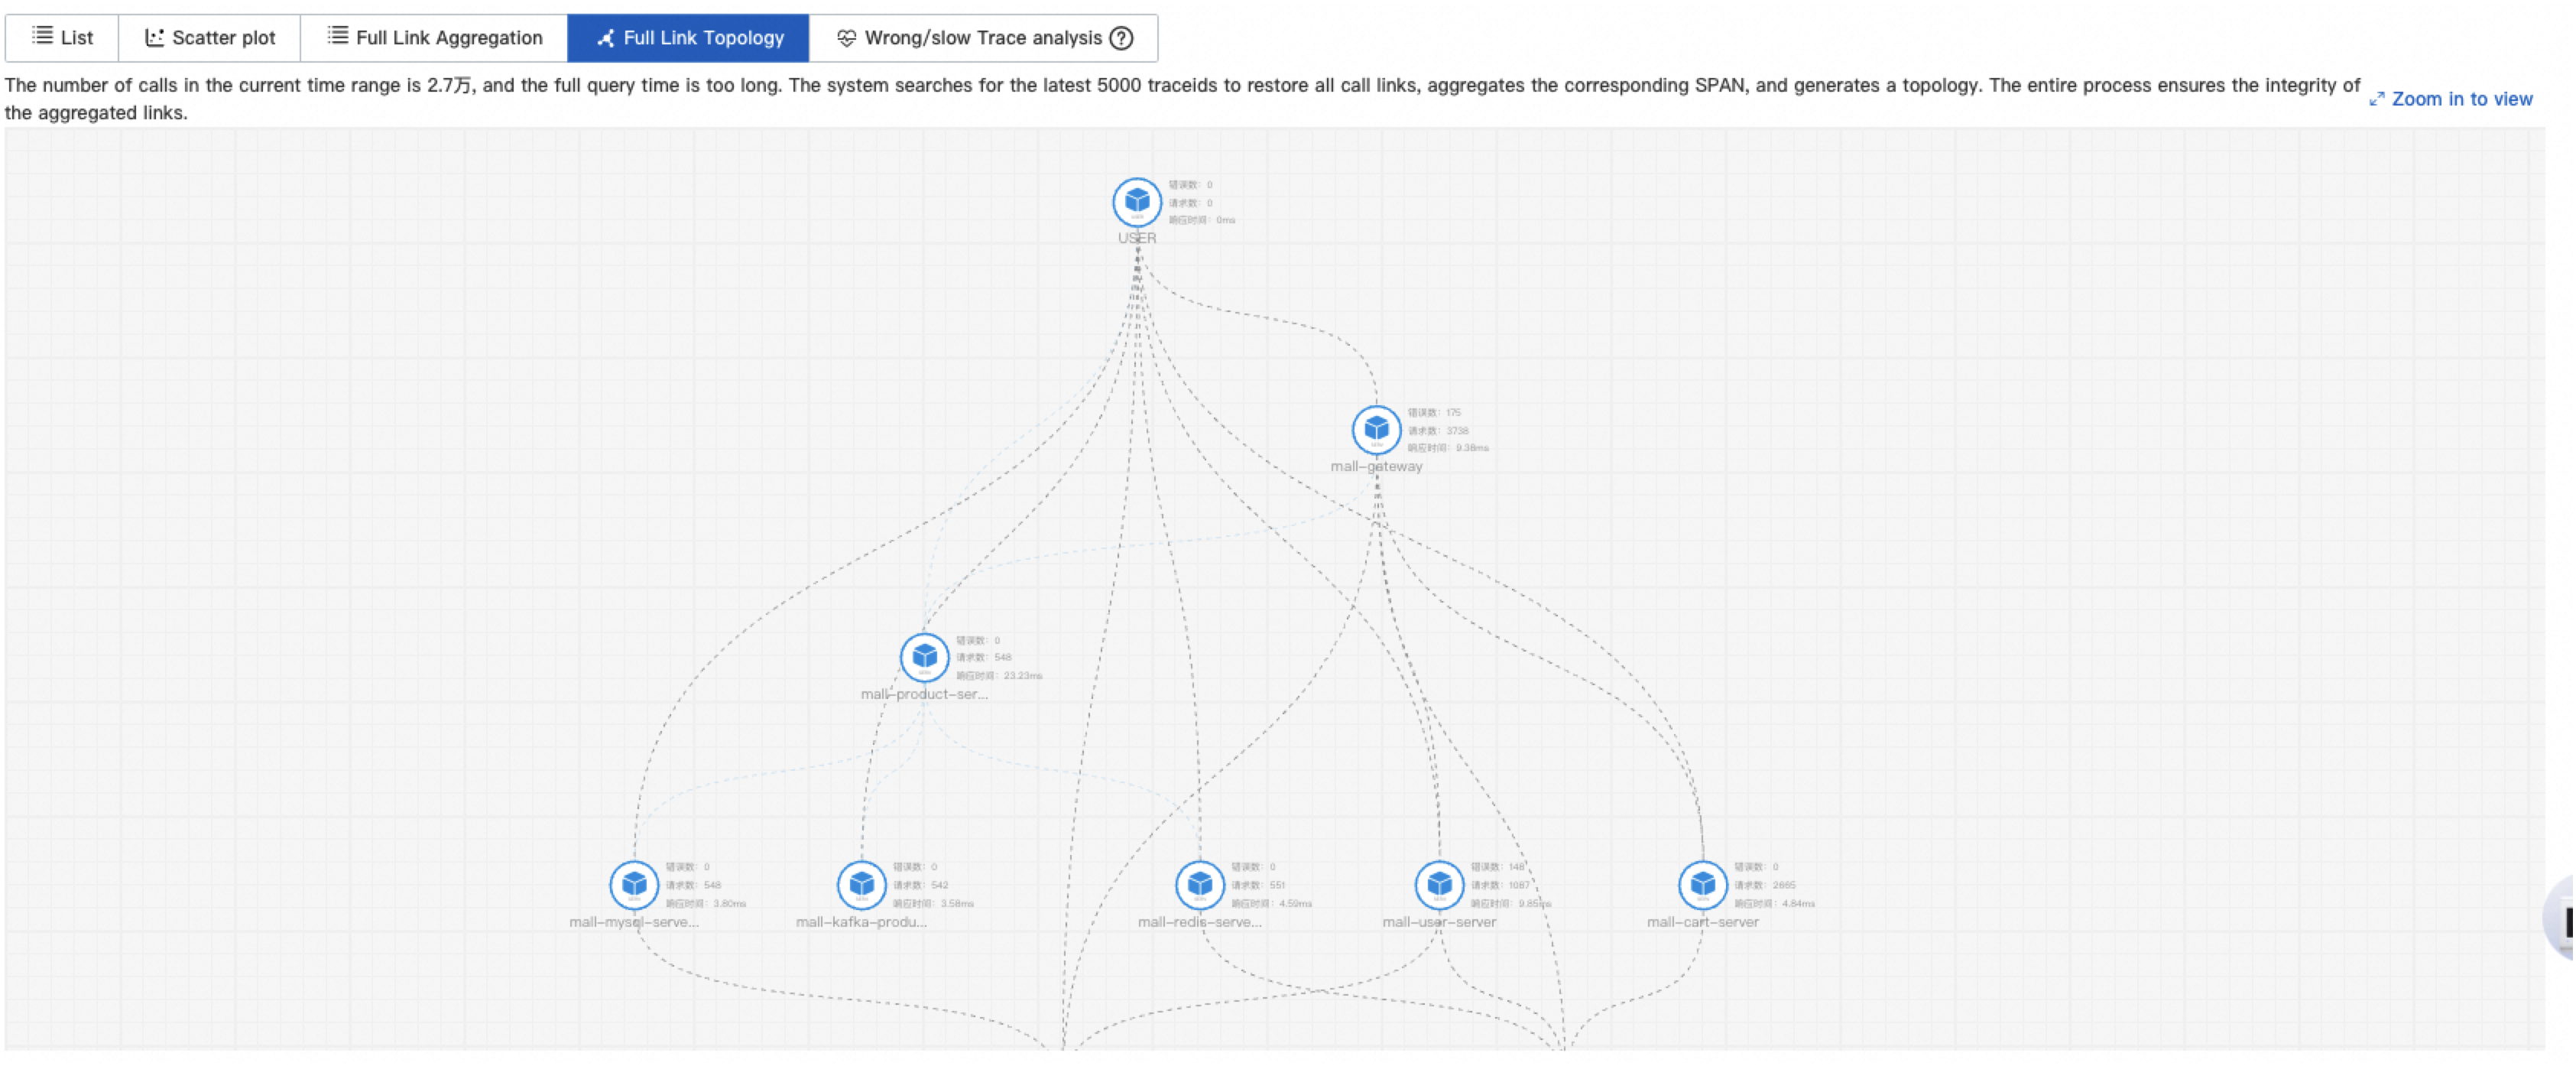
Trace topology
Use the trace topology to visualize service dependencies and identify error paths or bottleneck services in your request flow.
The Full Link Topology tab displays the inter-application topology of aggregated traces. Each node represents an application and shows the request count, error count, and response time.
Slow and failed trace analysis
Trace Explorer automatically analyzes slow and failed traces to surface the dimensions most correlated with performance issues or errors. Quickly identify whether problems are concentrated on a specific host, interface, or service, and target your investigation accordingly.
Combine filter conditions to narrow results further. For example: serviceName="arms-demo" AND ip="192.168.1.1".
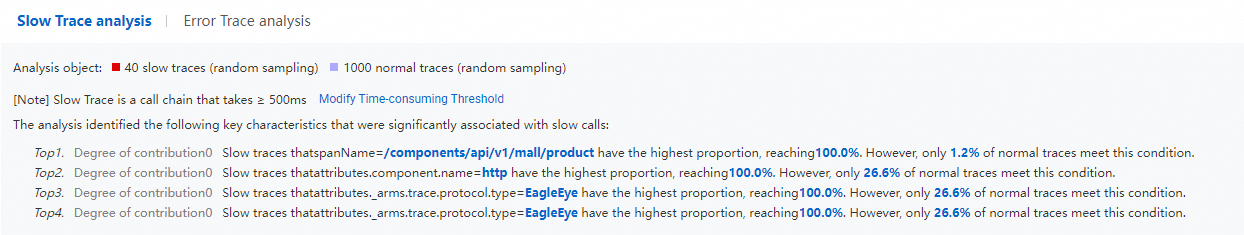
Slow trace analysis
Application Real-Time Monitoring Service (ARMS) analyzes the 1,000 traces with the longest duration and displays the five dimensions most correlated with high latency.

Slow trace details
To find characteristics unique to slow traces, ARMS selects the 1,000 longest traces above the threshold, samples 1,000 traces below the threshold as a baseline, compares the two groups, and surfaces the three characteristics most correlated with slow calls.
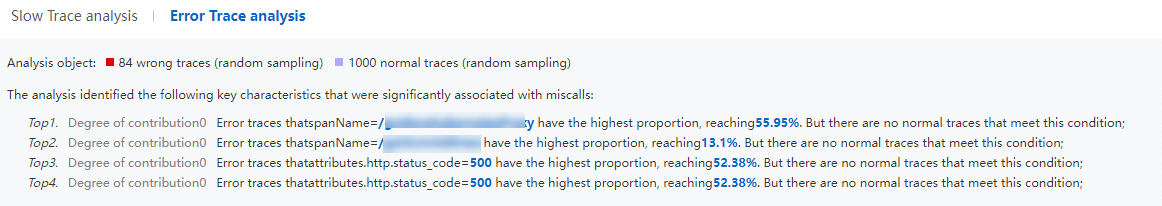
Failed trace analysis
ARMS randomly selects and analyzes 1,000 failed traces and displays the five dimensions most correlated with failures.
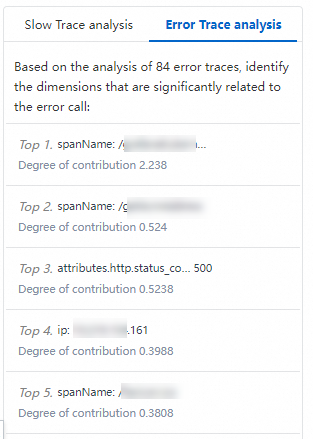
Failed trace details
ARMS compares failed traces against normal traces and surfaces the three characteristics most correlated with failed calls.
Trace details
Click a trace ID from the trace list or scatter plot to open the trace details view. The view is divided into four sections:

Section 1: Component tags
Tags at the top show the call types and span counts in the trace. Call types are defined by the attributes.component.name field. Click a tag to show or hide spans of that type.
Section 2: Trace timeline
The horizontal bar chart shows the entire trace and span distribution at a glance:
Each bar represents a span. Only spans whose duration exceeds 1% of the total trace duration are displayed.
Colors indicate different services. For example, blue represents the
opentelemetry-demo-adserviceapplication.The black line within a bar represents the span's self-time (total span duration minus child span duration). For example, if Span A takes 10 ms and its child Span B takes 8 ms, the black line for Span A represents 2 ms.
The timeline at the top shows the full time range of the trace.
Section 3: Span hierarchy and navigation
Each row represents a span, displayed in a parent-child hierarchy. A number before each parent span indicates how many child spans it contains.
Available operations:
Operation | Description |
Collapse | Click the |
Focus | Click the |
Defocus | Click the |
Filter | Enter a span name, service name, or attribute in the search box to filter the view from that span to the entry span. Clear the search box and click the Search icon to remove the filter. |
Zoom | Click the |
 icon to collapse or expand a span and its children.
 icon to show only the selected span and its downstream spans.
 icon to restore the full trace view.
 icon to zoom in and hide the bar chart. Click the
  icon to restore the bar chart.
Section 4: Span details
Select a span to view its details, related metrics, logs, and exception information.
Tab | Description |
Additional Information | Displays the span's attributes, resources, details, and events, grouped by type. For field descriptions, see Trace Explorer parameters. |
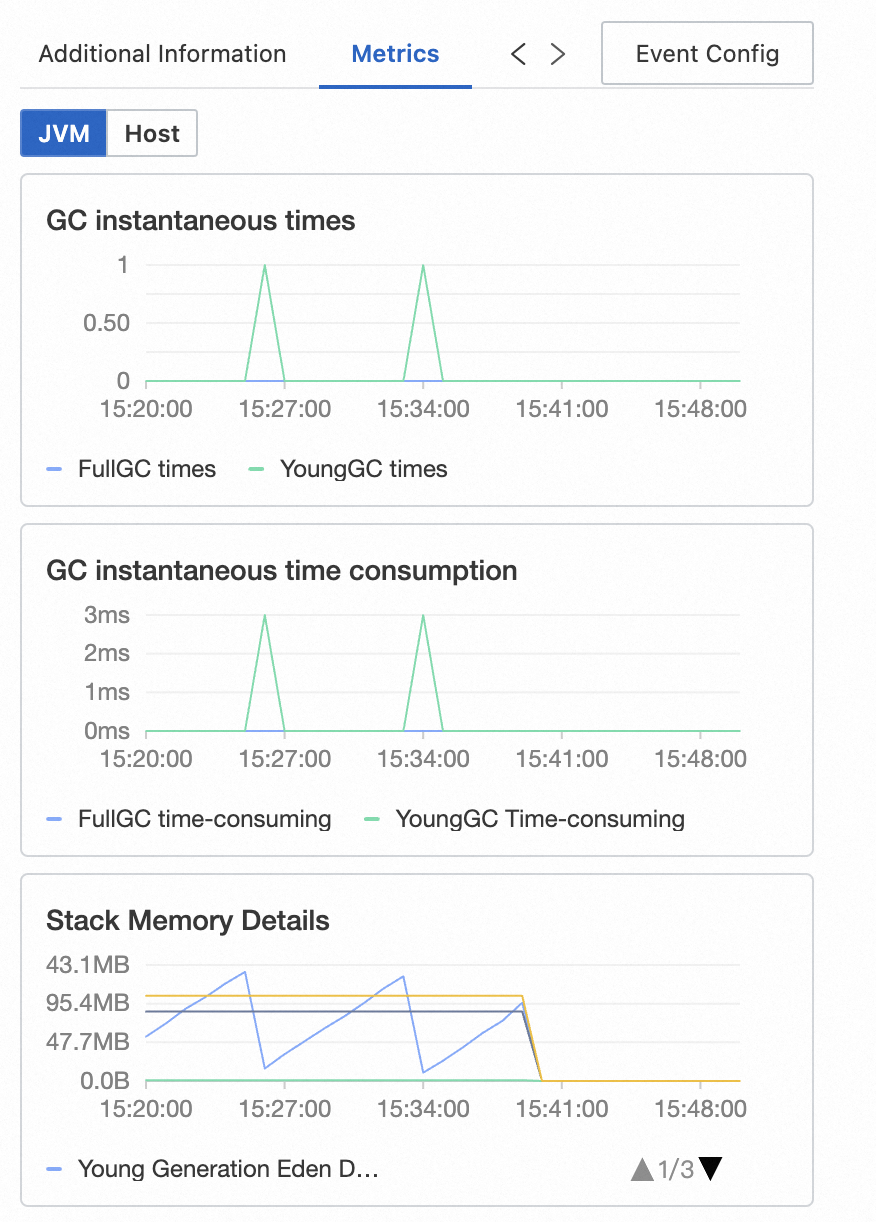
Metrics | Displays metrics related to the span. For Java applications monitored by ARMS, JVM and host metrics are displayed. For traces reported by open source agents, RED method metrics (rate, errors, duration) are displayed. |
Logs | Displays business logs related to the trace. If a Simple Log Service (SLS) Logstore is configured for the application, business logs can be queried by trace ID. |
Exceptions | Displays exception information related to the span, if any. |
Event Config | Configure custom interaction events for one or more trace attributes to access additional details, logs, or metrics. For instructions, see Configure a custom interaction event for a trace. |
What's next
To receive notifications when errors occur, create alert rules for one or all operations. See Create an alert rule.