After a Microservices Engine (MSE) ZooKeeper engine is created, you can view various runtime parameters and performance metrics on the Monitoring Center page to quickly identify potential issues and performance constraints. This helps you take effective optimization measures at the earliest opportunity, improves engine stability and reliability, and minimizes the risks of system interruptions and failures. This topic describes how to view the monitoring data of an MSE ZooKeeper engine.
Prerequisites
Enable the Grafana dashboard
Basic Edition
If your engine uses Basic Edition, the Grafana dashboard is automatically enabled after you upgrade the engine to Professional Edition. For more information about how to upgrade the engine version, see Upgrade a ZooKeeper version.
Professional Edition
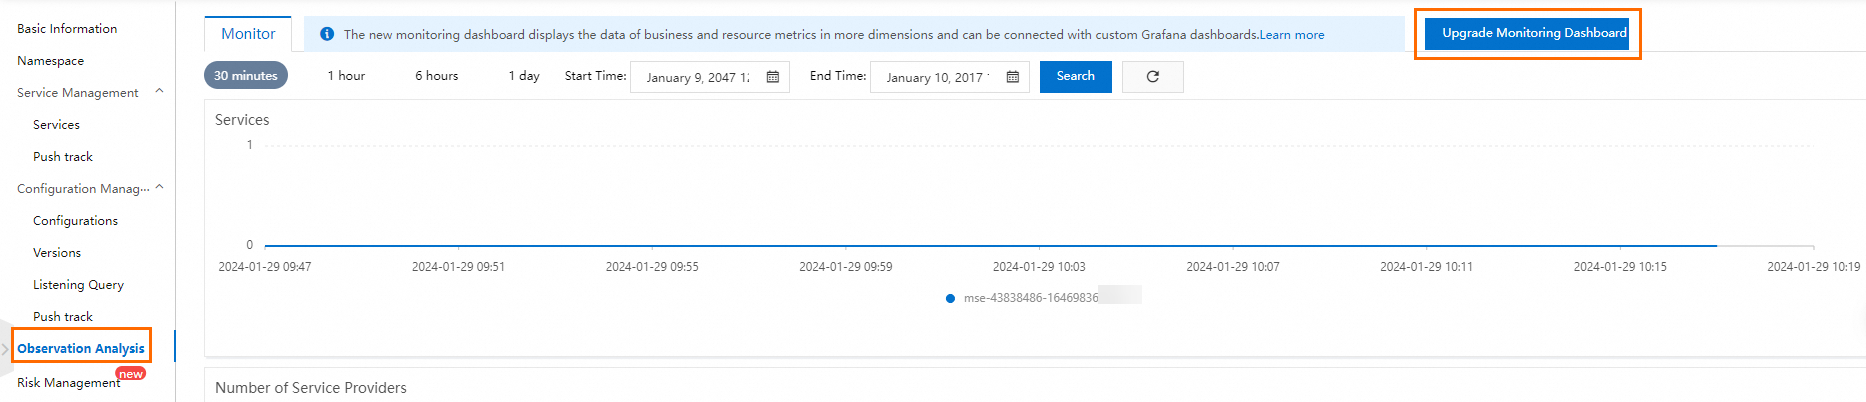
If your engine uses Professional Edition and the engine version is 2.0.3 or earlier, you need to click Upgrade Monitoring Dashboard on the Observation Analysis page in the MSE console, and follow the steps in the dialog box that appears to enable the Grafana dashboard.
Use the Grafana dashboard
If you enable the Grafana dashboard, you can view various performance metrics on the dashboard.
Log on to the MSE console, and select a region in the top navigation bar.
In the left-side navigation pane, choose Microservices Registry > Instances.
On the Instances page, click the name of the instance.
In the left-side navigation pane, click Monitoring Center.
NoteThe default monitoring cycle is 15 minutes before the current time. You can click the time range drop-down list in the upper-right corner to select another time range or configure a custom time range as the monitoring cycle.
When you move the pointer over a specific position in a data chart, the metric data of nodes at the specified point in time is displayed. The time is accurate to minutes.
Click the
 icon in the upper-right corner to refresh the current monitoring data.
Business Monitoring: ZooKeeper Developer Edition and Professional Edition are integrated with Managed Service for Prometheus, which supports monitoring the following metrics of ZooKeeper instances: QPS, TPS, Connections, Watch count, Znodes count, Watch Bytes, Avg Request Latency, Approximate Data Size, Ephemerals Count, Packet Received, MAX Response Size, Packet Sent, Open File Descriptor Count, and Outstanding Requests.
Resource Monitoring: Supports monitoring the following resource metrics of instances: Memory Usage, CPU Usage, CPU load, Total Network Traffic, Outlet flow, Inlet flow, File reading and writing, Young GC time (within 1 minute), Young GC times (within 1 minute), CMS GC time (within 1 minute), CMS GC times (within 1 minute), and Heap Used vs Max.
Top N Monitoring: MSE ZooKeeper-specific top N monitoring dashboard supports monitoring top n metrics, such as top N Znode sizes, top n Znode count, top n Znode listener count, top n Znode child node listener count
, top n client TPS, top n client QPS, top n Znode QPS, and top n Znode TPS to display instance and business statuses in real time.
Optional. If you require more advanced observability capabilities, click Using Grafana Expert Edition in the upper-right corner to access the Grafana service console and use multi-tenant Grafana dashboard capabilities.
Optional. If you need to embed the engine monitoring page, click Open in New Window XX (XX represents the specific monitoring name) in the upper-right corner to obtain the URL of the new page.
For example, click the Registry Monitoring tab, and then click Open in New Window Registry Monitoring in the upper-right corner to open the Registry Monitoring tab in a new page.
Use the old dashboard
If you do not enable the Grafana dashboard, you can still use the old dashboard provided by MSE. To view data of more metrics, we recommend that you upgrade the monitoring dashboard to the Grafana dashboard. For more information, see Enable the Grafana dashboard.
Log on to the MSE console, and select a region in the top navigation bar.
In the left-side navigation pane, choose Microservices Registry > Instances.
On the Instances page, click the name of the instance.
In the left-side navigation pane, click Observation Analysis.
On the Observation Analysis page, click the Monitoring tab to view the number of services, number of service providers, and average response time (RT) of the service write interface (ms).
NoteThe default monitoring cycle is 30 minutes before the current time. You can select another time range, such as Last 30 minutes, Last 1 hour, Last 6 hours, and Last 24 hours. You can also configure a custom time range.
The monitoring data of three nodes in the engine is displayed in different colors on the page. You can click the name of a node in the lower part of a chart to display or hide the data of the node. You must make sure that data of at least one node is displayed.
When you move the pointer over a specific position in a chart, metric data of three nodes at the specified point in time is displayed. The time is accurate to minutes.
Click the
icon in the upper-right corner to refresh the current monitoring data.