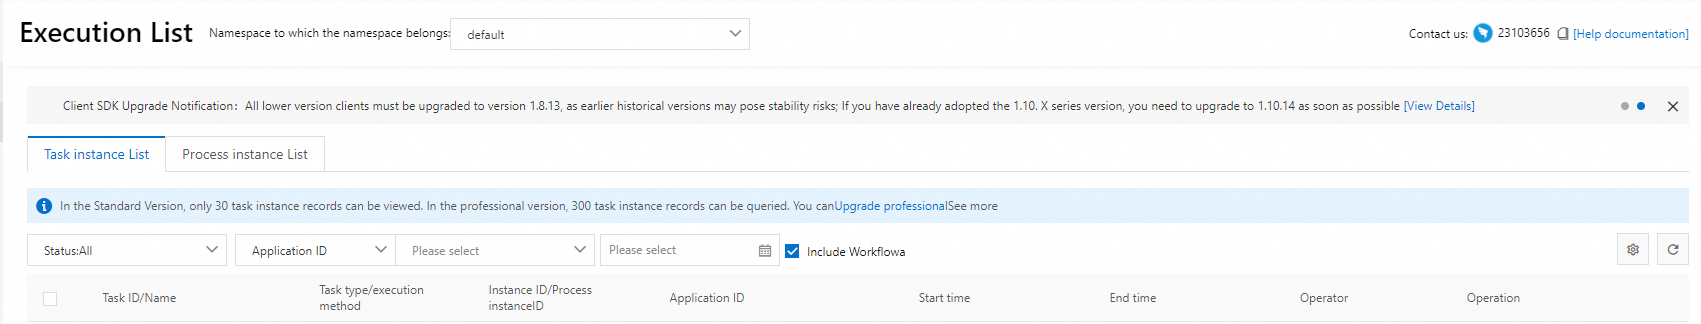
When scheduled jobs or workflows fail or behave unexpectedly, you need a centralized view of all executions to quickly identify problems. The Execution List page in SchedulerX displays all job and workflow executions for the current day, organized into two tabs:
Task instance List -- Individual job instance records.
Process instance List -- Workflow instance records.
SchedulerX Basic Edition displays up to 10 job instance execution records. SchedulerX Professional Edition displays up to 100.
View the execution list
Log in to the SchedulerX console.
In the top navigation bar, select a region.
In the left-side navigation pane, click Execution List.
On the Execution List page, select a namespace from the Namespace to which the namespace belongs drop-down list.
Click the Task instance List tab to view job instances, or the Process instance List tab to view workflow instances.
Filter execution records
By default, SchedulerX displays all execution records. Filter or search records using any combination of the following criteria:
| Filter type | Options |
|---|---|
| Status | All, Success, Failure, Run, Pool, or Wait |
| ID | Application ID, Task ID, or Instance ID |
| Time range | Minute, hour, day, week, month, or User-Defined |
View job instance details
On the Task instance List tab, find the target job instance and click Details in the Operation column.
On the Job Instance Details page, review the available tabs. The tabs displayed depend on the execution mode:
Execution mode Available tabs Standalone Basic Information, Operational Log Broadcast Basic Information, Current Execution Details Parallel Computing Basic Information, Current Execution Details, Tasks Memory Grid Basic Information, Current Execution Details Grid Computing Basic Information, Current Execution Details Sharding Basic Information, Sharding Details
Manage tasks in a Parallel Computing job
On the Tasks tab, the available operations depend on the task state:
| Task state | Available operations |
|---|---|
| Wait | Mark as completed |
| Failure | Rerun or mark as completed |
| Run | Terminate |
| Success | None |
View workflow instance details
On the Process instance List tab, find the target workflow instance and click its ID in the Operation column.
On the Canvas page, review the DAG (Directed Acyclic Graph) visualization of the workflow. Each job node is color-coded by state: red for failed, gray for pending. When a job fails, all its downstream dependents change to the pending state.
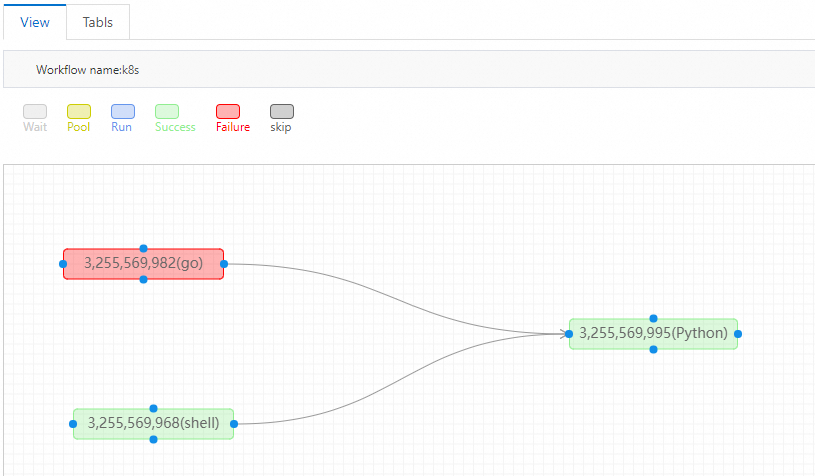
Troubleshoot and rerun failed jobs
Right-click a failed job and select Details from the shortcut menu to identify the failure cause.
After fixing the issue, right-click the job and select Rerun from the shortcut menu. Downstream jobs run automatically after the rerun completes.
(Optional) To skip a failed job without fixing it, right-click the job and select Mark as Completed from the shortcut menu. Downstream jobs then proceed as if the job succeeded.