Microservices Engine (MSE) provides the traffic protection feature to detect traffic exceptions and attacks and report the events to a local file called sentinel-block.log. By forwarding these events to Simple Log Service (SLS), you gain centralized, real-time visibility into which requests are being blocked, why, and how often. Simple Log Service allows you to collect, store, and analyze log data, create indexes for large volumes of data, and query the data in real time.
This guide walks through three steps: installing the Logtail agent in your Container Service for Kubernetes (ACK) cluster, configuring SLS to collect and parse the block logs, and verifying that events appear in your Logstore.
Prerequisites
Before you begin, make sure you have:
An active Simple Log Service subscription. For activation steps, see "Step 1: Activate Simple Log Service" in Getting started
An ACK managed cluster. For setup instructions, see Create an ACK managed cluster
MSE Microservices Governance with traffic protection enabled and at least one traffic protection rule configured. For details, see Overview
Step 1: Install Logtail
Logtail is the log collection agent that runs as a DaemonSet in your ACK cluster. If you already enabled Simple Log Service when creating the cluster, skip this step. For background, see Install Logtail when you create a cluster.
These steps apply to both ACK managed clusters and ACK dedicated clusters.
Log on to the ACK console. In the left-side navigation pane, click Clusters.
On the Clusters page, find your cluster and click its name. In the left-side navigation pane, choose Operations > Add-ons.
On the Logs and Monitoring tab, find the logtail-ds card and click Install.
Step 2: Collect and parse traffic protection logs
In this step, you configure SLS to pull logs from sentinel-block.log, parse each line with a regular expression, and create indexes for querying.
Log on to the Simple Log Service console.
Click the Quick Data Import card. In the Import Data dialog box, search for Kubernetes and click Kubernetes - File.
Select Logstore -- Choose a project and a Logstore, then click Next.
To create a project, use the naming format
k8s-log-{your ACK cluster ID}, or select an existing project from the Project drop-down list.Select an existing Logstore from the Logstore drop-down list, or create one. For instructions, see Create a Logstore.
Machine Group Configurations -- Select the Kubernetes-group-${your ACK cluster ID} machine group from the Source Machine Group list, move it to the Applied Server Groups list, and click Next. If you selected a different project, create a machine group as prompted.
Logtail Configuration -- Configure the data source and parsing format as described in the following table, then click Next.
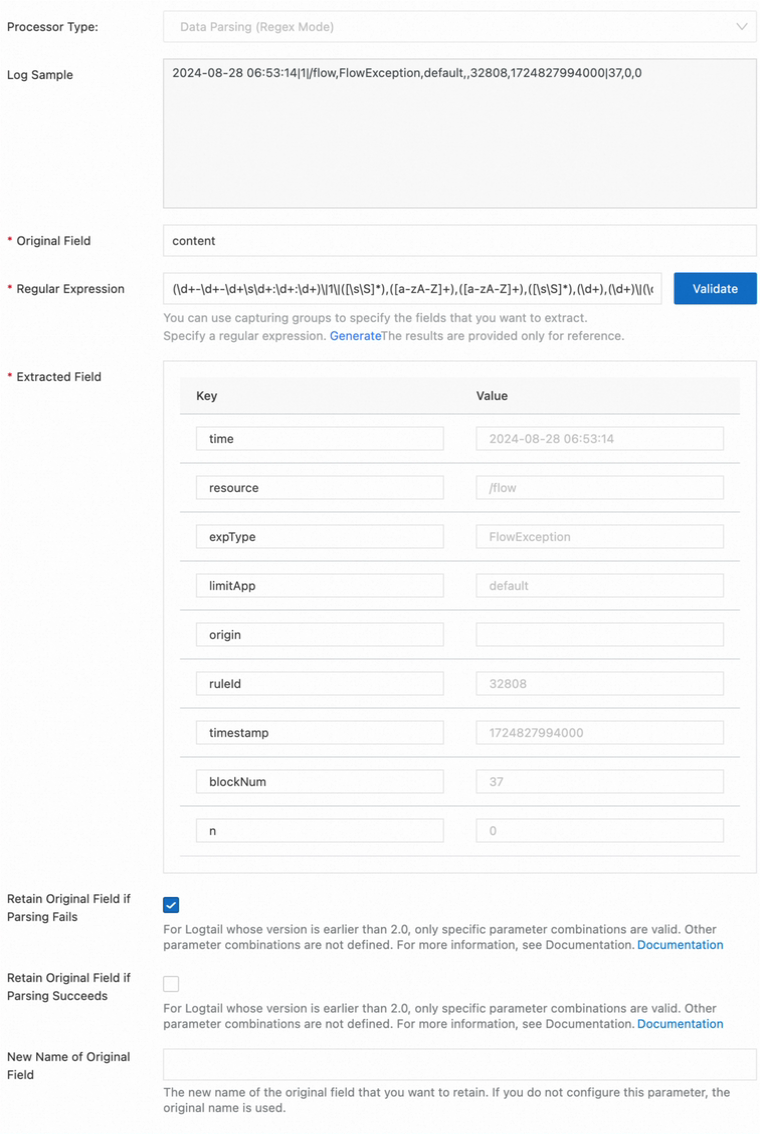
Parameter Value Configuration Name Enter a descriptive name, such as mse-sentinel-blockFile Path /${user_home}/logs/csp/sentinel-block.log-- replace${user_home}with the system home directory (typicallyroot). For details, see Important logsLog Sample 2024-08-28 06:53:14|1|/flow,FlowException,default,,32808,1724827994000|37,0,0Processing Method Select Processors and add a Data Parsing (Regex Mode) processor Regular Expression (\d+-\d+-\d+\s\d+:\d+:\d+)\|1\|([\s\S]*),([a-zA-Z]+),([a-zA-Z]+),([\s\S]*),(\d+),(\d+)\|(\d+),0,(\d+)The following image shows a sample processor configuration:

Query and Analysis Configurations -- Wait for the Preview Data section to refresh automatically. Add or update the index fields listed in the following table, then click Next.
Field Type Alias __tag__:_namespace_text namespace __tag__:container_name_text appName ruleIdlong Not required resourcetext timetext expTypetext blockNumdouble Click Query Log to return to the project page.
Step 3: Verify that events are reported
Log on to the Simple Log Service console.
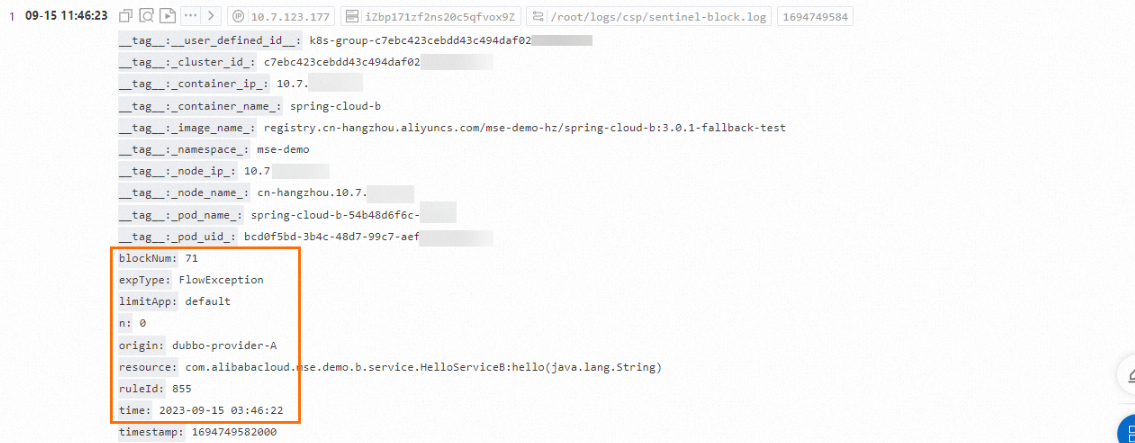
Open your project and check that traffic protection events appear in your Logstore.

FAQ
No logs appear in the Simple Log Service console
First, check whether sentinel-block.log is being generated. Connect to your ACK cluster through Cloud Shell and run:
cd ~/logs/csp/  # Replace with the actual log path if different
tail -n 10 sentinel-block.log
If entries appear (as shown below), the block logs are being generated but not reaching SLS. Double-check the File Path and Regular Expression in your Logtail configuration.

If the file is empty or missing, no requests are being blocked. Verify that:
Traffic protection is enabled in the MSE console
At least one traffic protection rule is active
Incoming requests actually exceed the rule threshold
To open Cloud Shell: log on to the ACK console, click your cluster name, and click Open Cloud Shell on the Overview page.
What to do next
After traffic protection events flow into SLS, set up alerts to get notified when blocking rates spike. See Configure a traffic protection alert based on Simple Log Service.