This topic describes how to check the details of a compatibility test report.
Overview
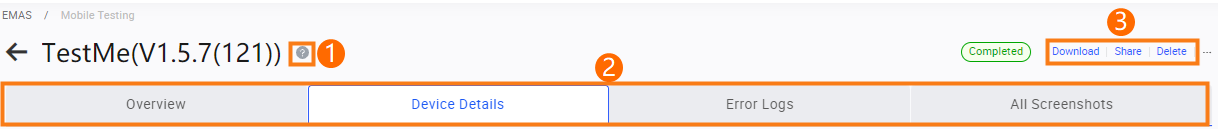 Click each tab to view relevant content.
Tab | Description |
Shows the Execution Results, Failure Type, Distribution of Failed Models, Error Logs, and Overview of Failed Models sections of the current test. | |
Shows the models used in the current test and the execution progress and results of the test task. | |
Shows all types of errors that occurred in the current test, including Crashes, ANRs, and Negligible Exceptions. | |
Shows the major screenshots of the current test. |
Overview
On the Overview tab, view the Execution Results, Failure Type, Distribution of Failed Models, Error Logs, and Overview of Failed Models sections of the current test.
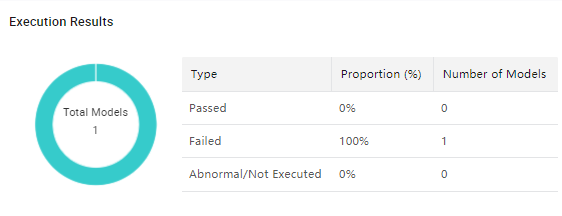
Execution Results
This section shows the number and the percentage of test models by execution result type. The execution result types include Passed, Failed, and Abnormal/Not Executed.
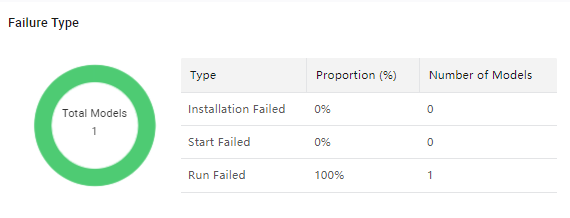
Failure Type
This section shows the number and the percentage of models by failure type. The failure types include Installation Failed, Start Failed, and Run Failed.
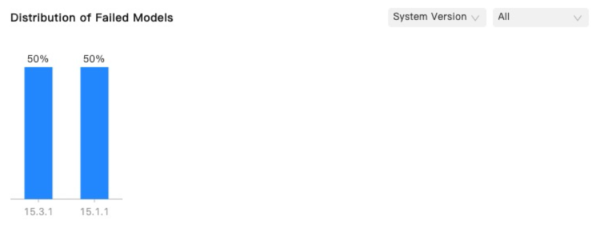
Distribution of Failed Models
This section shows the number and the percentage of failed models by the specified dimension and status.
Parameter | Description |
Dimension | Shows the number and the percentage of failed models in each state by the specified dimension. The dimensions include Brand, CPU, GPU, System Version, Memory, Resolution, and Screen. |
Status | Shows the number and the percentage of failed models by the specified dimension and status. The status of a failed model can be All, Installation Failed, Start Failed, or Run Failed. |
Error Logs
This section shows the list of critical errors.
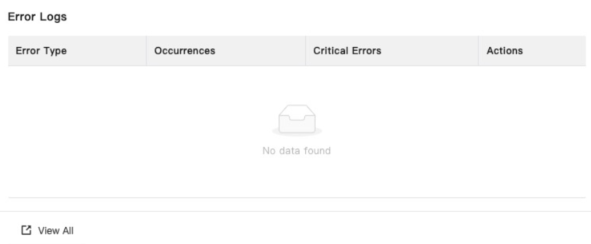
Click View All or View Details to view all errors and the log details of the errors on the Error Logs tab. For more information, see Error Logs.
Overview of Failed Models
This section shows the test result of each failed model.
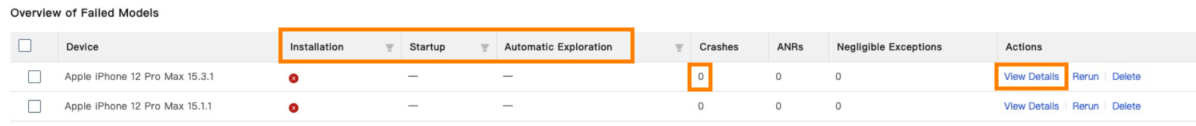
1. Click the Filter icon in the Installation, Startup, or Automatic Exploration column to filter failed models.
2. Click the number of devices displayed in the Crashes or ANRs column to view the exception details.
3. Click View Details in the Actions column to go to the Device Details tab. For more information, see Device Details.
Device Details
On the Device Details tab, perform the following operations:
1. In the left-side Device list, click Filter to filter devices by Classification Method or Status.
Filter condition | Description |
Classification Method | Groups test devices by classification method. The classification methods include By Test Result, By System Version, and By Brand. |
Status | Filters test devices in a specific state, such as All, Failed, Device Error, Abnormal/Not Executed, Timed Out, Passed, Pending, or Running. If Status is set to Failed, you can set Failure Part to Installation, Start, Run, or Uninstallation to further filter test devices. |
2. In the left-side Device list, click the name of a device to view the details of the device on the right side of the tab.
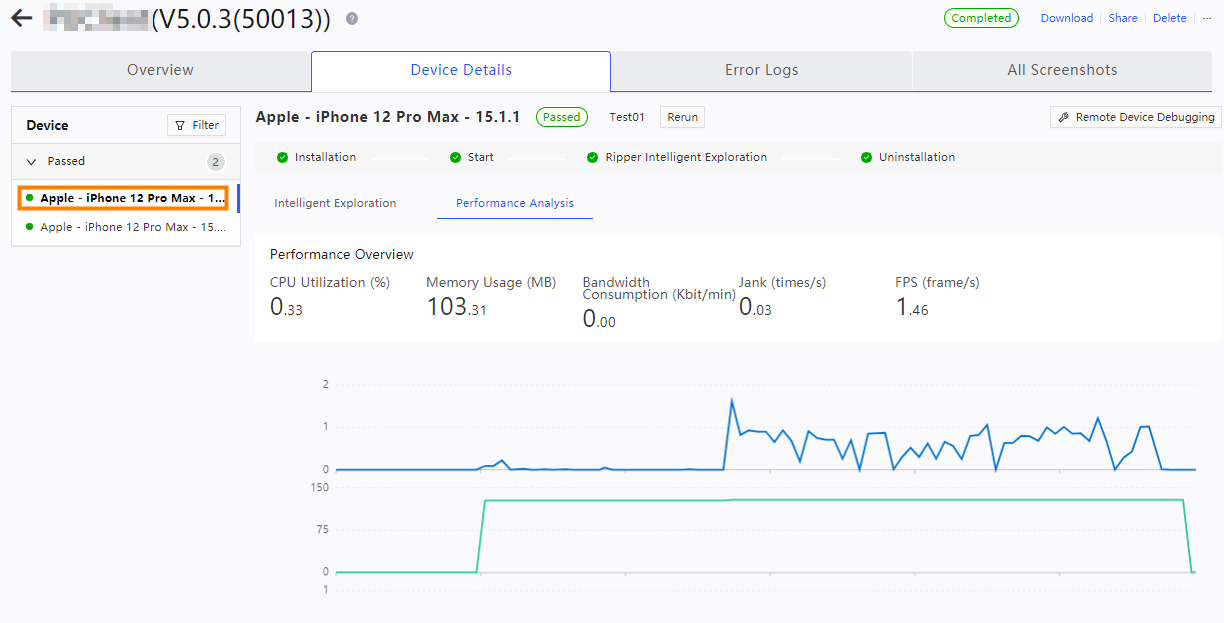
Execution status
This section shows the execution status of each compatibility test item of the specified device. The test items include Installation, Start, Ripper Intelligent Exploration, and Uninstallation.
If the specified device fails the test, click Remote Device Debugging to apply for the same model and verify the test result. For more information, see Remote debugging.
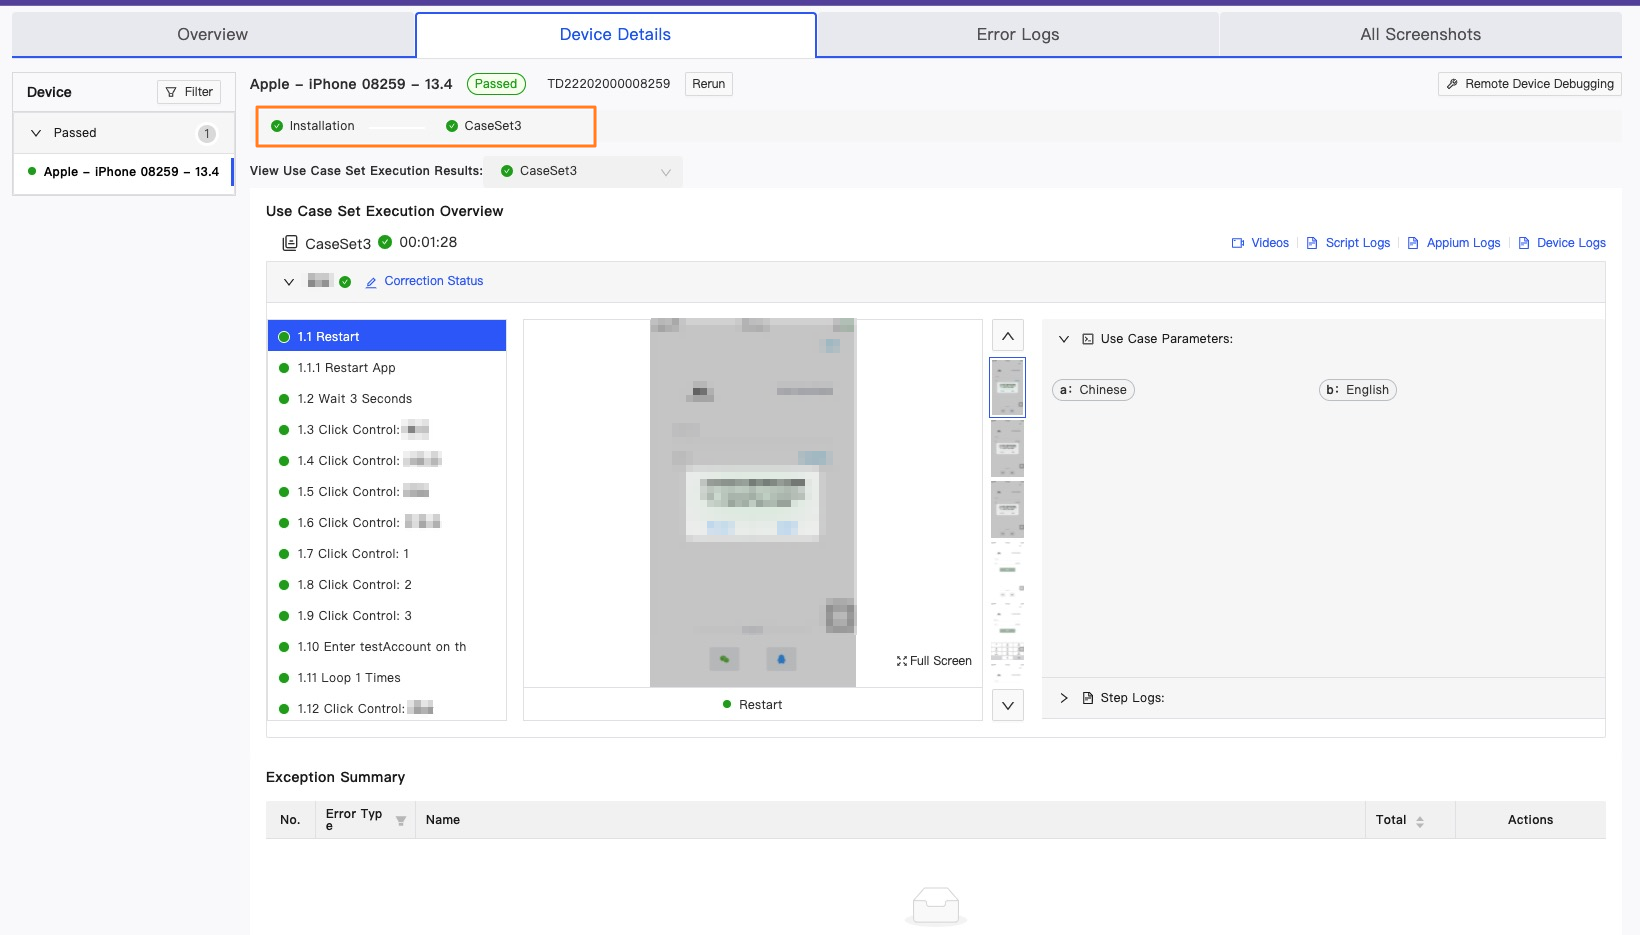
Intelligent Exploration
This tab shows the major screenshots and videos that are captured in the test process and the exception summary.
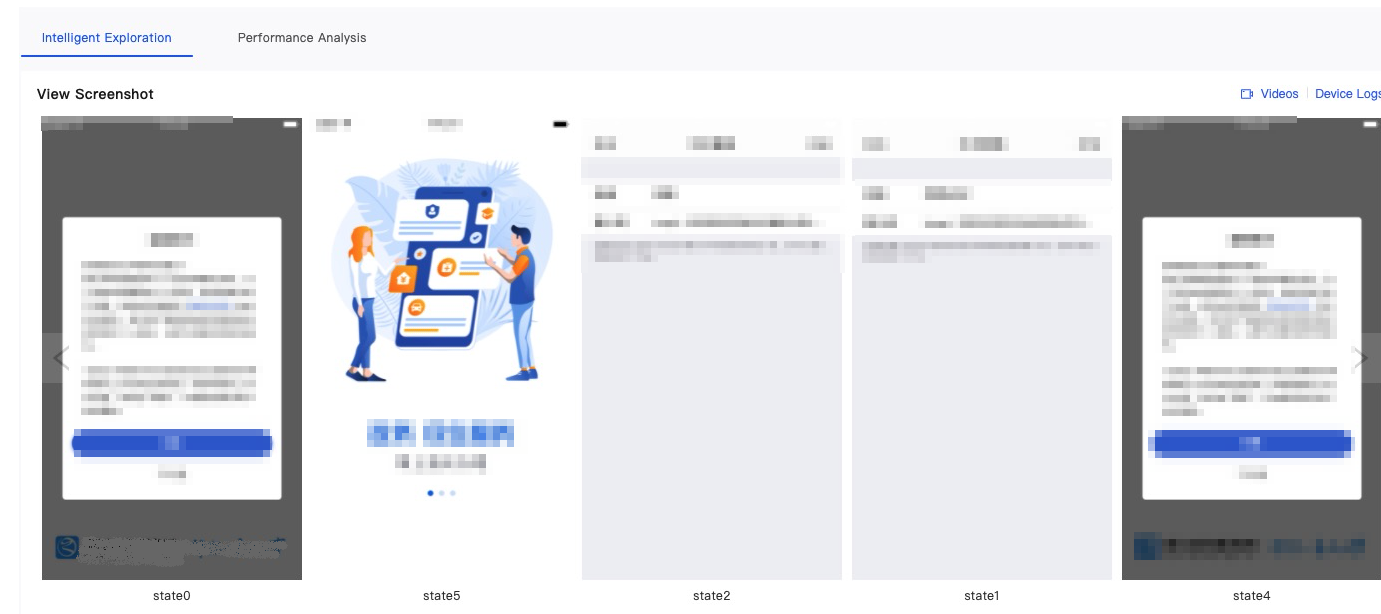
In the View Screenshot section, perform the following operations:
Click Videos or Screenshots to view the videos or screenshots that are captured in the intelligent exploration process.
Click Device Logs to view or download the log details of the specified device.
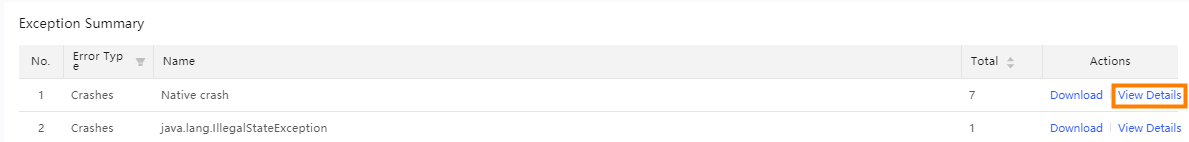
In the Exception Summary list, click View Details in the Actions column corresponding to an error to view the details of the error.
Performance Analysis
This tab shows the statistics and trends of CPU utilization, memory usage, network usage, and running status over time and the process-specific resource usage during the running process of the app.
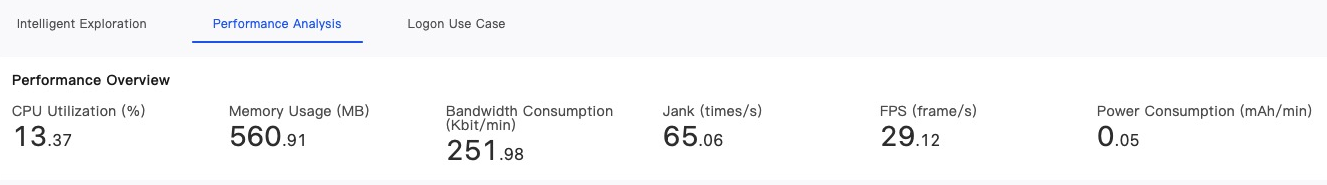
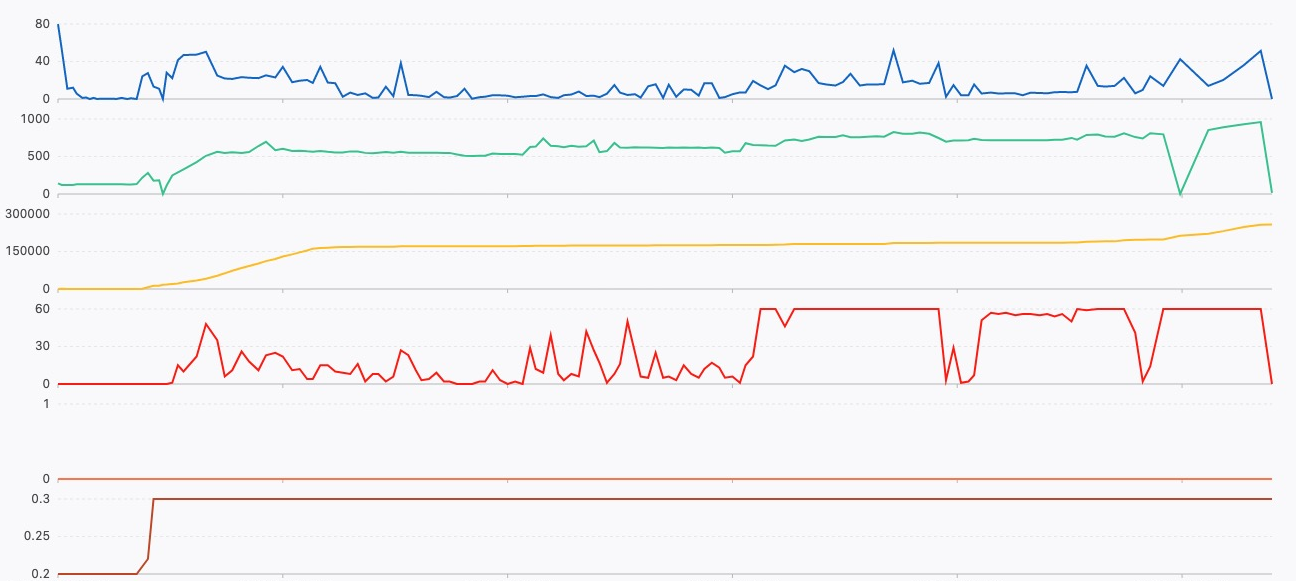
Move the pointer over the trend chart to view the real-time value of each statistical item.
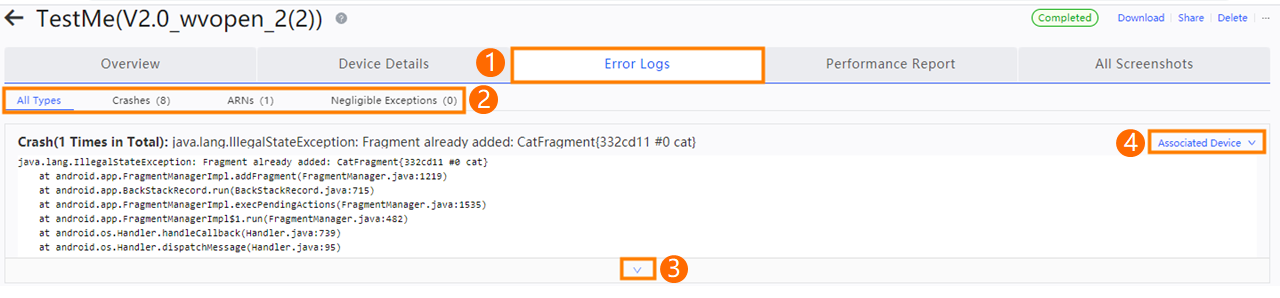
Error Logs
On the Error Logs tab, perform the following operations:
1. Click the Crashes, ANRs, and Negligible Exceptions tabs to view the error logs.
2. By default, part of an error log is displayed. Click the Expand icon to view the complete log.
3. Click Download Error Logs to download specific error logs.
4. Click Associated Device to view the device that caused the error and select the device name from the drop-down list. The Device Details tab of the specified device appears.
All Screenshots
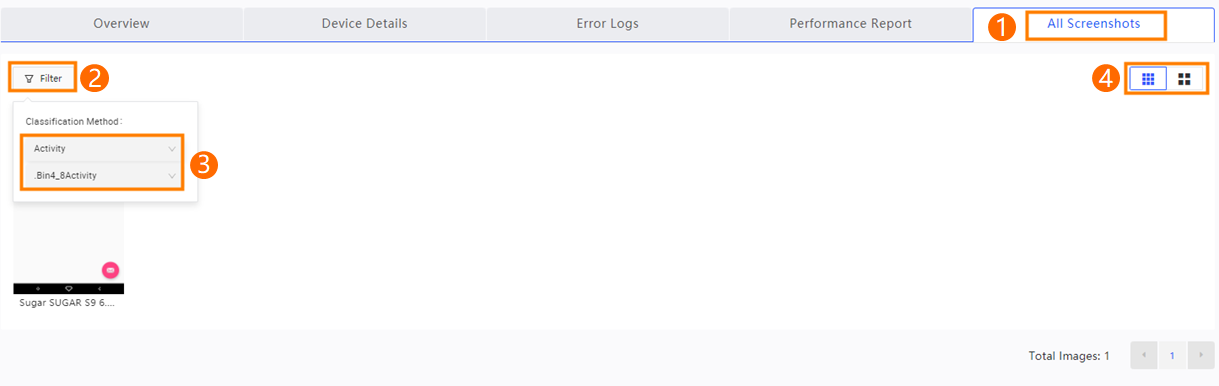
On the All Screenshots tab, perform the following operations:
Click Filter, set Classification Method, and then view the screenshots of the specified category.
Click the Large Image or Small Image icon on the right side of the tab to view the screenshots in the specified image format.