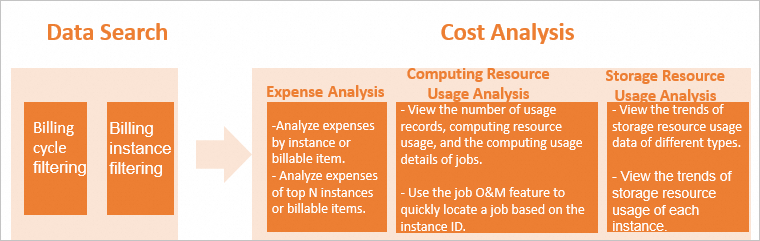
The cost analysis feature in MaxCompute gives you a consolidated view of your expenses, compute resource usage, and storage resource usage across billing instances. Use it to pinpoint which instances or billable items drive costs up, investigate sudden spikes, and gather the data you need for cost optimization.
The feature covers three analysis dimensions:
-
Expense analysis — view cost breakdowns and daily trends by instance or billable item
-
Compute resource usage analysis — identify top compute-consuming jobs and trace usage patterns
-
Storage resource usage analysis — track daily storage trends across storage types and instances
Prerequisites
Before you begin, make sure you have:
-
A MaxCompute project with pay-as-you-go computing or storage resources
-
RAM permissions to use the cost analysis feature — by default, RAM users and RAM roles do not have access. See RAM permissions for details
Usage notes
-
Cost analysis covers pay-as-you-go computing and storage resources only. Calculated expenses are derived from usage records using billing formulas, so figures may differ slightly from your actual bills due to rounding and approximate values.
-
A small amount of current-day data may be missing due to metering latency. Get the full usage records from the Usage Records tab in User Center.
-
Billable item names on the Expense Analysis tab come from metering types and differ from the names on the Billing Details page. See the mapping table in the Expense analysis section below.
-
For billing formula details, see Computing pricing (pay-as-you-go) and Storage pricing (pay-as-you-go).
Select a billing cycle and instance
Data is available for the previous 12 months. The system began recording data on May 7, 2023.
-
Log on to the MaxCompute console. In the top navigation bar, select a region.
-
In the left-side navigation pane, choose Cost Management > Cost Analysis.
-
On the Cost Analysis page, select a Billing Cycle. By default, the page shows data for the previous 7 days including the current day. The maximum billing cycle duration is 31 days.
-
(Optional) Select one or more instances from the Billing Instance drop-down list. A billing instance is a billing unit — it corresponds to an instance on the Usage Records tab in User Center, and in most cases the name matches your project name. If you leave this blank, all instances are included.
Instances with zero total expense in the selected billing cycle are not shown in the drop-down list.
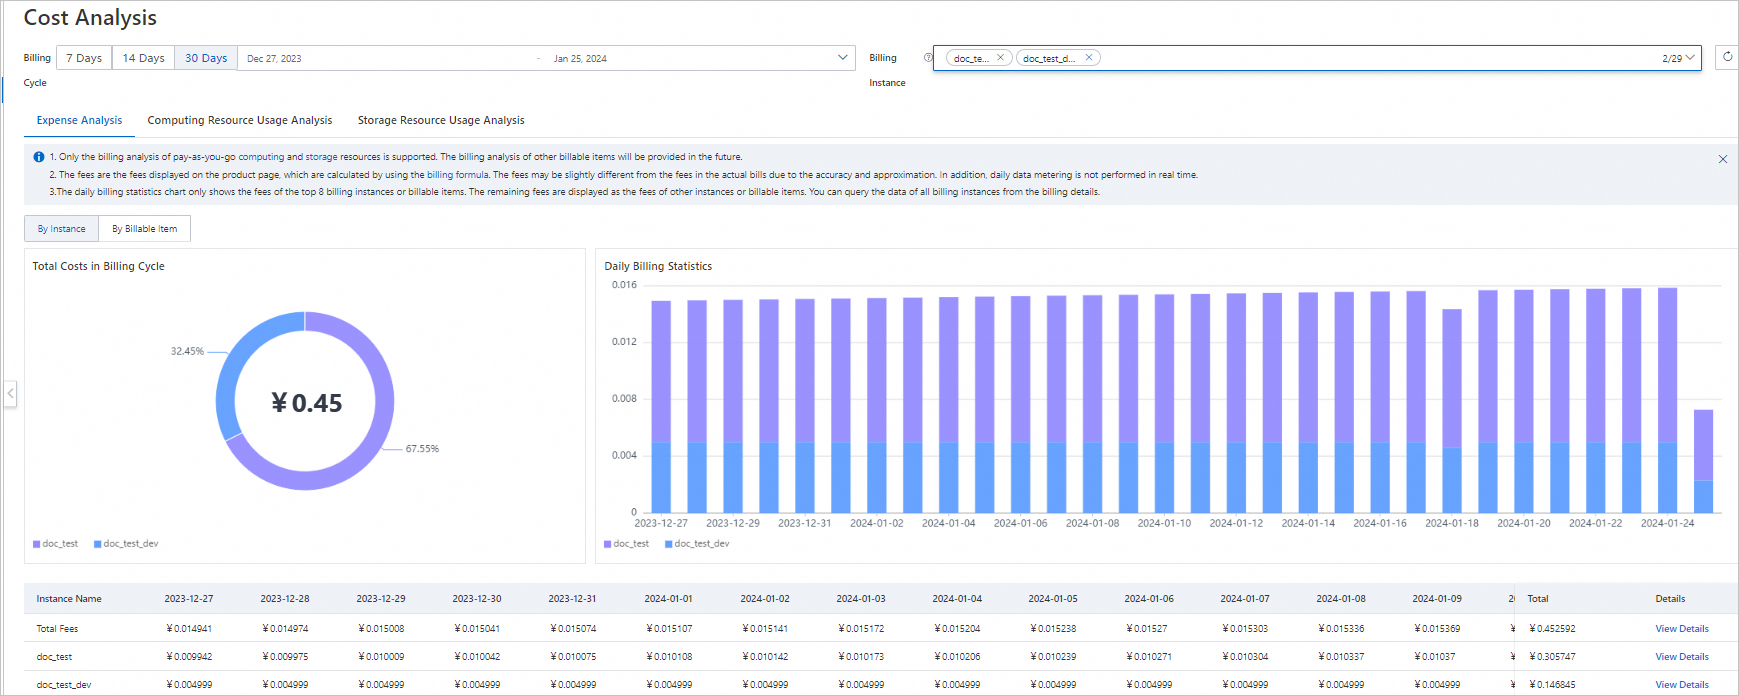
Expense analysis
Use expense analysis to find which instances or billable items account for the most spend, and to spot daily cost anomalies.
-
On the Cost Analysis page, click the Expense Analysis tab.
-
Choose an analysis dimension: by instance or by billable item.
Analyze expenses by instance
-
Total Costs in Billing Cycle — a pie chart showing the cost breakdown across instances. Hover over the chart to see the expense percentage for each of the top 7 instances (plus an aggregated "other" slice). Figures may differ slightly from your actual bills.
-
Daily Billing Statistics — a stacked bar chart showing daily costs from the start to end date of the billing cycle. Hover over a column to see the cost and percentage for each of the top 7 instances on that day, in descending order.
-
Details — a list of daily and total expenses per instance. Click View Details in the Detail column to see the cost breakdown by billable item within that instance, which helps you pinpoint the highest-cost billable item.
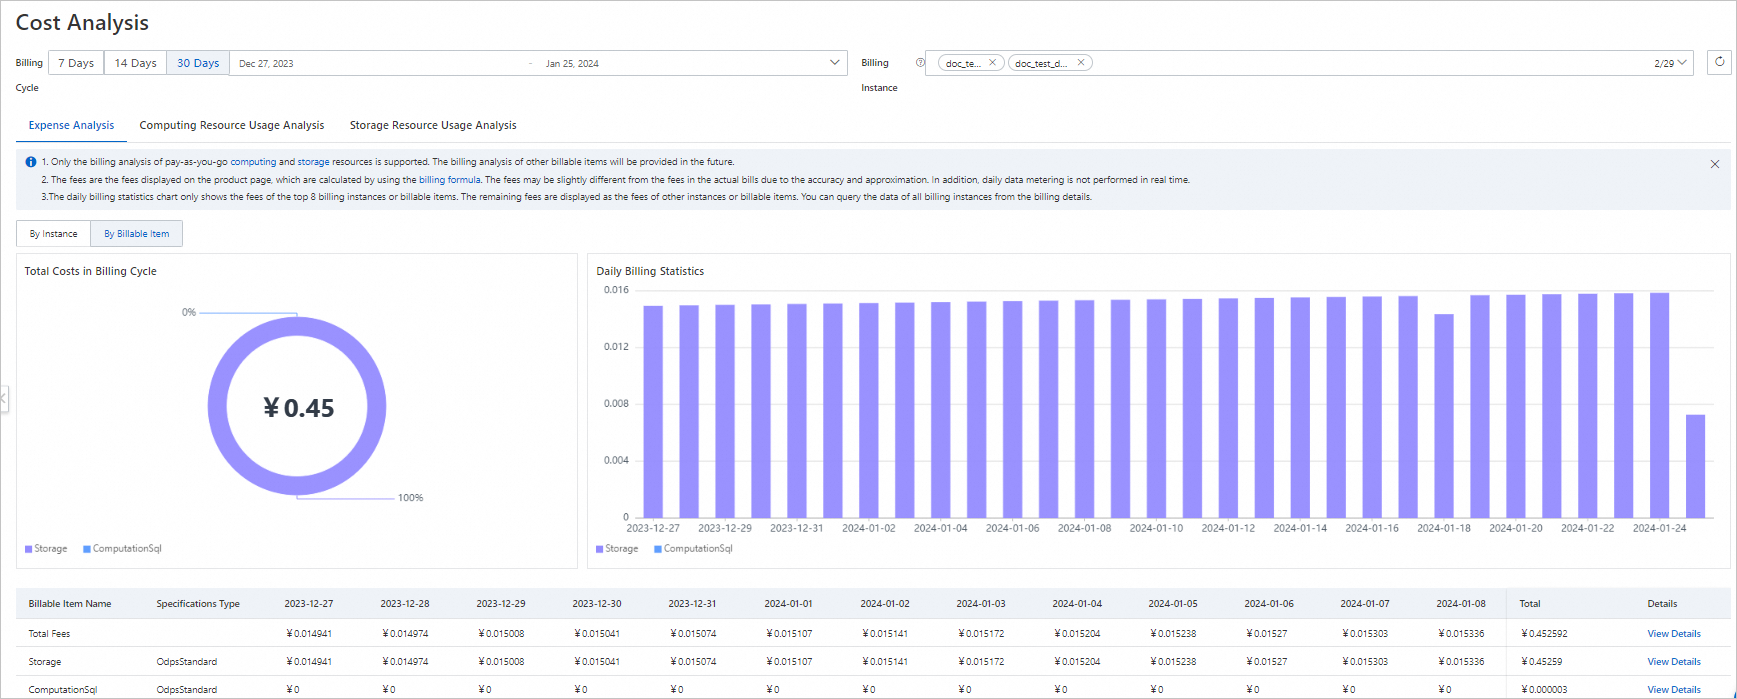
Analyze expenses by billable item
-
Total Costs in Billing Cycle — a pie chart showing the cost breakdown across billable items. Hover over the chart to see the expense percentage for each of the top 7 billable items. Figures may differ slightly from your actual bills.
-
Daily Billing Statistics — a stacked bar chart showing daily costs for each billable item across the billing cycle. Hover over a column to see the cost and percentage for each of the top 7 billable items on that day, in descending order.
-
Details — a list of daily and total expenses per billable item. Click View Details in the Detail column to see how costs are distributed across instances for a specific billable item, which helps you locate the instance with the highest spend.
The Specification Type field in the Details list uses the following values: - OdpsStandard: the pay-as-you-go resource package. See Pay-as-you-go. - OdpsSpot: the pay-as-you-go Spot resource package. See Spot Edition. - OdpsPlusStandard: the subscription resource package. See Subscription.
Billable item name mapping
Billable item names on the Expense Analysis tab match the metering type names in usage records, and differ from the names on the Billing Details page. If you see an unfamiliar name on your bill, use the table below to look up the corresponding name or code on the Billing Details page.
| Expense Analysis name | Billing Details name | Billing Details code |
|---|---|---|
| ComputationSql | SQL Computation / Spot SQL Job | odps_computation / odps_computation_sql_spot |
| ComputationSqlOTS | Tablestore External Tables / Spot Job with Tablestore External Table | mc_external_table_ots / odps_external_table_ots_spot |
| ComputationSqlOSS | OSS External Tables / Spot Job with OSS External Table | mc_external_table_oss / odps_external_table_oss_spot |
| spark | Spark Computation / Spot Spark Job | odps_computation_spark / odps_computation_mars_spot |
| mars | Mars (Pay-as-you-go) / Spot Mars Computation | odps_computation_mars / odps_computation_mars_spot |
| MapReduce | MapReduce Computation / Spot MapReduce Computation | CUUsage / odps_computation_mr_spot |
| Storage | Storage | Storage |
| RecycleBinStorage | RecycleBinStorage | RecycleBinStorage |
Compute resource usage analysis
Use compute resource usage analysis to investigate which jobs consume the most resources and whether a cost spike is driven by more jobs or heavier resource usage per job.
The analysis covers these metering types:
-
ComputationSql: SQL jobs on internal tables
-
ComputationSqlOTS: SQL jobs on Tablestore external tables
-
ComputationSqlOSS: SQL jobs on OSS external tables
-
MapReduce: MapReduce jobs
-
spark: Spark jobs
-
mars: Mars jobs
-
On the Cost Analysis page, click the Computing Resource Usage Analysis tab.
-
Review the charts and details list to identify usage patterns.
Number of usage records
A line chart showing the trend of total usage records per metering type. In most cases, one usage record equals one job. If a job accesses both an internal table and an external table, two usage records are generated for that job.
Use this chart to check whether a cost spike coincides with a sudden increase in the number of jobs.
Compute resource usage
A line chart showing the trend of compute resource usage per job type. Usage is calculated as follows:
-
ComputationSql, ComputationSqlOTS, ComputationSqlOSS: billed by the amount of data scanned (GB). Usage =
Amount of data scanned × Complexity. For ComputationSqlOTS and ComputationSqlOSS jobs, complexity is fixed at 1. -
MapReduce, spark, mars: billed by CU-hours.
Use this chart to check whether a cost spike is driven by heavier resource consumption per job rather than more jobs.
Usage details list
A list of jobs sorted by compute resource usage in descending order, so the top consumers appear first. Switch between two views:
-
View by instance ID: shows each job with its Instance ID, Specifications Type, Metering Type, Job Owner, Project, Submitted At, End Time, Signature, and Computing Resource Usage. Click an instance ID to go to the Jobs page for full job details. Specifications Type indicates the resource package used for the job:
-
OdpsStandard: pay-as-you-go resource package. See Pay-as-you-go.
-
OdpsSpot: pay-as-you-go Spot resource package. See Spot Edition.
-
OdpsPlusStandard: subscription resource package. See Subscription.
-
-
View by signature: groups jobs by script signature and shows Signature, IncludedInstance ID, and Total Computing Resource Usage. Jobs run from the same script share the same signature. Hover over the IncludedInstance ID column to see all instance IDs for a signature, and click any ID to view that job's details.
Storage resource usage analysis
Use storage resource usage analysis to monitor daily storage consumption trends across instances and storage types.
Daily storage resource usage is calculated by dividing the daily total storage usage for each instance by 24. It represents an average, not the current storage size.
-
On the Cost Analysis page, click the Storage Resource Usage Analysis tab.
-
On the Storage Usage Analysis tab, review the charts and details list.
-
Storage Trend(GB): a line chart showing the daily storage usage trend for one or more instances over the billing cycle. Data is broken down into total storage usage, standard storage usage, and backup storage usage.
-
Instance Storage Resource Usage(GB): a stacked bar chart showing the daily total storage usage, standard storage usage, and backup storage usage for each instance.
-
Usage details list: a table showing the daily total storage usage, standard storage usage, and backup storage usage per instance.
What's next
For guidance on reducing compute resource spend, see Optimization of computing resource configuration.