Use the MaxCompute cost analysis feature to analyze your costs and usage from multiple dimensions, such as details, proportions, and trends.
Overview
The cost analysis feature in MaxCompute provides in-depth analysis of your costs, computing usage, and storage usage. You can drill down from a cost overview to Usage Records for data-driven cost optimization, which is especially useful for fine-grained cost control.
The following figure shows the cost analysis workflow.
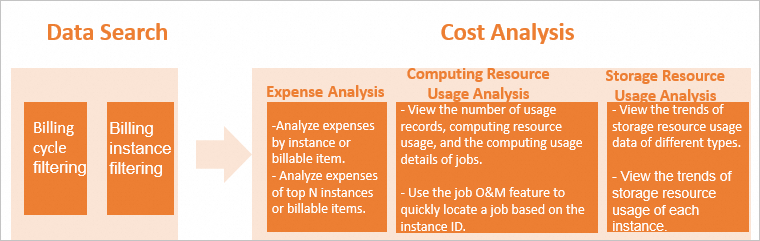
Data search
Filter by billing cycle and billing instance to search for data.
Cost analysis
Cost analysis covers the following three dimensions:
Analyze total costs within a specified billing cycle by instance or billable item. View cost proportions, daily cost trends, and detailed billing information for each instance or billable item to quickly identify the source of sudden cost increases—whether from a specific billing cycle, instance, or billable item—and simplify cost audits.
View the number of usage records, usage amount, and detailed job computing information for one or more instances in a specified billing cycle. For example, to investigate a sudden cost spike for a specific instance (project):
Check the trend of usage records to see if the spike was caused by a surge in the number of jobs.
Compare computing usage trends to determine if a spike in usage was the cause.
Drill down to job details to view the usage of specific jobs and identify which job caused the cost increase.
View daily trends of various storage types for one or more instances within a billing cycle, as well as the daily storage trend for each instance. This helps you quickly view storage volume trends and the average daily storage size. The daily storage value is the sum of an instance's daily metered usage divided by 24. Therefore, the daily usage does not reflect the real-time storage amount.
Notes
Currently, cost analysis only supports pay-as-you-go computing and storage. The cost data is based on Usage Records, which are list-price costs calculated by using billing formulas. Due to precision and rounding, the statistical results may have slight discrepancies with your actual bill. For more information about usage details, see Usage Records. Additionally, data for the current day may appear lower than expected due to metering latency or incomplete data.
For information about the billing rules for pay-as-you-go computing, see Computing pricing (pay-as-you-go). For information about the billing rules for pay-as-you-go storage, see Storage pricing (pay-as-you-go).
The billable item names in Expense analysis are derived from metering classifications and differ from the names on your bill. For the mapping, see Expense analysis.
The cost analysis feature uses RAM for authentication. By default, RAM users and RAM roles lack the necessary permissions. Grant the required permissions in the RAM console before using this feature. For more information, see RAM permissions.
Data search
You can view data from the last 12 months. Data records start from May 7, 2023.
Log in to the MaxCompute console and select a region in the upper-left corner.
In the left-side navigation pane, choose Observation O&M > Cost Analysis.
On the Cost Analysis page, select a Billing Cycle.
By default, cost analysis displays data for the last 7 days, including the current day. You can select a custom billing cycle with a maximum range of 31 days.
(Optional) In the Billing Instance drop-down list, select a Billing Instance.
A Billing Instance is a unit for which bills are generated. It corresponds to the instance in your cost and billing details and is typically a project name. By default, all instances are included. You can select one or more specific Billing Instance to analyze.
NoteInstances with zero total cost in the selected billing cycle do not appear in the selection list.
Expense analysis
On the Cost Analysis page, click the Expense Analysis tab.
On the Expense Analysis tab, analyze costs from the following perspectives:
By Instance:
Total Costs in Billing Cycle: A pie chart shows the total cost for the selected billing cycle. Hover over the chart to view the cost proportions of the top N instances (up to the top 7 plus others). Note that the data may have slight discrepancies from your actual bill due to precision and rounding.
Daily Billing Statistics: A stacked column chart shows the daily costs from the start to the end of the billing cycle. Hover over a column to see the costs and proportions of the top N instances for that day (up to the top 7 plus others), sorted in descending order. This chart helps you quickly track the daily cost trends for one or more instances.
Details list: A list shows the daily costs and total cost for each instance within the billing cycle. You can click View Details in the Details column for an instance to see the costs and cost proportions of its billable items. This helps you quickly identify the highest-cost billable item for that instance.
By Billable Item:
Total Costs in Billing Cycle: A pie chart shows the total cost for the selected billing cycle. Hover over the chart to view the cost proportions of the top N billable items (up to the top 7 plus others). Note that the data may have slight discrepancies from your actual bill due to precision and rounding.
Daily Billing Statistics: A stacked column chart shows the daily costs from the start to the end of the billing cycle. Hover over a column to see the costs and proportions of the top N billable items for that day (up to the top 7 plus others), sorted in descending order. By combining this chart with the instance filter at the top, you can quickly track daily cost trends for specific billable items within one or more instances.
Details list: A list shows the daily costs and total cost for each billable item within the billing cycle. You can click View Details in the Details column for a billable item to see which instances contributed to its cost, along with the cost and cost proportion for each instance. This helps you quickly identify the highest-cost instance for a specific billable item.
NoteThe Specifications Type column in the details list includes the following values:
OdpsStandard: pay-as-you-go standard edition. For more information, see Pay-as-you-go Standard Edition.
OdpsSpot: pay-as-you-go spot edition. For more information, see Spot Edition.
OdpsPlusStandard: Subscription-based computing resources. For more information, see Subscription Standard Edition.
The billable item names in Cost Analysis are based on the type names in Usage Records and differ from the names in the detailed bills in User Center. The mappings are as follows:
Analysis item name | User Center name | User Center code |
ComputationSql |
|
|
LogicalOSS | Logical size of OSS external tables (pay-as-you-go) | mc_extable_LogicalOSS |
LogicalOTS | Logical size of Tablestore external tables (pay-as-you-go) | mc_extable_LogicalOTS |
LogicalHOLO | Logical size of Hologres external tables (pay-as-you-go) | mc_extable_LogicalHOLO |
LogicalJDBC | Logical size of JDBC external tables (pay-as-you-go) | mc_extable_LogicalJDBC |
LogicalHDFS | Logical size of HDFS external tables (pay-as-you-go) | mc_extable_LogicalHDFS |
LogicalOSSHDFS | Logical size of OSSHDFS external tables (pay-as-you-go) | mc_extable_LogicalOSSHDFS |
LogicalHBase | Logical size of HBase external tables (pay-as-you-go) | mc_extable_LogicalHBase |
PhysicalUnstructuredOSS | ObjectTable external tables (pay-as-you-go) | mc_extable_OT |
spark |
|
|
MapReduce |
|
|
Storage |
|
|
RecycleBinStorage |
|
|
Computing usage analysis
On the Cost Analysis page, click the Computing Resource Usage Analysis tab.
On the Expense Analysis tab, analyze your computing usage:
Number of Usage Records:
A line chart shows the trend of the total number of records for each data type in the Usage Records. The number of usage records corresponds to the number of jobs. If a job involves both internal and external tables, two usage records are generated.
Computing Resource Usage:
A line chart shows the trend of computing usage for each job type. Usage is calculated in one of three ways:
Data scanned (Unit: GB): For job types such as ComputationSql, computing usage is calculated as
data scanned * complexityfor each job.Logical data size (Unit: GB): For job types such as LogicalOSS and LogicalOTS, the logical size is the data size before compression and encoding.
CU-hours (Unit: CU-hours): For billable items such as MapReduce and spark, billing is based on CU-hours.
Usage details list:
The list shows detailed job usage, sorted by usage in descending order by default, helping you quickly identify the top N jobs by consumption. You can view details for individual jobs (by Instance ID) or for all jobs created from the same script (by Signature). Jobs run from the same script share a Signature.
By Instance ID:
The list includes the following information: Instance ID, Specifications Type, Metering Type, Job Owner, Project, Submitted At, End Time, Signature, and Computing Resource Usage.
Click an Instance ID to navigate to the Jobs page for more information about the job. The Specifications Type corresponds to the purchased service edition and includes the following:
OdpsStandard: pay-as-you-go standard edition. For more information, see Pay-as-you-go Standard Edition.
OdpsSpot: pay-as-you-go spot edition. For more information, see Spot Edition.
OdpsPlusStandard: Subscription-based computing resources. For more information, see Subscription Standard Edition.
By Signature:
The list includes the following information: Signature, associated instance IDs, and total computing usage.
Hover over the associated instance IDs column for a specific Signature to display all the instance IDs. You can click an ID to navigate to the Jobs page for more information about that job.
Storage usage analysis
On the Cost Analysis page, click the Storage Resource Usage Analysis tab.
On the Storage Resource Usage Analysis tab, analyze your storage usage:
Storage trend by type (GB):
A line chart shows the storage size trend for various storage types, including total, standard, and backup storage, for one or more instances over the selected billing cycle.
Storage usage by instance (GB):
A stacked column chart shows the daily storage size trend for each instance by storage type.
Details list:
A list shows the daily storage size details for each storage type.
Related documents
To optimize costs and improve resource utilization, see Optimize computing resource configurations.