These benchmark results show the write throughput LindormTSDB achieves across four cluster sizes. Use them to estimate whether a given cluster specification can handle your expected write volume, and to tune batch size and concurrency before going to production.
Results were measured in a dedicated write-only environment with no concurrent queries. Throughput drops when queries run alongside writes or when the volume of time series data grows large. Treat these numbers as a reference ceiling, not a production guarantee. Test with your own workload before sizing.
Cluster sizing reference
Use this table to select the cluster specification that meets your target TPS. Numbers are peak TPS at batch=500 and optimal concurrency in a write-only environment.
| Cluster specification | Peak TPS (approx.) | Recommended for |
|---|---|---|
| 3 nodes x 4 cores, 16 GB | ~544,000 | Up to ~500K field values/s |
| 3 nodes x 8 cores, 32 GB | ~3,440,000 | Up to ~3M field values/s |
| 3 nodes x 16 cores, 64 GB | ~7,290,000 | Up to ~7M field values/s |
| 3 nodes x 32 cores, 128 GB | ~12,400,000 | Up to ~12M field values/s |
These figures assume no concurrent query load. Size up by at least one tier if your workload mixes reads and writes.
How to read these results
Three variables determine write throughput: batch size, worker count, and cluster size. Understanding how each affects TPS helps you tune your client before running your own benchmark.
Batch size has the largest impact. Going from batch=1 to batch=100 typically increases TPS by 10–50x, depending on the cluster. Returns diminish above batch=100–200; doubling from 200 to 500 adds only 10–30% more throughput. A batch size of 100–200 rows is a practical starting point for most workloads.
Worker count saturates quickly on smaller clusters. On the 4-core cluster, TPS peaks at 16–50 workers and stays flat (or slightly drops) beyond that. On the 8-core cluster, throughput at smaller batch sizes peaks around 16–50 workers, but at larger batch sizes (batch=100 or more) throughput continues growing through worker=100–200. On the 16-core and 32-core clusters, throughput continues to grow up to 100–200 workers because the larger CPU pool can absorb more parallelism. Start with 16–50 workers and increase only after confirming CPU headroom is available.
Test setup
Data model
The test simulates a server monitoring scenario: 10,000 devices, each reporting 101 field values across nine subsystems every 10 seconds, covering 15 days of data.
One table is created per subsystem. Each table uses hostname as the primary tag (the unique device identifier) plus additional tags for location and service metadata. For details on tags, fields, and data points, see Data model.
The nine subsystems and their tables:
| Subsystem | Table | Field count |
|---|---|---|
| CPU | cpu | 10 (double) |
| Memory | mem | 9 (BIGINT + double) |
| Disk | disk | 7 (BIGINT) |
| Disk I/O | diskio | 7 (BIGINT) |
| Kernel | kernel | 6 (BIGINT) |
| Network | net | 8 (BIGINT) |
| Redis | redis | 31 (BIGINT) |
| PostgreSQL | postgresl | 16 (BIGINT) |
| NGINX | nginx | 7 (BIGINT) |
CREATE TABLE statements
CREATE table cpu(hostname VARCHAR primary TAG,region VARCHAR TAG,datacenter VARCHAR TAG,rack VARCHAR TAG,os VARCHAR TAG,arch VARCHAR TAG,team VARCHAR TAG,service VARCHAR TAG,service_version VARCHAR TAG,service_environment VARCHAR TAG,time BIGINT,usage_user double,usage_system double,usage_idle double,usage_nice double,usage_iowait double,usage_irq double,usage_softirq double,usage_steal double,usage_guest double,usage_guest_nice double);

CREATE table mem(hostname VARCHAR primary TAG, region VARCHAR TAG, datacenter VARCHAR TAG, rack VARCHAR TAG, os VARCHAR TAG, arch VARCHAR TAG, team VARCHAR TAG, service VARCHAR TAG, service_version VARCHAR TAG, service_environment VARCHAR TAG, time BIGINT,total BIGINT, available BIGINT, used BIGINT, `free` BIGINT, cached BIGINT, buffered BIGINT, used_percent double, available_percent double, buffered_percent double);

CREATE table disk(hostname VARCHAR primary TAG, region VARCHAR TAG, datacenter VARCHAR TAG, rack VARCHAR TAG, os VARCHAR TAG, arch VARCHAR TAG, team VARCHAR TAG, service VARCHAR TAG, service_version VARCHAR TAG, service_environment VARCHAR TAG, path VARCHAR TAG, fstype VARCHAR TAG,time BIGINT,total BIGINT, `free` BIGINT, used BIGINT, used_percent BIGINT, inodes_total BIGINT, inodes_free BIGINT, inodes_used BIGINT);

CREATE table diskio(hostname VARCHAR primary TAG, region VARCHAR TAG, datacenter VARCHAR TAG, rack VARCHAR TAG, os VARCHAR TAG, arch VARCHAR TAG, team VARCHAR TAG, service VARCHAR TAG, service_version VARCHAR TAG, service_environment VARCHAR TAG, serial VARCHAR TAG,time BIGINT,`reads` BIGINT, writes BIGINT, read_bytes BIGINT, write_bytes BIGINT, read_time BIGINT, write_time BIGINT, io_time BIGINT);

CREATE table kernel(hostname VARCHAR primary TAG, region VARCHAR TAG, datacenter VARCHAR TAG, rack VARCHAR TAG, os VARCHAR TAG, arch VARCHAR TAG, team VARCHAR TAG, service VARCHAR TAG, service_version VARCHAR TAG, service_environment VARCHAR TAG,time BIGINT,boot_time BIGINT, interrupts BIGINT, context_switches BIGINT, processes_forked BIGINT, disk_pages_in BIGINT, disk_pages_out BIGINT);

CREATE table net(hostname VARCHAR primary TAG, region VARCHAR TAG, datacenter VARCHAR TAG, rack VARCHAR TAG, os VARCHAR TAG, arch VARCHAR TAG, team VARCHAR TAG, service VARCHAR TAG, service_version VARCHAR TAG, service_environment VARCHAR TAG, interface VARCHAR TAG,time BIGINT, bytes_sent BIGINT, bytes_recv BIGINT, packets_sent BIGINT, packets_recv BIGINT, err_in BIGINT, err_out BIGINT, drop_in BIGINT, drop_out BIGINT );

CREATE table redis(hostname VARCHAR primary TAG, region VARCHAR TAG, datacenter VARCHAR TAG, rack VARCHAR TAG, os VARCHAR TAG, arch VARCHAR TAG, team VARCHAR TAG, service VARCHAR TAG, service_version VARCHAR TAG, service_environment VARCHAR TAG, port VARCHAR TAG, server VARCHAR TAG,time BIGINT, uptime_in_seconds BIGINT, total_connections_received BIGINT, expired_keys BIGINT, evicted_keys BIGINT, keyspace_hits BIGINT, keyspace_misses BIGINT, instantaneous_ops_per_sec BIGINT, instantaneous_input_kbps BIGINT, instantaneous_output_kbps BIGINT, connected_clients BIGINT, used_memory BIGINT, used_memory_rss BIGINT, used_memory_peak BIGINT, used_memory_lua BIGINT, rdb_changes_since_last_save BIGINT, sync_full BIGINT, sync_partial_ok BIGINT, sync_partial_err BIGINT, pubsub_channels BIGINT, pubsub_patterns BIGINT, latest_fork_usec BIGINT, connected_slaves BIGINT, master_repl_offset BIGINT, repl_backlog_active BIGINT, repl_backlog_size BIGINT, repl_backlog_histlen BIGINT, mem_fragmentation_ratio BIGINT, used_cpu_sys BIGINT, used_cpu_user BIGINT, used_cpu_sys_children BIGINT, used_cpu_user_children BIGINT);

CREATE table postgresl(hostname VARCHAR primary TAG, region VARCHAR TAG, datacenter VARCHAR TAG, rack VARCHAR TAG, os VARCHAR TAG, arch VARCHAR TAG, team VARCHAR TAG, service VARCHAR TAG, service_version VARCHAR TAG, service_environment VARCHAR TAG, time BIGINT,numbackends BIGINT, xact_commit BIGINT, xact_rollback BIGINT, blks_read BIGINT, blks_hit BIGINT, tup_returned BIGINT, tup_fetched BIGINT, tup_inserted BIGINT, tup_updated BIGINT, tup_deleted BIGINT, conflicts BIGINT, temp_files BIGINT, temp_bytes BIGINT, deadlocks BIGINT, blk_read_time BIGINT, blk_write_time BIGINT );

CREATE table nginx(hostname VARCHAR primary TAG, region VARCHAR TAG, datacenter VARCHAR TAG, rack VARCHAR TAG, os VARCHAR TAG, arch VARCHAR TAG, team VARCHAR TAG, service VARCHAR TAG, service_version VARCHAR TAG, service_environment VARCHAR TAG, port VARCHAR TAG, server VARCHAR TAG,time BIGINT,accepts BIGINT, active BIGINT, handled BIGINT, reading BIGINT, requests BIGINT, waiting BIGINT, writing BIGINT );
Sample INSERT statements
INSERT INTO cpu(hostname,region,datacenter,rack,os,arch,team,service,service_version,service_environment, time ,usage_user,usage_system,usage_idle,usage_nice,usage_iowait,usage_irq,usage_softirq,usage_steal,usage_guest,usage_guest_nice) VALUES ('host_0','ap-northeast-1','ap-northeast-1a','72','Ubuntu16.10','x86','CHI','10','0','test',1514764800000,60.4660287979619540,94.0509088045012476,66.4560053218490481,43.7714187186980155,42.4637497071265670,68.6823072867109374,6.5637019217476222,15.6519254732791246,9.6969518914484567,30.0911860585287059);
INSERT INTO diskio(hostname,region,datacenter,rack,os,arch,team,service,service_version,service_environment,serial, time ,`reads`,writes,read_bytes,write_bytes,read_time,write_time,io_time) VALUES ('host_0','ap-northeast-1','ap-northeast-1a','72','Ubuntu16.10','x86','CHI','10','0','test','694-511-162',1514764800000,0,0,3,0,0,7,0);
INSERT INTO disk(hostname,region,datacenter,rack,os,arch,team,service,service_version,service_environment,path,fstype, time ,total,`free`,used,used_percent,inodes_total,inodes_free,inodes_used) VALUES ('host_0','ap-northeast-1','ap-northeast-1a','72','Ubuntu16.10','x86','CHI','10','0','test','/dev/sda9','ext4',1514764800000,1099511627776,549755813888,549755813888,50,268435456,134217728,134217728);
INSERT INTO kernel(hostname,region,datacenter,rack,os,arch,team,service,service_version,service_environment, time ,boot_time,interrupts,context_switches,processes_forked,disk_pages_in,disk_pages_out) VALUES ('host_0','ap-northeast-1','ap-northeast-1a','72','Ubuntu16.10','x86','CHI','10','0','test',1514764800000,233,0,1,0,0,0);
INSERT INTO mem(hostname,region,datacenter,rack,os,arch,team,service,service_version,service_environment, time ,total,available,used,`free`,cached,buffered,used_percent,available_percent,buffered_percent) VALUES ('host_0','ap-northeast-1','ap-northeast-1a','72','Ubuntu16.10','x86','CHI','10','0','test',1514764800000,8589934592,6072208808,2517725783,5833292948,1877356426,2517725783,29.3101857336815748,70.6898142663184217,78.1446947407235797);
INSERT INTO net(hostname,region,datacenter,rack,os,arch,team,service,service_version,service_environment,interface, time ,bytes_sent,bytes_recv,packets_sent,packets_recv,err_in,err_out,drop_in,drop_out) VALUES ('host_0','ap-northeast-1','ap-northeast-1a','72','Ubuntu16.10','x86','CHI','10','0','test','eth3',1514764800000,0,0,0,2,0,0,0,0);
INSERT INTO nginx(hostname,region,datacenter,rack,os,arch,team,service,service_version,service_environment,port,server, time ,accepts,active,handled,reading,requests,waiting,writing) VALUES ('host_0','ap-northeast-1','ap-northeast-1a','72','Ubuntu16.10','x86','CHI','10','0','test','12552','nginx_65466',1514764800000,0,0,11,0,0,0,0);
INSERT INTO postgresl(hostname,region,datacenter,rack,os,arch,team,service,service_version,service_environment, time ,numbackends,xact_commit,xact_rollback,blks_read,blks_hit,tup_returned,tup_fetched,tup_inserted,tup_updated,tup_deleted,conflicts,temp_files,temp_bytes,deadlocks,blk_read_time,blk_write_time) VALUES ('host_0','ap-northeast-1','ap-northeast-1a','72','Ubuntu16.10','x86','CHI','10','0','test',1514764800000,0,0,0,0,3,0,0,0,0,0,0,0,12,0,0,0);
INSERT INTO redis(hostname,region,datacenter,rack,os,arch,team,service,service_version,service_environment,port,server, time ,uptime_in_seconds,total_connections_received,expired_keys,evicted_keys,keyspace_hits,keyspace_misses,instantaneous_ops_per_sec,instantaneous_input_kbps,instantaneous_output_kbps,connected_clients,used_memory,used_memory_rss,used_memory_peak,used_memory_lua,rdb_changes_since_last_save,sync_full,sync_partial_ok,sync_partial_err,pubsub_channels,pubsub_patterns,latest_fork_usec,connected_slaves,master_repl_offset,repl_backlog_active,repl_backlog_size,repl_backlog_histlen,mem_fragmentation_ratio,used_cpu_sys,used_cpu_user,used_cpu_sys_children,used_cpu_user_children) VALUES ('host_0','ap-northeast-1','ap-northeast-1a','72','Ubuntu16.10','x86','CHI','10','0','test','19071','redis_86258',1514764800000,0,0,0,5,0,0,0,0,0,8589934592,8589934592,8589934592,8589934592,0,0,0,0,36,0,0,0,0,0,0,0,0,0,16,0,0);
All writes use batch INSERT with PreparedStatement to maximize throughput. For guidance on efficient write patterns, see Write data in an efficient manner.
Metrics
| Metric | Definition |
|---|---|
tps | Average field values written per second. In LindormTSDB, TPS counts individual field values (not rows or transactions). |
worker | Number of concurrent write threads. |
batch | Number of rows included in each write request. |
max_cpu | Peak CPU utilization across all nodes during the test, as a percentage. |
Test results
All four clusters use 3 nodes. Results are from a write-only environment with no concurrent queries.
Figure 1: Write TPS at batch=500 across cluster sizes and concurrency levels
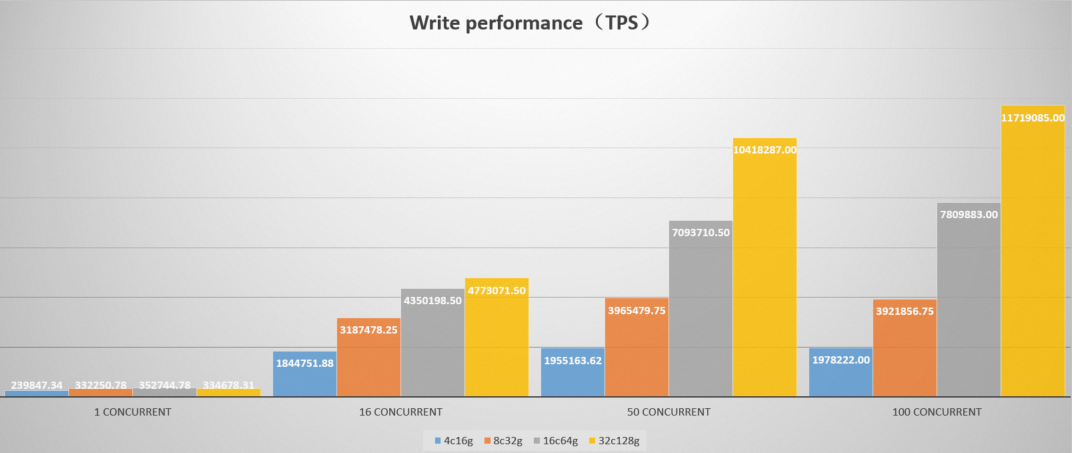
Table 1: Cluster 1 — 3 nodes x 4 cores, 16 GB memory
| batch | worker | tps | max_cpu |
|---|---|---|---|
| 1 | 1 | 4,846.48 | 36.68 |
| 1 | 16 | 36,862.15 | 78.50 |
| 1 | 50 | 31,653.44 | 73.46 |
| 1 | 100 | 31,521.71 | 74.32 |
| 1 | 200 | 31,651.03 | 73.03 |
| 50 | 1 | 126,462.85 | 65.43 |
| 50 | 16 | 460,032.75 | 79.89 |
| 50 | 50 | 457,791.78 | 81.50 |
| 50 | 100 | 457,956.53 | 82.69 |
| 50 | 200 | 434,573.47 | 81.18 |
| 100 | 1 | 168,643.80 | 74.14 |
| 100 | 16 | 468,008.25 | 84.09 |
| 100 | 50 | 470,608.31 | 84.34 |
| 100 | 100 | 451,384.44 | 83.32 |
| 100 | 200 | 457,740.22 | 84.61 |
| 200 | 1 | 205,046.31 | 74.77 |
| 200 | 16 | 480,309.56 | 84.74 |
| 200 | 50 | 489,903.34 | 86.73 |
| 200 | 100 | 484,745.44 | 86.77 |
| 200 | 200 | 475,824.97 | 86.55 |
| 500 | 1 | 239,847.34 | 74.76 |
| 500 | 16 | 511,989.50 | 87.86 |
| 500 | 50 | 544,544.75 | 88.23 |
| 500 | 100 | 543,131.56 | 88.12 |
| 500 | 200 | 528,027.12 | 88.57 |
Table 2: Cluster 2 — 3 nodes x 8 cores, 32 GB memory
| batch | worker | tps | max_cpu |
|---|---|---|---|
| 1 | 1 | 3,601.72 | 19.88 |
| 1 | 16 | 46,701.05 | 46.97 |
| 1 | 50 | 69,892.66 | 59.77 |
| 1 | 100 | 70,219.33 | 60.32 |
| 1 | 200 | 70,187.81 | 60.54 |
| 50 | 1 | 114,062.01 | 22.88 |
| 50 | 16 | 1,123,739.88 | 64.66 |
| 50 | 50 | 1,416,314.00 | 70.99 |
| 50 | 100 | 1,421,701.75 | 70.94 |
| 50 | 200 | 1,422,040.12 | 71.56 |
| 100 | 1 | 183,456.98 | 22.38 |
| 100 | 16 | 1,651,046.25 | 65.09 |
| 100 | 50 | 2,029,514.75 | 74.16 |
| 100 | 100 | 2,040,670.38 | 73.39 |
| 100 | 200 | 2,025,066.12 | 73.98 |
| 200 | 1 | 254,914.23 | 24.27 |
| 200 | 16 | 2,172,662.25 | 71.47 |
| 200 | 50 | 2,670,999.25 | 76.47 |
| 200 | 100 | 2,674,582.25 | 76.95 |
| 200 | 200 | 2,693,531.50 | 76.41 |
| 500 | 1 | 332,250.78 | 23.86 |
| 500 | 16 | 2,820,651.50 | 72.56 |
| 500 | 50 | 3,429,375.00 | 80.98 |
| 500 | 100 | 3,442,593.75 | 80.62 |
| 500 | 200 | 3,440,201.50 | 81.12 |
Table 3: Cluster 3 — 3 nodes x 16 cores, 64 GB memory
| batch | worker | tps | max_cpu |
|---|---|---|---|
| 1 | 1 | 3,897.79 | 8.97 |
| 1 | 16 | 58,217.44 | 27.30 |
| 1 | 50 | 127,110.89 | 50.49 |
| 1 | 100 | 165,754.09 | 62.31 |
| 1 | 200 | 202,844.20 | 70.72 |
| 50 | 1 | 136,378.39 | 11.77 |
| 50 | 16 | 1,634,203.88 | 41.92 |
| 50 | 50 | 2,773,785.75 | 58.96 |
| 50 | 100 | 3,363,458.25 | 67.87 |
| 50 | 200 | 3,703,033.00 | 74.14 |
| 100 | 1 | 198,375.67 | 10.35 |
| 100 | 16 | 2,494,268.00 | 45.86 |
| 100 | 50 | 4,007,320.25 | 60.87 |
| 100 | 100 | 4,753,680.50 | 69.29 |
| 100 | 200 | 5,095,771.00 | 75.17 |
| 200 | 1 | 278,253.53 | 10.57 |
| 200 | 16 | 3,368,596.50 | 45.48 |
| 200 | 50 | 5,214,060.50 | 64.57 |
| 200 | 100 | 6,040,166.50 | 72.35 |
| 200 | 200 | 6,283,312.00 | 77.07 |
| 500 | 1 | 352,744.78 | 10.80 |
| 500 | 16 | 4,281,761.50 | 47.17 |
| 500 | 50 | 6,544,214.00 | 71.73 |
| 500 | 100 | 7,267,295.50 | 77.15 |
| 500 | 200 | 7,290,116.00 | 83.91 |
Table 4: Cluster 4 — 3 nodes x 32 cores, 128 GB memory
| batch | worker | tps | max_cpu |
|---|---|---|---|
| 1 | 1 | 3,405.32 | 4.52 |
| 1 | 16 | 51,460.87 | 11.04 |
| 1 | 50 | 134,289.62 | 27.32 |
| 1 | 100 | 201,014.75 | 40.45 |
| 1 | 200 | 255,692.84 | 51.99 |
| 50 | 1 | 113,644.64 | 5.33 |
| 50 | 16 | 1,596,669.88 | 19.13 |
| 50 | 50 | 3,676,491.50 | 38.75 |
| 50 | 100 | 5,217,282.50 | 50.84 |
| 50 | 200 | 6,345,112.00 | 62.49 |
| 100 | 1 | 188,352.08 | 5.05 |
| 100 | 16 | 2,624,622.50 | 21.15 |
| 100 | 50 | 5,740,561.50 | 40.49 |
| 100 | 100 | 7,521,672.00 | 55.85 |
| 100 | 200 | 8,507,855.00 | 61.68 |
| 200 | 1 | 249,571.77 | 5.05 |
| 200 | 16 | 3,637,803.50 | 21.23 |
| 200 | 50 | 8,141,380.50 | 45.39 |
| 200 | 100 | 10,289,145.00 | 57.85 |
| 200 | 200 | 10,462,525.00 | 60.48 |
| 500 | 1 | 334,678.31 | 5.47 |
| 500 | 16 | 4,657,772.50 | 24.23 |
| 500 | 50 | 10,098,200.00 | 46.90 |
| 500 | 100 | 12,405,648.00 | 64.57 |
| 500 | 200 | 12,136,903.00 | 66.01 |
What's next
Write data in an efficient manner — batch insert patterns and PreparedStatement usage
Data model — tags, fields, and data point definitions