Query Insight combines slow query logs with the hg_table_info system table to give you a complete picture of any query's behavior — resource consumption, table metadata, execution plan, and lock activity. Use it to diagnose slow queries, investigate failures, and determine whether DDL conflicts or table locks caused a query to fail.
Prerequisites
Before you begin, ensure that you have:
Logged on to a Hologres instance. For details, see Log on to an instance
The permissions required to query slow query logs. For details, see Slow query log viewing and analysis
Data collection thresholds
Query Insight draws from two data sources, each with its own collection rules. Review these thresholds before querying so you know when data will be available.
| Data | Collection rule | Notes |
|---|---|---|
| DML statements | Running time > 100 ms | Default slow query log threshold |
| DDL statements | All DDL statements collected | Only statements with running time > 1 s appear in search results |
| Execution plans | Running time > 10 s | Plans are taken from the Plan field in slow query logs |
| Table metadata | Collected once every morning | Data is available on T+1 (next day); tables created today are queryable tomorrow |
| DDL Conflict Analysis | Checks 1-minute window before and after query execution | — |
Access Query Insight
Access Query Insight Directly
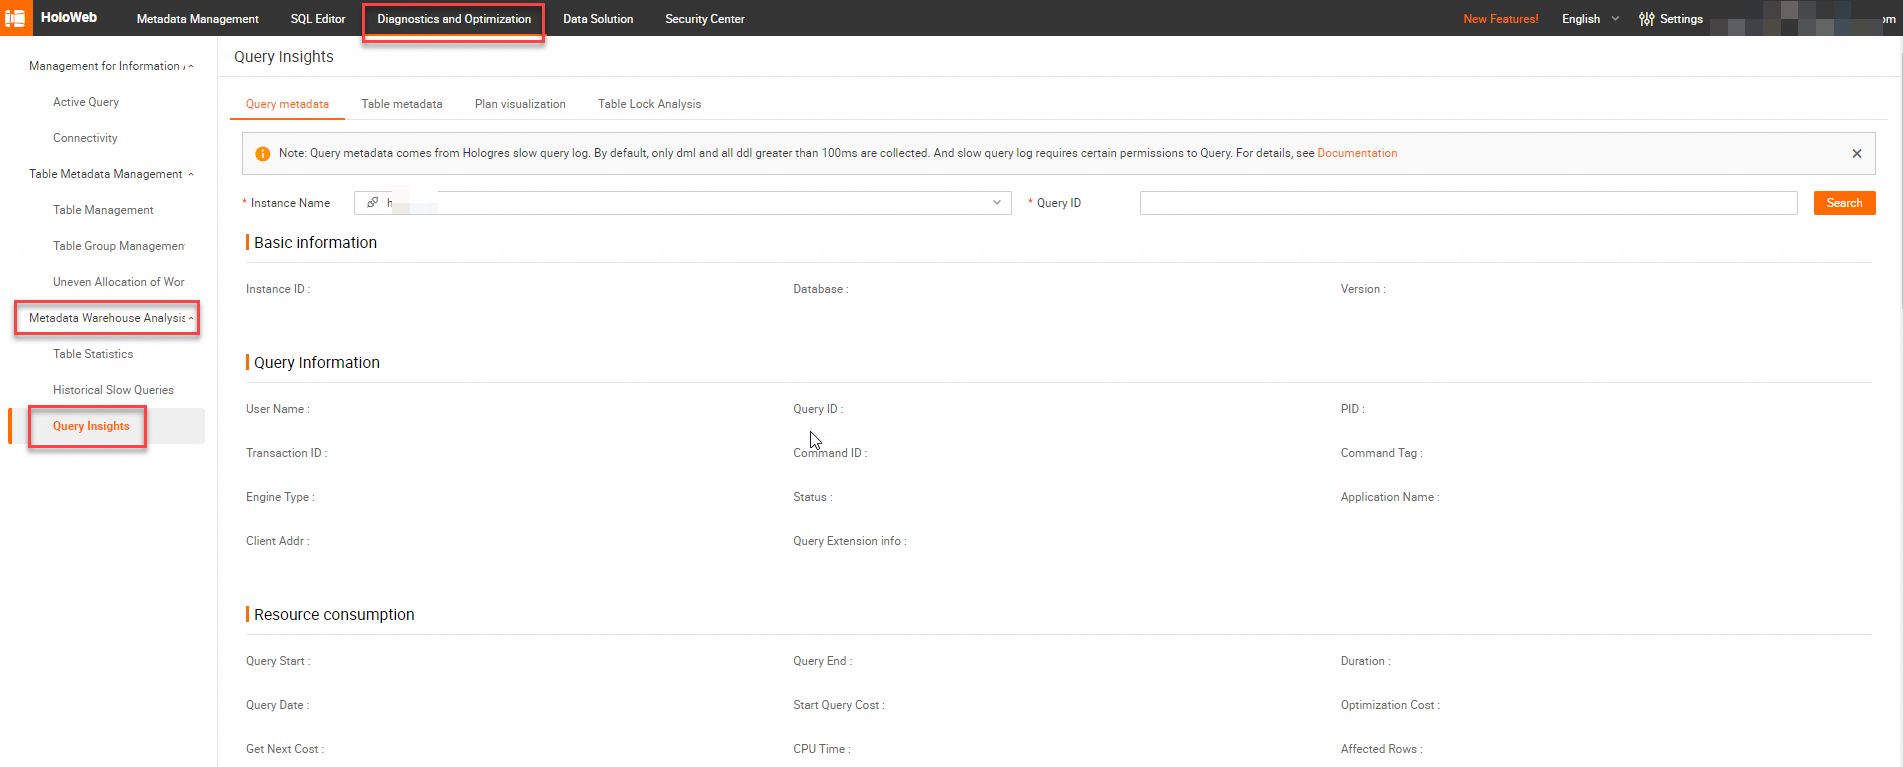
Query Insight is available from three locations in HoloWeb. On the Query Insight page, you can view Query Metadata and Table Metadata, and perform Plan Visualization and Table Lock Analysis.
Access directly from Diagnostics and Optimization:
Log on to the Hologres Management Console.
In the left navigation pane of the top menu bar, select the target region.
Click Go to HoloWeb.
In the top menu, select Diagnostics and Optimization. Then, in the left navigation pane, click Metadata Warehouse Analysis > Query Insight.
Navigate to Query Insight
Navigate from the SQL Editor:
In the HoloWeb SQL Editor, any SQL statement with a running time greater than 1 s that contains a Query ID shows a link to Query Insight. Click the link to open the query directly in Query Insight.
Navigate from Historical Slow Queries:
In the query list on the Historical Slow Queries page, click the ![]() icon in the Actions column for the target query to go to Query Insight.
icon in the Actions column for the target query to go to Query Insight.
Query Metadata
Query metadata is sourced from Hologres slow query logs. On the Query Metadata tab, select the Instance Name and Query ID, then click Search.
The tab displays the following sections:
Basic information
Shows the instance ID, database, and Milvus version for the query.
Query information
Shows the user, execution status, and execution engine used for the query, as collected from slow query logs.
Resource consumption
Shows resource usage during query execution from slow query logs, including scan functions and CPU consumption.
Other information
Shows additional metadata from slow query logs, such as the client IP address.
SQL
Shows the full SQL statement. Use the format option for a more readable view, or copy the statement directly.
Query details
If the query ran with parameters, this section shows the specific parameter values. Merge the parameters into the SQL statement if needed.
Execution plan
Shows the execution plan from the Plan field in slow query logs.
Execution plans are collected only for queries with a running time greater than 10 s.
Use the plan visualization feature to view a graphical representation of the plan. For background on reading execution plans, see EXPLAIN and EXPLAIN ANALYZE.
Statistics
Shows operator-level consumption data from the Statistics field in slow query logs, including the number of scanned rows and the running time for each operator. Use this data to identify which operators are consuming the most resources.
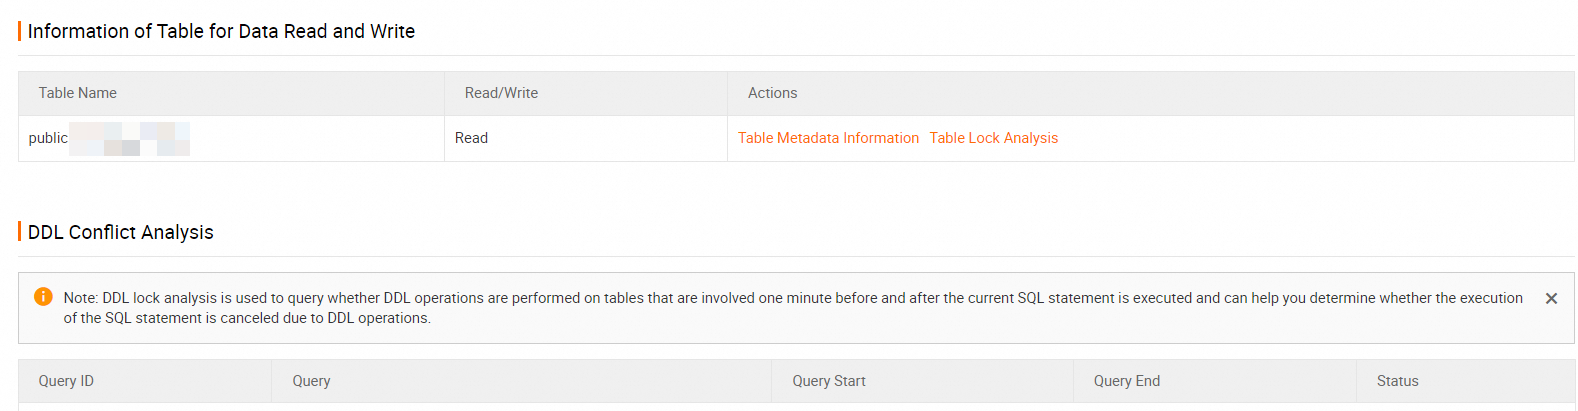
Read/Write table information
Lists the tables read from or written to by the query. Click either link to navigate to additional analysis:
Table Metadata: Opens the Table Metadata page for the selected table. Table metadata comes from the
hg_table_infotable and is updated on a T+1 basis — tables created today are not queryable until tomorrow.Table Lock Analysis: Opens the Table Lock Analysis page to check whether the query holds any data manipulation language (DML)-related locks. This is useful when a query with a fixed plan slows down due to concurrent DML operations from the Hologres execution engine (HQE).
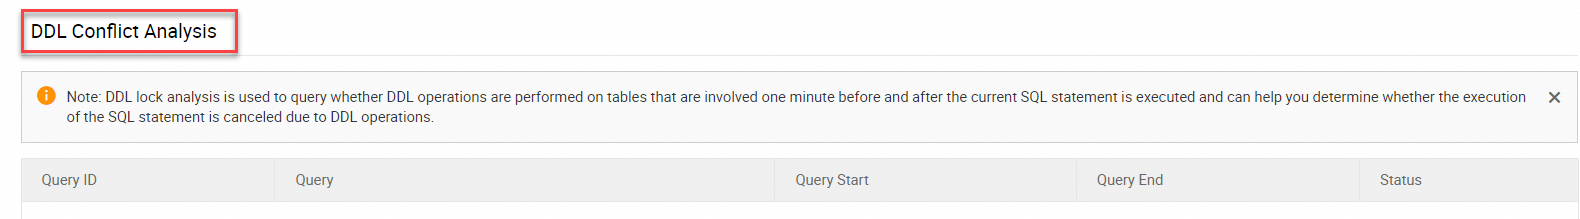
DDL Conflict Analysis
Shows whether the tables involved in the query had data definition language (DDL) operations within one minute before or after the query's execution time. If the query failed with the error message Query is canceled, this section helps you confirm whether a DDL conflict caused the failure.
Error messages
If the query failed, the error details appear here. Query Insight on HoloWeb automatically adds failure causes and suggested fixes to help you resolve SQL errors. For a reference of common SQL failures, see FAQ for Hologres SQL statements.
Table Metadata
Table metadata comes from the hg_table_info system table, which is updated once every morning. Data is available on a T+1 basis.
Navigate to Table Metadata by clicking the Table Metadata link in the Read/Write Table Information section of Query Metadata, or enter the instance name, database, schema, and metadata collection time directly.
The tab displays the following sections:
Basic information: Table name, whether the table is partitioned, and partition details.
Table Metadata Information: Table creation time, metadata collection time, and storage capacity.
Table Property Information: Indexes set on the table, including the primary key (PK) and distribution key.
Table Schema Information: Fields, field types, nullability, and default values.
Plan visualization
Plan Visualization displays the Plan field from slow query logs as a graphical execution plan.
Plan data is collected only for queries that run for more than 10 s.
Where to start: Check the Statistics section in Query Metadata first. It shows operator-level row counts and running times, so you can identify the most resource-intensive operators before exploring the full plan graph.
For reference on execution plan concepts, see EXPLAIN and EXPLAIN ANALYZE.
Table lock analysis
Table Lock Analysis checks whether the query generated DML operations (INSERT, UPDATE, or DELETE) in the Hologres execution engine (HQE). A lock is present when a table has both SDK or HQE read queries and HQE DML queries running at the same time.
Table Lock Analysis detects only DML-related locks, not DDL locks.
If lock contention is detected, avoid running SDK queries and HQE DML operations against the same table concurrently.
Troubleshooting
Error: relation with OID xxx does not exist
This error occurs when a table involved in the query was subject to a TRUNCATE or DROP operation, which changed the table's object identifier (OID).
To investigate: Enter the Query ID in Query Insight and check the DDL Conflict Analysis section to confirm whether DDL locks existed at the time of the query.
Error: query is canceled
This error occurs when tables involved in the query underwent DDL operations — such as TRUNCATE or DROP — while the query was executing.
To investigate: Enter the Query ID in Query Insight. On the Query Metadata tab, open the DDL Conflict Analysis section to view the DDL operations on the affected table.
High latency for SDK SQL statements
If an SDK SQL statement takes unexpectedly long, check for lock contention.
To investigate: In the Read/Write Table Information section, click Table Lock Analysis.
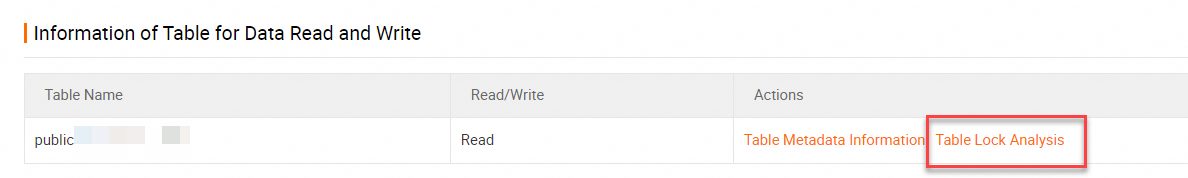
If the analysis shows a concurrent DML statement from HQE, the HQE DML operation acquired a table lock, causing the SDK query to wait. Avoid running both operation types against the same table at the same time.
If no HQE DML operations are found, the latency is not caused by table locks. See Optimize write and update performance
Error: Dispatch query failed: The shards are incomplete
This error indicates that one or more shards in the Hologres instance have entered an inconsistent state, typically as a result of a coredump. This issue is caused by a software defect in older versions (such as r4.1.10) and is not related to connection count issues.
To resolve this issue, upgrade your Hologres instance to version 4.1.12 or later. We recommend upgrading to version 4.1.18 or later for the best stability. For instructions, see Upgrade the instance version.