This topic describes how to add and use a MaxCompute data source in Managed Service for Grafana.
Step 1: Log on to Grafana
Log on to the Managed Service for Grafana console. In the left-side navigation pane, click Workspace Management.
On the Workspace Management page, find the workspace that you want to manage and click the URL in the URL column to go to Grafana.
NoteYou can log on to Grafana with the administrator account of Grafana and the password that you configured when you created the workspace. You can also click Sign in with Alibaba Cloud to log on to Grafana with the current Alibaba Cloud account.
Step 2: Add a MaxCompute data source
Grafana 9.x
In the left-side navigation pane of Grafana, choose
 > Add data source.
 On the Add data source page, enter MaxCompute(ODPS) in the search box. Then, select MaxCompute(ODPS) from the search results.
On the Settings tab, configure the parameters that are described in the following table.
Parameter
Description
Name
The name of the data source.
Endpoint
The endpoint of the MaxCompute project. You must configure this parameter based on the region and network connection type that you select when you create the MaxCompute project. For more information about the endpoints of different network types in each region, see Endpoints.
ImportantIf you specify an invalid endpoint, an error occurs when you access the MaxCompute project.
Default Project
The name of the MaxCompute project that you want to access. If you create a workspace in standard mode, take note of the differences in the project names between the production environment and development environment when you configure the Default Project parameter. The name of the project for the development environment ends with _dev. For more information, see Differences between workspaces in basic mode and workspaces in standard mode. You can log on to the MaxCompute console , choose in the left-side navigation pane and obtain the name of the MaxCompute project on the Projects page.
AccessKeyId
The AccessKey ID of your Alibaba Cloud account or a Resource Access Management (RAM) user within the Alibaba Cloud account. You can obtain the AccessKey ID from the AccessKey Pair page.
AccessKeySecret
The AccessKey secret that corresponds to the AccessKey ID. After you create an AccessKey pair, you cannot view the AccessKey secret of the AccessKey pair by using the console. We recommend that you keep the AccessKey secret strictly confidential. For more information, see Obtain an AccessKey pair.
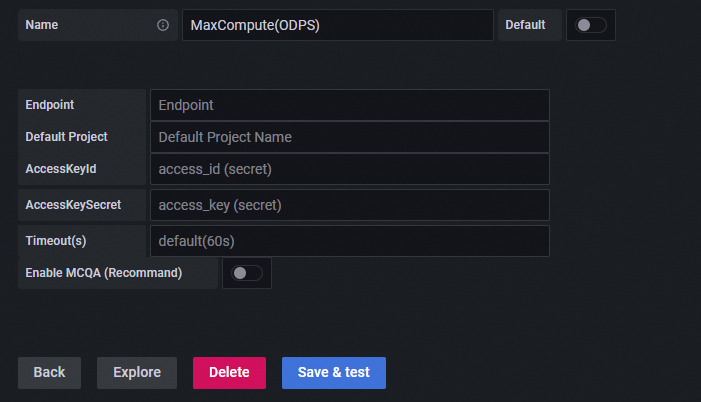
Click Save & test.
If the
Database Connection OKmessage appears, the MaxCompute data source is added to Managed Service for Grafana.ImportantWe recommend that you use a read-only account with fewer permissions. Otherwise, your server may be exposed to security risks.
Grafana 10.x
On the Grafana homepage, click the
 icon.
icon. In the left-side navigation pane, choose .
On the Data sources tab, click + Add data source.
On the Add data source page, enter MaxCompute(ODPS) in the search box. Then, select MaxCompute(ODPS) from the search results.
On the Settings tab, configure the parameters that are described in the following table.
Parameter
Description
Name
The name of the data source.
Endpoint
The endpoint of the MaxCompute project. You must configure this parameter based on the region and network connection type that you select when you create the MaxCompute project. For more information about the endpoints of different network types in each region, see Endpoints.
ImportantIf you specify an invalid endpoint, an error occurs when you access the MaxCompute project.
Default Project
The name of the MaxCompute project that you want to access. If you create a workspace in standard mode, take note of the differences in the project names between the production environment and development environment when you configure the Default Project parameter. The name of the project for the development environment ends with _dev. For more information, see Differences between workspaces in basic mode and workspaces in standard mode. You can log on to the MaxCompute console , choose in the left-side navigation pane and obtain the name of the MaxCompute project on the Projects page.
AccessKeyId
The AccessKey ID of your Alibaba Cloud account or a Resource Access Management (RAM) user within the Alibaba Cloud account. You can obtain the AccessKey ID from the AccessKey Pair page.
AccessKeySecret
The AccessKey secret that corresponds to the AccessKey ID. After you create an AccessKey pair, you cannot view the AccessKey secret of the AccessKey pair by using the console. We recommend that you keep the AccessKey secret strictly confidential. For more information, see Obtain an AccessKey pair.
Click Save & test.
If the
Database Connection OKmessage appears, the MaxCompute data source is added to Managed Service for Grafana.ImportantWe recommend that you use a read-only account with fewer permissions. Otherwise, your server may be exposed to security risks.
Step 3: Use the data source to create a dashboard
This section describes how to create a dashboard panel of the table type and a time series chart on the dashboard for MaxCompute data.
The following table describes the sample MaxCompute data.
Serial number (ID) | City (place) | User (user) | Operation (operate) | Operation time (operate_time) | Number of occurrences (count) |
1 | China (Hangzhou) | User A | Browse | 0:00 on July 20, 2022 | 3 |
2 | China (Hangzhou) | User A | Browse | 1:00 on July 20, 2022 | 8 |
3 | China (Hangzhou) | User A | Browse | 2:00 on July 20, 2022 | 13 |
11 | China (Beijing) | User A | Browse | 0:00 on July 20, 2022 | 23 |
12 | China (Beijing) | User B | Browse | 1:00 on July 20, 2022 | 18 |
13 | China (Beijing) | User B | Browse | 2:00 on July 20, 2022 | 3 |
21 | China (Beijing) | User C | Browse | 0:00 on July 20, 2022 | 13 |
22 | China (Beijing) | User C | Browse | 1:00 on July 20, 2022 | 22 |
23 | China (Beijing) | User C | Browse | 2:00 on July 20, 2022 | 23 |
Create a dashboard panel of the table type
Grafana 9.x
In the left-side navigation pane of Grafana, choose
 > New dashboard.
 On the New dashboard page, click Add a new panel.
On the Visualizations tab that is on the right side of the Edit Panel page, select Table as the chart type.
On the Query tab, select the data source that you add in Step 2.
Construct SQL statements in Builder or Code mode. In this example, the Code mode is used.
SELECT
  id AS "Serial number",
  place AS "City",
  user AS "User",
  operate AS "Operation",
  count AS "Number of occurrences",
  operate_time AS "Operation time"
FROM action_log;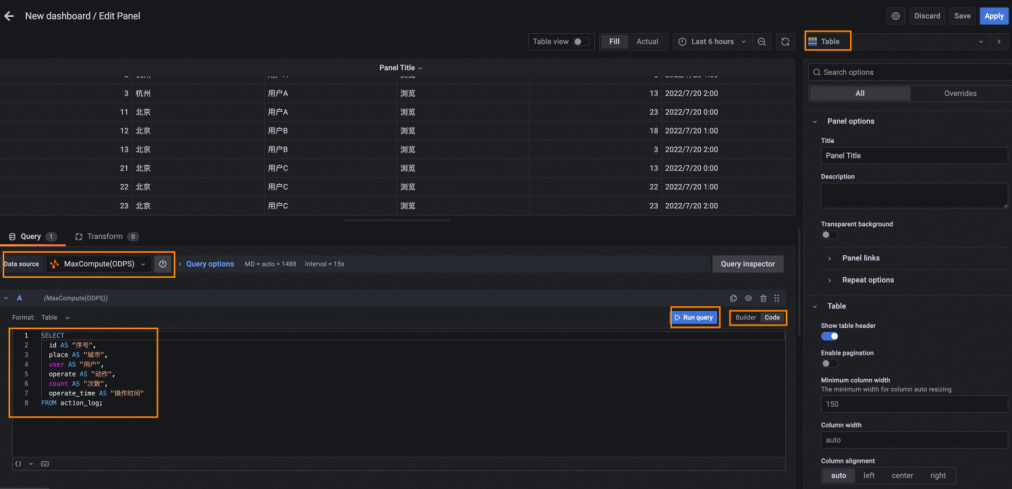
After you complete the preceding steps, click Run query. Then, click Apply.
Grafana 10.x
On the Grafana homepage, click the
icon. In the left-side navigation pane, click Dashboards. On the page that appears, select New dashboard from the New drop-down list.
On the New dashboard page, click + Add visualization.
On the right side of the Select data source dialog box, select the data source that you add in Step 2.
On the Edit panel page, construct SQL statements in Builder or Code mode. In this example, the Code mode is used.
SELECT
  id AS "Serial number",
  place AS "City",
  user AS "User",
  operate AS "Operation",
  count AS "Number of occurrences",
  operate_time AS "Operation time"
FROM action_log;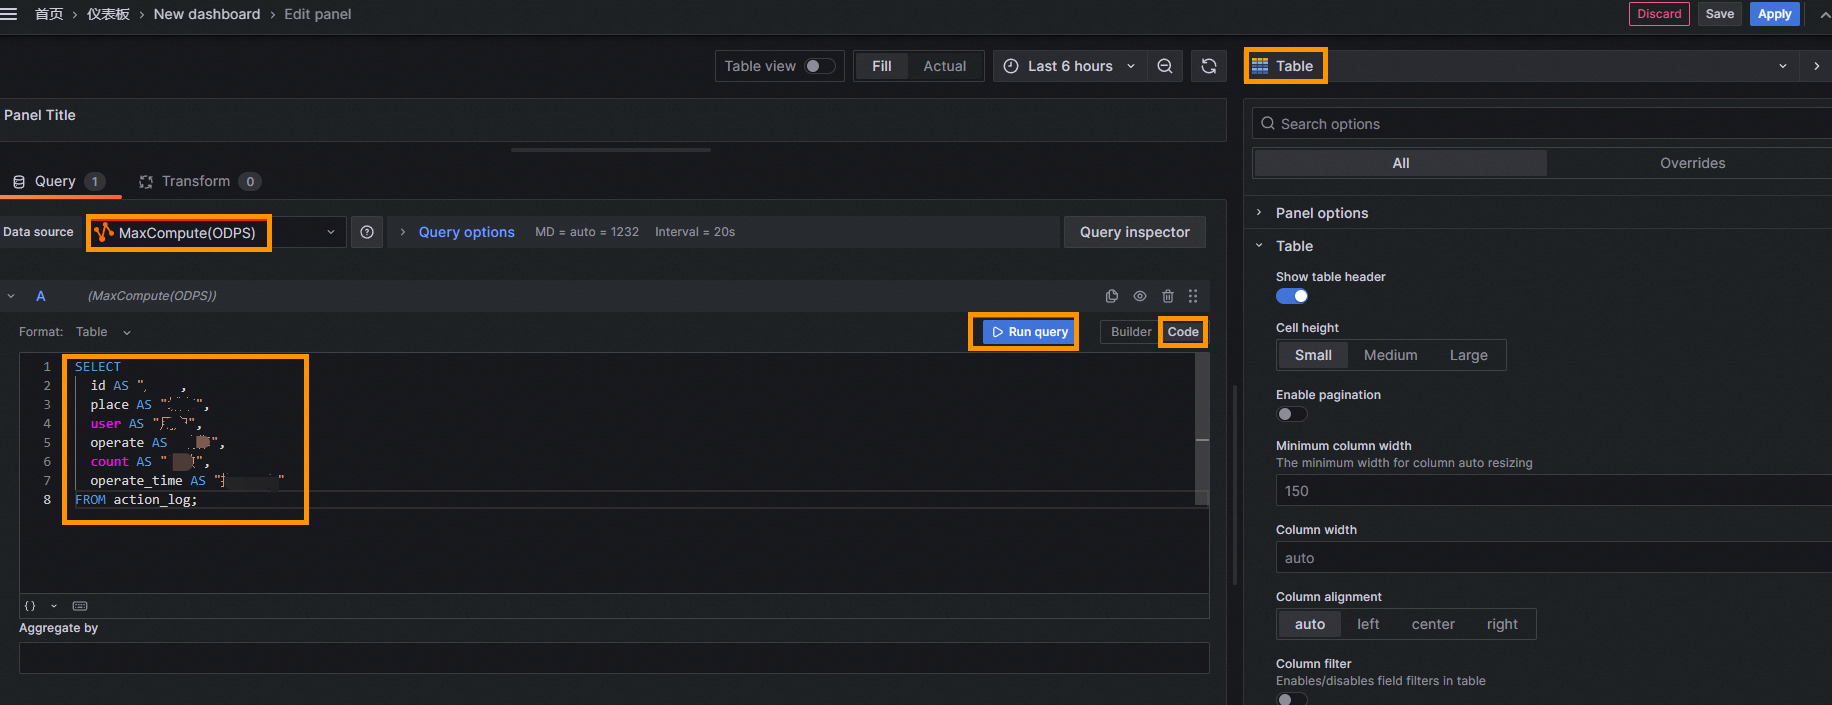
After you complete the preceding steps, click Run query. Then, click Apply.
Create a time series chart
Grafana 9.x
In the upper-right corner of the dashboard, click the
 icon, and then click Add a new panel.
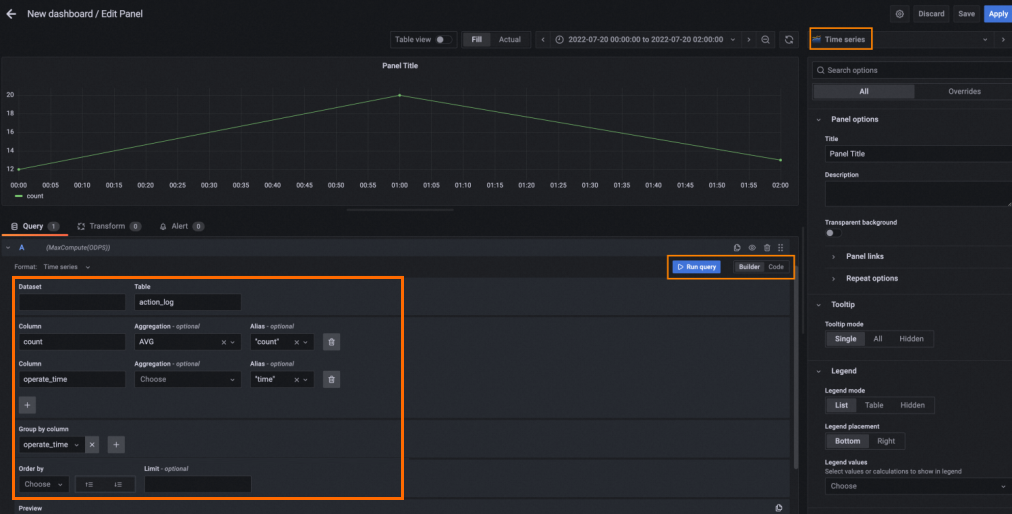
 On the Visualizations tab that is on the right side of the Edit Panel page, select Time series as the chart type.
On the Query tab, select the data source that you add in Step 2.
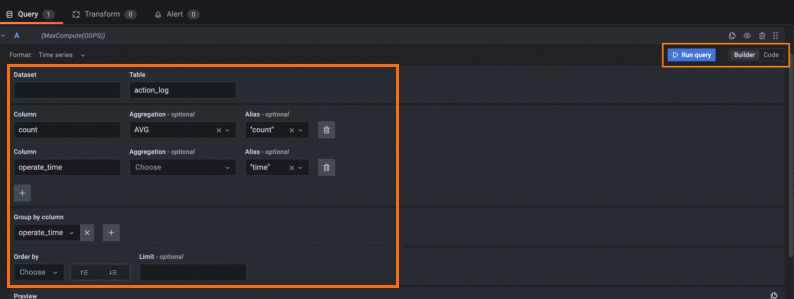
Configure the following query parameters in the A section. Then, click Run query. In this example, the Builder mode is used.
Parameter
Description
Dataset
The project to which the table belongs. If you leave this parameter empty, the default project is used.
Table
The name of the table. In this example, the action_log table is used.
Column
The columns that you want to use to generate the chart. You can also configure the Aggregation and Alias parameters. In this example, two columns are specified: the count column whose Aggregation parameter is set to AVG and Alias parameter is set to count, and the operate_time column whose Alias parameter is set to time.
Group by column, Order by, and Limit
Configure these parameters based on the SQL statements that you want to construct.
NoteIf you want to perform more operations, use the Code mode.
Optional. On the Visualizations tab that is on the right side of the Edit Panel page, select Bar chart as the chart type to display data in a bar chart.
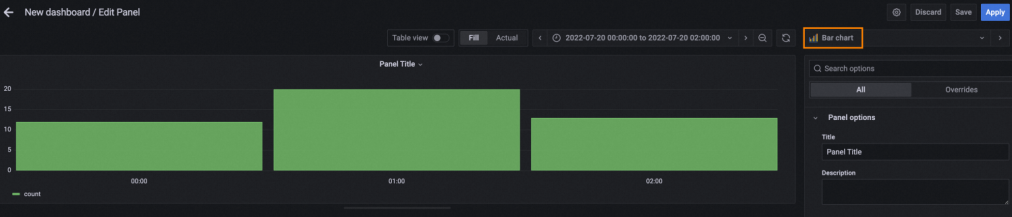
After you complete the preceding steps, click Apply in the upper-right corner of the Edit Panel page.
If you want to group the preceding data by user and display the data by using multiple curves in the time series chart, refer to the following query statement or configurations. In this example, the preceding sample MaxCompute data is used.
SELECT
  SUM(count) AS "count",
  user AS "user",
  to_date(operate_time,"yyyy/mm/dd hh:mi") AS "time"
FROM
  action_log
WHERE
  user is not null
GROUP BY
  user,
  time
ORDER BY
  operate_time
LIMIT
  50;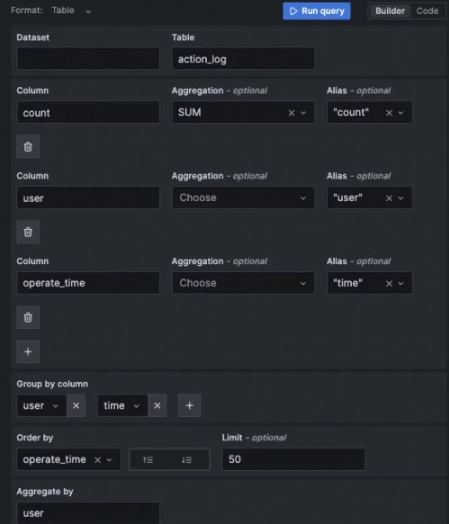
Grafana 10.x
In the upper-right corner of the dashboard, click Add. Then, select Visualization from the drop-down list.
On the Visualizations tab that is on the right side of the Edit Panel page, select Time series as the chart type.
On the Query tab of the Edit panel page, select the data source that you add in Step 2.
Configure the following query parameters in the A section. Then, click Run query. In this example, the Builder mode is used.
Parameter
Description
Dataset
The project to which the table belongs. If you leave this parameter empty, the default project is used.
Table
The name of the table. In this example, the action_log table is used.
Column
The columns that you want to use to generate the chart. You can also configure the Aggregation and Alias parameters. In this example, two columns are specified: the count column whose Aggregation parameter is set to AVG and Alias parameter is set to count, and the operate_time column whose Alias parameter is set to time.
Group by column, Order by, and Limit
Configure these parameters based on the SQL statements that you want to construct.
If you want to perform more operations, use the Code mode.
Optional. On the Visualizations tab that is on the right side of the Edit Panel page, select Bar chart as the chart type to display data in a bar chart.

After you complete the preceding steps, click Apply in the upper-right corner of the Edit Panel page.
If you want to group the preceding data by user and display the data by using multiple curves in the time series chart, refer to the following query statement or configurations. In this example, the preceding sample MaxCompute data is used.
SELECT
  SUM(count) AS "count",
  user AS "user",
  to_date(operate_time,"yyyy/mm/dd hh:mi") AS "time"
FROM
  action_log
WHERE
  user is not null
GROUP BY
  user,
  time
ORDER BY
  operate_time
LIMIT
  50;