This topic describes how to add an Alibaba Cloud API data source in Grafana and how to configure related parameters. Alibaba Cloud provides the APIs of cloud services. You can call APIs to manage and query resources in an easy manner. The most common use scenario of Grafana is to call APIs of cloud services to obtain and display data.
Prerequisites
The Grafana version is 9.0.x or later.
The Alibaba Cloud OpenAPI plugin is installed.
NoteManaged Service for Grafana V9.0.x or later: The Alibaba Cloud OpenAPI plugin is installed by default.
Self-managed Grafana: You must install the Alibaba Cloud OpenAPI plugin at OpenAPI.
A Resource Access Management (RAM) user is created and authorized to call APIs. An AccessKey pair of the RAM user is obtained.
Step 1: Log on to Grafana
Log on to the Managed Service for Grafana console. In the left-side navigation pane, click Workspace Management.
On the Workspace Management page, find the workspace that you want to manage and click the URL in the URL column to go to Grafana.
NoteYou can log on to Grafana with the administrator account of Grafana and the password that you configured when you created the workspace. You can also click Sign in with Alibaba Cloud to log on to Grafana with the current Alibaba Cloud account.
Step 2: Add an API data source
Grafana 9.0.x
In the left-side navigation bar, move the pointer over the
 icon and click Data sources.
 On the Data sources tab, click Add data source.
On the Add data source page, enter OpenAPI in the search box and click OpenAPI in the search result.
On the page that appears, configure the parameters and click Save & test.
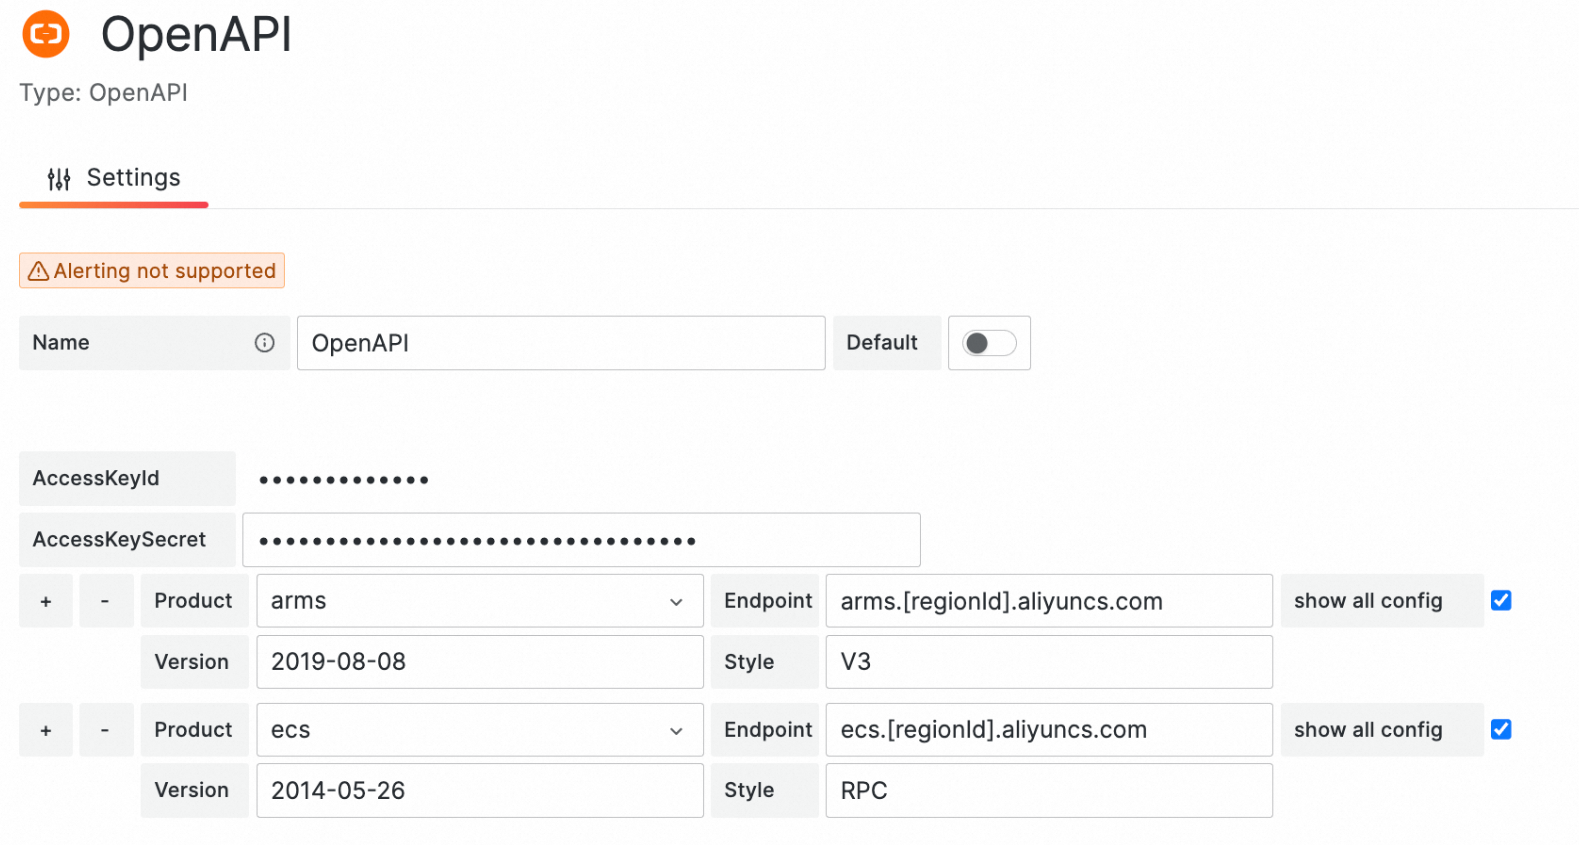
Parameter
Description
Name
The name of the data source. You can specify a custom name.
AccessKeyId
AccessKeySecret
AccessKeyId: the AccessKey ID of the RAM user that is authorized to call the API. For information about how to view AccessKey IDs, see View the information about AccessKey pairs of a RAM user.
AccessKeySecret: the AccessKey secret of the RAM user that is authorized to call the API. AccessKey secrets are not displayed in the console. After you create a RAM user, you must save the AccessKey secret of the RAM user.
Product
The name of the cloud service. You can select a name from the drop-down list or enter a name in the field to search for a service.
Endpoint
The endpoint of the API. You can view the endpoint in the API reference of the cloud service. For example, the endpoint of the Elastic Compute Service (ECS) API in the China (Hangzhou) region is ecs-cn-hangzhou.aliyuncs.com. The endpoint of the CloudMonitor API in the China (Hangzhou) region is metrics.cn-hangzhou.aliyuncs.com.
You can enter the endpoint in the arms.[regionId].aliyuncs.com format to support more regions. If you enter the endpoint in this format, you must specify the region ID in the request parameters when you call an API operation.
Version
The API version. You can view the API version in the API reference of the cloud service. For example, the API version of ECS is 2014-05-26.
Style
The API style. You can view the API style in the API reference of the cloud service. For example, the API style of ECS is Remote Procedure Call (RPC).
If "Data source is working" is displayed, the data source is added.
Grafana 10.0.x
On the homepage of Grafana, click the
 icon in the upper-left corner.
 In the left-side navigation pane, choose Administration > Data sources.
On the Data sources page, click + Add new data source.
On the Add data source page, enter OpenAPI in the search box and click OpenAPI in the search result.
On the page that appears, configure the parameters and click Save & test.
Parameter
Description
Name
The name of the data source. You can specify a custom name.
AccessKeyId
AccessKeySecret
AccessKeyId: the AccessKey ID of the RAM user that is authorized to call the API. For information about how to view AccessKey IDs, see View the information about AccessKey pairs of a RAM user.
AccessKeySecret: the AccessKey secret of the RAM user that is authorized to call the API. AccessKey secrets are not displayed in the console. After you create a RAM user, you must save the AccessKey secret of the RAM user.
Product
The name of the cloud service. You can select a name from the drop-down list or enter a name in the field to search for a service.
Endpoint
The endpoint of the API. You can view the endpoint in the API reference of the cloud service. For example, the endpoint of the ECS API in the China (Hangzhou) region is ecs.cn-hangzhou.aliyuncs.com. The endpoint of the CloudMonitor API in the China (Hangzhou) region is metrics.cn-hangzhou.aliyuncs.com.
You can enter the endpoint in the arms.[regionId].aliyuncs.com format to support more regions. If you enter the endpoint in this format, you must specify the region ID in the request parameters when you call an API operation.
Version
The API version. You can view the API version in the API reference of the cloud service. For example, the API version of ECS is 2014-05-26.
Style
The API style. You can view the API style in the API reference of the cloud service. For example, the API style of ECS is RPC.
If "Data source is working" is displayed, the data source is added.
Step 3: Create a dashboard panel
Grafana 9.0.x
In the left-side navigation bar, click the Dashboards icon. On the Dashboards page, click New Dashboard.
On the New dashboard page, click Add a new panel.
On the Query tab, select the data source that you added in Step 2 from the Data source drop-down list.
On the Query tab, configure the parameters on the following tabs.
Action
Parameter
Description
product
The name of the cloud service. Enter the value of the Product parameter configured in Step 2.
action
The API operation that you want to call. For more information, see the list of operations of the cloud service. For example, you can view the API operations of Application Real-Time Monitoring Service (ARMS) in the List of operations by function topic.
pathName
The request path. This parameter is required only if you call APIs in the Resource-Oriented Architecture (ROA) style.
method
The request method. Enter POST or GET.
Params
Click Add param and enter parameter names and values.
Fields
In the Field field, enter a JSONPath query to define the data to be extracted from the response returned in JSON format. $ indicates all data in the response. Select a data type from the Type drop-down list. Default value: Auto. Enter the alias of the field in the Alias field.
Grafana 10.0.x
On the homepage of Grafana, click the
 icon in the upper-left corner.
 In the left-side navigation pane, click Dashboards. In the upper-right corner of the page, choose New > New Dashboard.
On the New dashboard page, click + Add visualization.
In the Select data source dialog box, select the data source that you added in Step 2.
On the Query tab, configure the parameters on the following tabs.
Action
Parameter
Description
product
The name of the cloud service. Enter the value of the Product parameter configured in Step 2.
action
The API operation that you want to call. For more information, see the list of operations of the cloud service. For example, you can view the API operations of ARMS in the List of operations by function topic.
pathName
The request path. This parameter is required only if you call APIs in the ROA style.
method
The request method. Enter POST or GET.
Params
Click Add param and enter parameter names and values.
Fields
In the Field field, enter a JSONPath query to define the data to be extracted from the response returned in JSON format. $ indicates all data in the response. Select a data type from the Type drop-down list. Default value: Auto. Enter the alias of the field in the Alias field.
Examples
For more information, visit the OpenAPI demo page.