Use Global Accelerator (GA) access logs to analyze user behavior, identify geographic traffic patterns, and troubleshoot issues. GA integrates with Simple Log Service (SLS) to collect and deliver access logs for endpoint groups.
Introduction to Access Logs
You can enable access logging for one or more endpoint groups of a GA instance. Logs are delivered to an SLS Logstore in the same region as the endpoint group. Each log entry includes fields such as client source IP address, client source port, destination IP address, destination port, and acceleration region. For field details, see Log field reference.

Use cases
Troubleshoot issues
Use access logs to quickly locate and resolve problems.
For example, you can check the status of Global Accelerator acknowledgement messages using the status field to troubleshoot why access requests did not receive the expected response.
Business planning
Analyze access logs to support business planning and resource scaling.
For example, you can use the Traffic Trend in acceleration areas to upgrade bandwidth in advance to support business growth or downgrade bandwidth to reduce costs. You can also use the http_host field in access logs to view the list of hosts that accessed your application during a specific time period, preparing for application updates.
Billing
The GA access log feature is free. You pay only for SLS usage. For more information, see Billing of Simple Log Service.
Limits
Access logging is available only in regions where SLS is supported. For more information, see Supported regions.
Only standard GA instances support access logs. Basic GA instances do not. All procedures in this topic apply to standard GA instances.
You cannot collect access logs for endpoint groups deployed on an Alibaba Cloud point of presence (PoP) node.
You cannot query domain names of endpoints.
If you cannot use the access log feature, your instance version may not support it. To use this feature, contact your business manager to upgrade the instance.
Create an access log
Before you begin, make sure listeners and endpoint groups are added to your GA instance. For more information, see Add and manage smart routing listeners.
Log on to the GA console.
On the Instances page, click the ID of the GA instance.
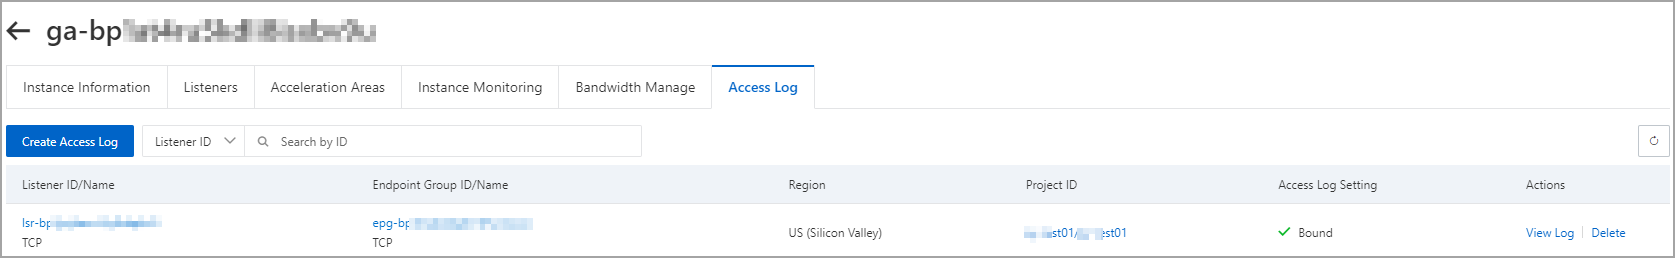
On the instance details page, click the Access Log tab.
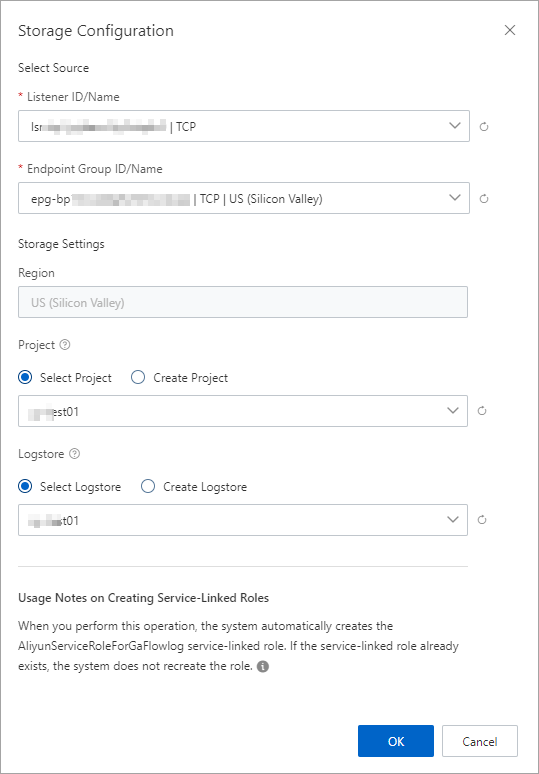
On the Access Log tab, click Create Access Log. In the Storage Configuration dialog box, configure the following parameters and click OK.
Configuration
Description
Select Storage Content
Listener ID/Name
Select an existing listener.
Endpoint Group ID/Name
Select a destination endpoint group.
Storage Settings
Region
By default, the region where the endpoint group resides is selected.
Project
A resource management unit in SLS used for resource isolation and control.
Click Select Project to choose an existing project, or click Create Project to create one.
Logstore
A unit in SLS for collecting, storing, and querying log data.
Click Select Logstore to choose an existing Logstore, or click Create Logstore to create one.
Custom Headers
Enable Custom Headers
When enabled, GA records specified HTTP headers in the
ga_headersfield of access logs.NoteThe custom header feature is rolling out in a phased release. Contact your account manager to enable it.
The default maximum size for custom headers is 1 KB. You can increase it to 4 KB. Contact your account manager to request this change.
After you enable this feature, your log data volume may increase, which can result in additional charges for Simple Log Service (SLS). For more information, see Simple Log Service billing.
header name
Enter the name of the HTTP header to record. Separate multiple names with semicolons (;). If left blank, all headers are recorded.
NoteWhen you perform this operation, the system checks whether the service-linked role AliyunServiceRoleForGaFlowlog exists for GA.
If the role does not exist, the system automatically creates it and attaches the policy AliyunServiceRolePolicyForGaFlowlog. This grants GA permission to access SLS and deliver flow logs to SLS.
If the role already exists, the system does not recreate it.
For more information, see AliyunServiceRoleForGaFlowlog.
After creation, view the access log on the Access Log tab.
More actions
Operation | Description |
View an access log |
|
Edit Custom Header | On the Access Log tab, find the access log and click Edit Custom Header in the Actions column. After updating the configuration, click OK. |
Delete an access log |
|
After SLS collects an access log, you can download, deliver, process, and alert on the log data. For more information, see Common operations on logs of Alibaba Cloud services.
Usage examples
View raw access logs
On the Raw Logs tab of the Logstore page, you can view the raw log entries.
For example, you can click the client_ip field to view client IP address information. 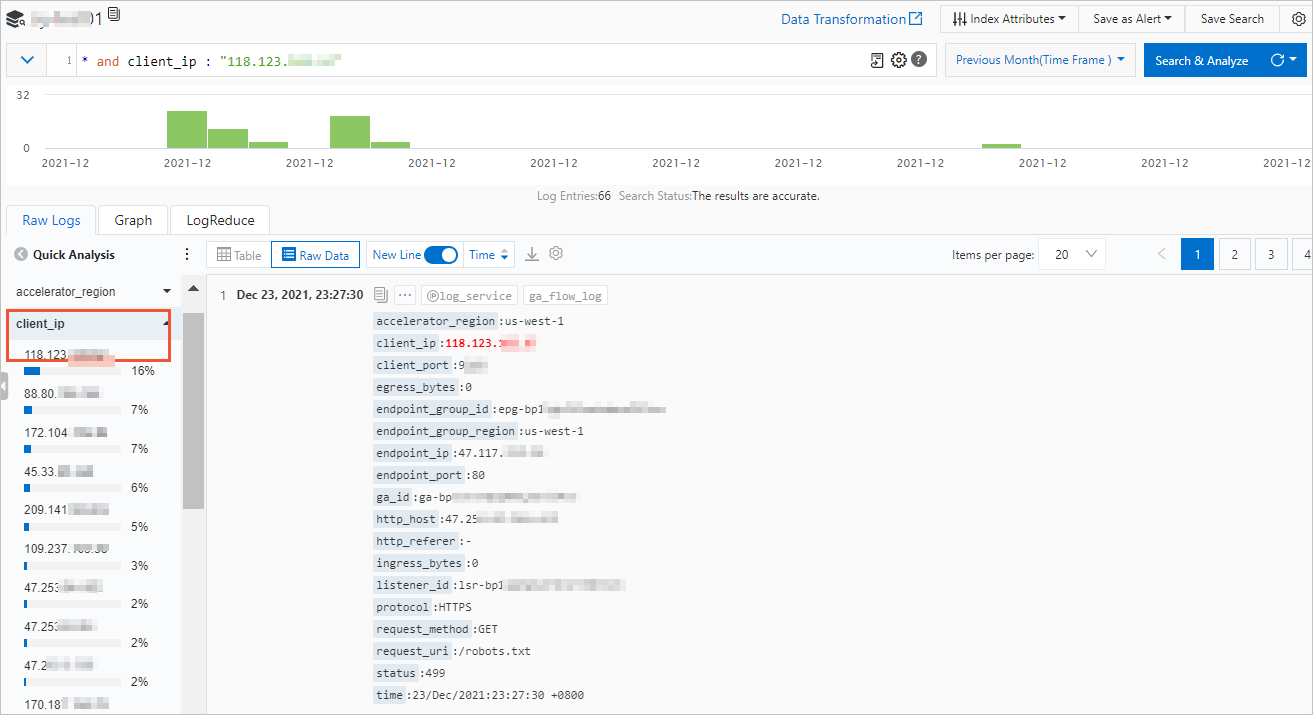
Query specific access logs
On the Logstore page, you can enter an SQL statement in the Search & Analyze search box to query specific access logs.
For example, you can follow the steps below to query the geographic distribution of client IP addresses. 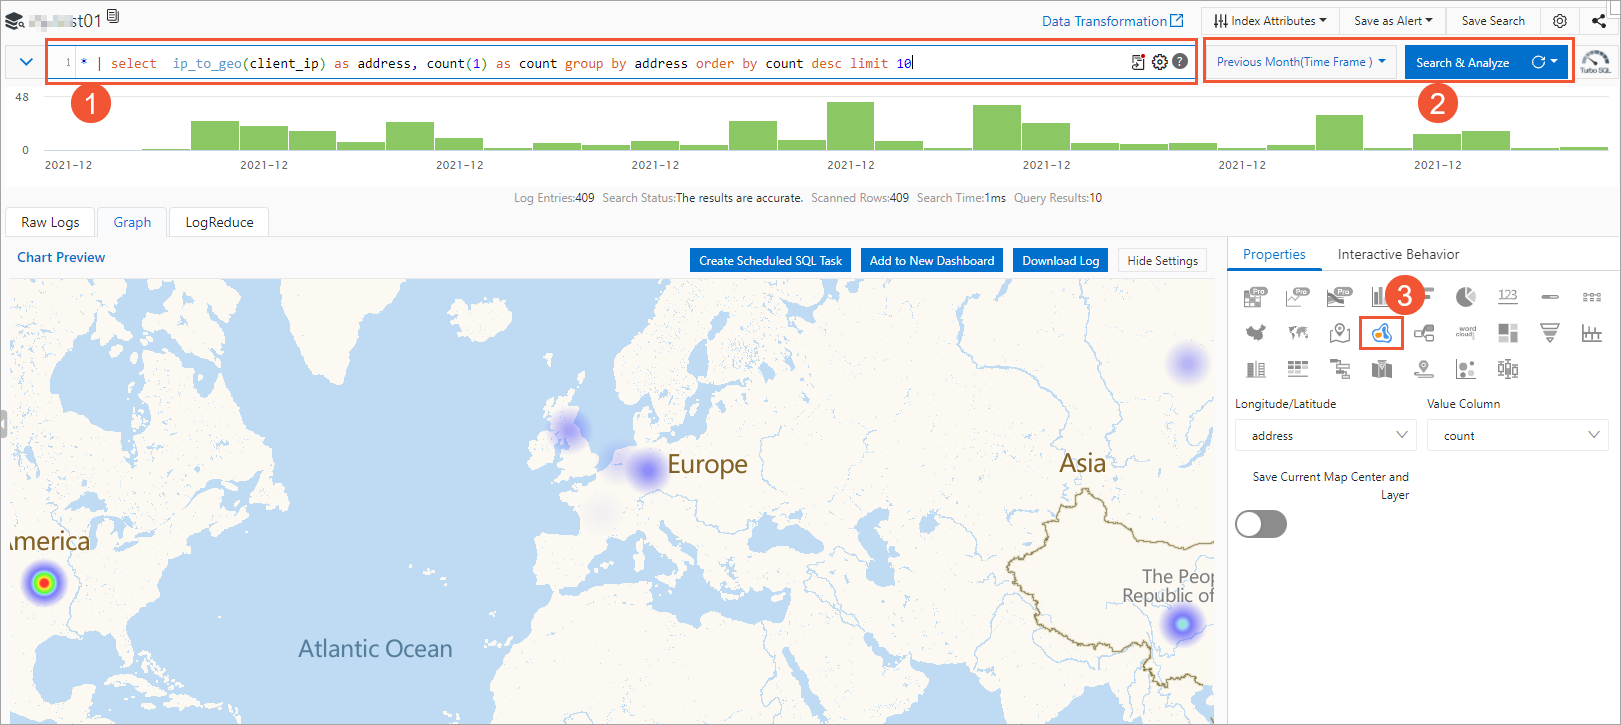
ordinal number | Description |
1 | Enter the following SQL statement to generate a heat map of client IP addresses and view the top 10 regions where clients are located. This helps with capacity planning. |
2 | Select a time range and click Search & Analyze. |
3 | On the Graph > Properties tab, click the |
Log field reference
The following fields are available in access logs in SLS.
Field | Description |
accelerator_region | The acceleration region. |
client_ip | The client IP address (source IP address). |
client_port | The client port (source port). |
egress_bytes | This refers to the traffic returned during the sampling period. |
endpoint_group_id | The ID of the endpoint group. |
endpoint_group_region | The region where the endpoint group is deployed. |
endpoint_ip | The endpoint IP address (destination IP address). |
endpoint_port | The endpoint port (destination port). |
ga_id | The ID of the GA instance. |
ingress_bytes | The inbound traffic during the sampling period. |
listener_id | The ID of the listener. |
protocol | The network transmission protocol used by the listener. |
status | The status of the response packet sent by GA. |
time | The time when the log entry was generated. |
upstream_connect_time | The connection duration. |
upstream_first_byte_time | The time to first byte. |
The following fields are available only for HTTP and HTTPS listeners.
Field | Description |
http_host | The Host header of the request. |
http_referer | The HTTP Referer header of the request received by GA. |
request_method | The request method. |
request_uri | The URI of the request received by GA. |
ga_headers | The custom header content. When the custom header feature is enabled, GA records specified HTTP headers in this field. |