After deploying Global Accelerator (GA), use one of the following methods to verify that it is reducing network latency:
Cloud Monitor Synthetic Tests — Runs detection from Internet service provider (ISP) network nodes across multiple regions simultaneously. Best for large-scale or multi-region validation.
Manual testing — Runs commands directly from a client in the acceleration region. Best for targeted spot-checks or in-depth analysis of a specific acceleration region.
Prerequisites
Before you begin, make sure you have:
A deployed GA instance. For details, see Create and manage standard GA instances
The listener port added to the security group allowlist on the endpoint server. For details, see Add a security group rule
Use Cloud Monitor Synthetic Tests
The Synthetic Tests tool in Cloud Monitor (CMS) runs detection from ISP network nodes in different regions, giving you a broad view of acceleration performance without logging in to each client individually.
Test domain name acceleration
Use this method if your GA instance accelerates connections to backend servers identified by domain names.
What you need:
The domain name of the backend server
The name of the acceleration region to filter results by
Steps:
Open Synthetic Tests.
Enter the domain name of the backend server and click Test Now. By default, an HTTP detection runs. For HTTPS, enter the full URL — for example,
https://example.com.In the Probe Check Result section, click
 next to the Detection Point City column header, enter the name of the acceleration region, and click Detection Point CityDetection Point CityConfirm.
Compare the results before and after enabling GA.
Acceleration performance varies based on actual workload. The following example uses a client in China (Hong Kong) and a backend server in US (Silicon Valley).
Figure 1. Before domain name access acceleration
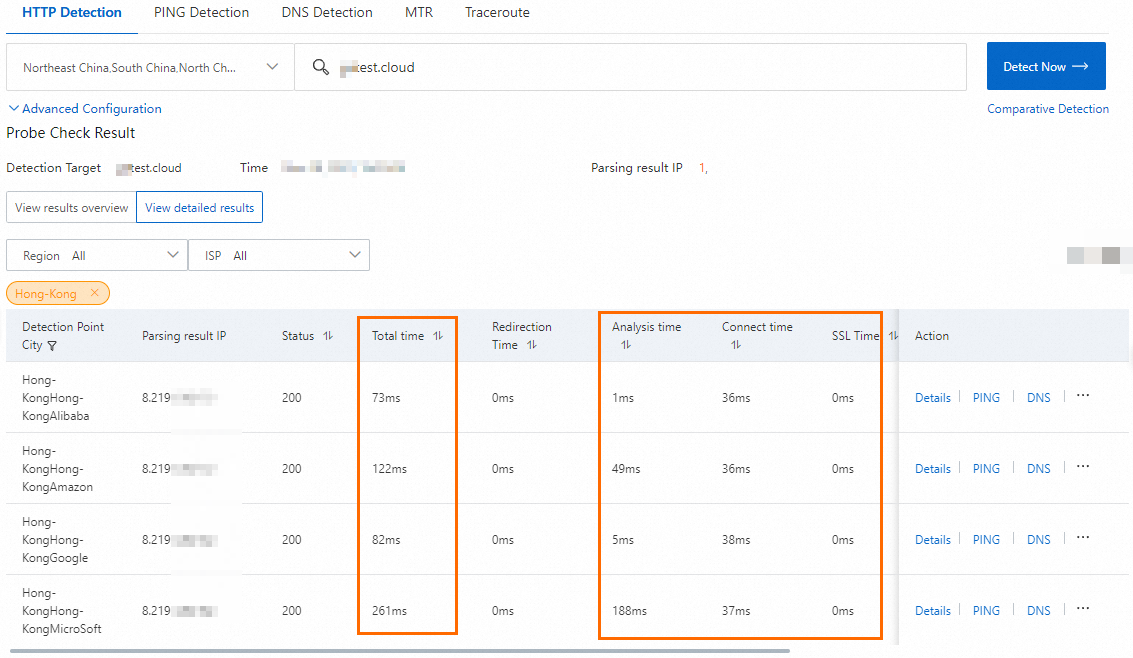
Figure 2. After domain name access acceleration
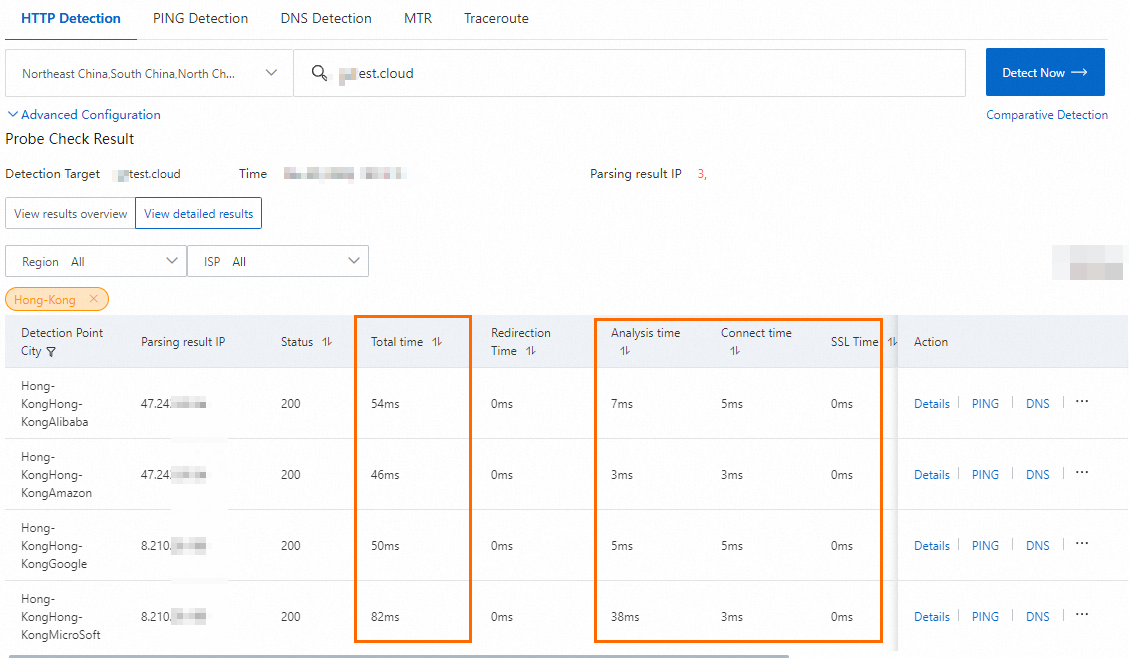
Figure 1. Before GA is used
Figure 2. After GA is used
Test IP address acceleration
Use this method if your GA instance accelerates connections to backend servers identified by IP addresses. The Comparative Test feature runs detection against both the backend server IP address and the accelerated IP address in a single test.
What you need:
The IP address of the backend server
The accelerated IP address
The name of the acceleration region to filter results by
Steps:
Open Synthetic Tests.
Click Comparative Test below the Test Now button.
Configure the test parameters:
Step Action 1 Select ISPs and regions from the drop-down list. In this example, all values are selected. 2 Enter the IP address of the backend server. 3 Enter the accelerated IP address. 4 Click Test Now. 5 In the Probe Check Result section, click next to the Detection Point City column header, enter the name of the acceleration region, and click Confirm.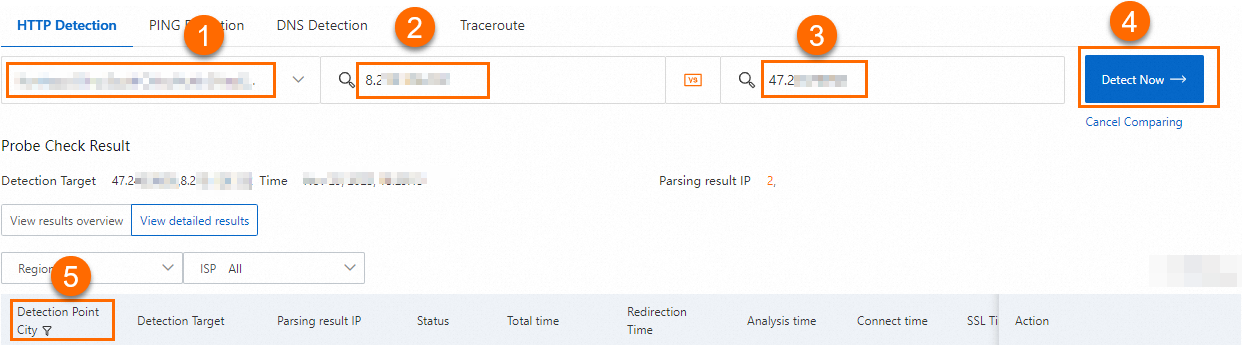
Compare the results before and after enabling GA.
Acceleration performance varies based on actual workload. The following example uses a client in China (Hong Kong) and a backend server in US (Silicon Valley).
Run manual tests
Manual testing measures latency directly from a client in the acceleration region. Use it for temporary spot-checks or to investigate performance in a specific location.
ICMP Ping and TCPing cannot measure end-to-end latency through GA. GA's proxy response mechanism responds to and closes ICMP Ping and TCPing requests at the acceleration region — these requests never reach the backend server. Use ICMP Ping and TCPing only to verify network connectivity between the client and the acceleration region.
Test TCP, HTTP, and HTTPS listeners
Run the following curl command from a client in the acceleration region. Compare the output before and after enabling GA.
curl -o /dev/null -s -w "time_connect: %{time_connect}\ntime_starttransfer: %{time_starttransfer}\ntime_total: %{time_total}\n" "http[s]://<domain name or IP address>[:<port>]"The command reports three timing metrics:
| Metric | Description |
|---|---|
time_connect | Time to establish a TCP connection, in seconds. |
time_starttransfer | Time from sending the request to receiving the first byte from the backend server, in seconds. |
time_total | Total time from sending the request to receiving the last byte from the backend server, in seconds. |
Using a domain name
Acceleration performance varies based on actual workload. The following example uses a client in China (Shenzhen) and a backend server in US (Silicon Valley).
Figure 1. Latency before acceleration (access to a domain name)

Figure 2. Latency after acceleration (access to a domain name)

Using an IP address
Acceleration performance varies based on actual workload. The following example uses a client in China (Hong Kong) and a backend server in US (Silicon Valley).
Figure 1. Network latency before acceleration (access to the IP address of the backend service)

Figure 2. Network latency after acceleration (access to the accelerated IP address)

Test UDP listeners
For GA instances with UDP listeners, use UDPing to measure latency. UDPing sends UDP packets to a specified IP address and port and reports round-trip time.
UDP datagrams are transmitted directly to endpoints in the endpoint group without establishing sessions. The following example uses Alibaba Cloud Linux 3 on both the endpoint server and the client, with a client in China (Hong Kong) accessing a backend server in Germany (Frankfurt).
Step 1: Deploy UDP Echo on the endpoint server
UDP Echo provides a straightforward latency baseline by echoing packets back to the sender. This example uses socat to run UDP Echo.
# Install socat
yum install socat

# Start UDP Echo on the listener port
nohup socat -v UDP-LISTEN:<listener port>,fork PIPE 2>/dev/null &
Step 2: Set up UDPing on the client
# Download UDPing
wget https://networktools-public.oss-cn-hangzhou.aliyuncs.com/ga/udping/udping.py

# Make it executable
chmod +x udping.py
Step 3: Measure latency before and after GA
Log on to the client.
Run the following command to measure latency without GA:
./udping.py <Backend server IP address> <Listener port>Run the following command to measure latency through GA:
./udping.py <Accelerated IP address> <Listener port>
Figure 1. Network latency before GA is used

Figure 2. Network latency after GA is used
