This topic describes the metrics for site monitoring and the detection process.
Metrics
The following table describes the metrics for site monitoring based on HTTP. The metrics for site monitoring based on other protocols, such as Simple Mail Transfer Protocol (SMTP), FTP, Transmission Control Protocol (TCP), and User Datagram Protocol (UDP), are similar to those described in the following table.
Metric | Unit | Description |
total_time | ms | The total time spent on detection, which includes the value of the redirect_time metric. |
http_dns_time | ms | The time spent on resolving the domain name into an IP address. |
curl_connect_time | ms | The time spent on setting up the curl connection after the detection request is sent, which includes the value of the http_dns_time metric. |
tcp_connect_time | ms | The time spent on setting up the TCP connection after the detection request is sent, which includes the value of the http_dns_time metric. |
ssl_connect_time | ms | The time spent on SSL-based authentication after the detection request is sent. |
curl_pretransfer_time | ms | The time spent on writing the HTTP request after the detection request is sent. |
curl_starttransfer_time | ms | The time spent on receiving the first byte of the response returned by the web server after the detection request is sent. |
http_connect_time | ms | The time spent on setting up the HTTP connection. The time is calculated by deducting the value of the http_dns_time metric from the value of the curl_pretransfer_time metric. |
http_download_time | ms | If the version of the detection point is earlier than V1.8, the value of this metric is 0. If the version of the detection point is V1.8 or later, the value of this metric indicates the time spent on reading the first 64 bytes of the HTTP response message. If the HTTP response message is encrypted, the time includes that spent on decryption. |
http_download_size | byte | The size of the HTTP response message. If the HTTP response message contains the Content-Length header, the value of this metric indicates the size of the HTTP response message. Otherwise, the value of this metric indicates the bytes that are read. |
http_download_speed | byte/s | The network speed at which the HTTP response is downloaded. |
redirect_time | ms | The time spent on sending the first redirected request after the detection request is sent. |
redirect_count | count | The number of redirects. |
If redirects occur during the detection, the metrics apply to the last detection.
Metric Calculation and Aggregation
The following describes how site monitoring calculates key metrics across multiple detection points.
Packet loss rate
The packet loss rate in site monitoring is an aggregated value calculated across all detection points, not a single-task or single-point theoretical value.
Formula: Average packet loss rate = (Total packets lost across all detection points) ÷ (Total packets sent across all detection points) × 100%
If multiple detection points are configured, the total packets sent equals the number of detection points multiplied by the number of packets sent per detection.
Availability rate
Availability rate = Number of successful detections during the detection cycle ÷ Total number of detections
Total number of detections = (60 ÷ Detection interval in minutes) × 24 × Days × Number of detection points
Alert data aggregation
For alert rules with a specific period (for example, 60 seconds), the alert is evaluated against data from the preceding time window. The packet loss rate and other metrics represent the average values of data within that time period.
Detection process
The following figure shows the detection process and how the preceding metrics are collected during the process.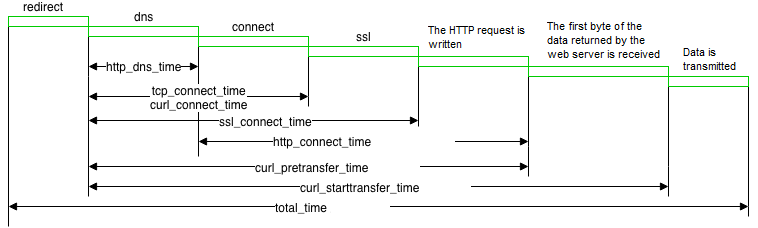
FAQ
Why is the ResponseTime (total_time) metric displayed as 0 when the service is interrupted or the connection is refused?
When site monitoring detects a service interruption such as connection refused, no valid connection is established. As a result, the ResponseTime (total_time) metric is recorded as 0 instead of a timeout value. This helps you distinguish between two scenarios:
Network timeout: ResponseTime equals the configured timeout threshold.