This topic describes how to use Auditbeat on Alibaba Cloud to collect data from the Linux audit framework, monitor file integrity, and create visualizations.
Background
Auditbeat is a lightweight shipper for audit logs. For example, Auditbeat collects and centralizes audit events from the Linux Audit Framework, detects changes to critical files such as binaries and configuration files, identifies potential security policy violations, and generates structured data for easy analysis. Auditbeat also integrates seamlessly with Logstash, Elasticsearch, and Kibana.
Auditbeat supports two modules:
Auditd
The Auditd module receives audit events from the Linux audit framework, which is part of the Linux kernel. The Auditd module can subscribe to the kernel to receive events as they happen. For more information, see the official Auditd documentation.
ImportantWhen the Auditd module is enabled, other monitoring tools can interfere with Auditbeat. For example, if another process (such as auditd) is registered to receive data from the Linux Audit Framework, you may encounter errors. In this case, run the
service auditd stopcommand to stop the process.File Integrity
The File Integrity module monitors file changes in specified directories in real time. To use the File Integrity module on a Linux system, make sure the Linux kernel supports inotify (inotify is available in kernel versions 2.6.13 and later). For more information, see the official File Integrity documentation.
NoteThe official Auditbeat System module is currently experimental. It may be removed or changed in a future release, and we recommend that you do not use it. For more information about modules, see modules.
Prerequisites
Complete the following:
Create an Alibaba Cloud Elasticsearch cluster.
For more information, see Create an Alibaba Cloud Elasticsearch cluster.
Enable Auto Indexing for the Alibaba Cloud Elasticsearch cluster.
For security reasons, Alibaba Cloud Elasticsearch does not allow Auto Indexing by default. However, Beats relies on this feature. Therefore, if the Output is set to Elasticsearch, you must enable the Auto Indexing feature. For more information, see Quick Access and Configuration.
Create an ECS instance in the same Virtual Private Cloud (VPC) as your Alibaba Cloud Elasticsearch cluster.
For more information, see Create an instance by using the wizard.
ImportantBeats currently supports only the Alibaba Cloud Linux (Alinux), RedHat, and CentOS operating systems.
Install Cloud Assistant and the Docker service on the target ECS instance.
For more information, see Install the Cloud Assistant client and Deploy and use Docker on Alibaba Cloud Linux 2 instances.
Procedure
Log on to the Alibaba Cloud Elasticsearch console.
In the left-side navigation pane, click Beats Data Shippers.
In the Create Shipper section, click Auditbeat.
Install and configure the shipper.
This example uses the following configuration. For more information, see Collect ECS service logs by using Filebeat and Shipper YML configuration. Enter a Shipper Name such as
zl-auditbeat, select a Version such as6.8.5, select Elasticsearch for the Shipper output and specify the target instance, select HTTP as the Protocol, and enter the Username (for example,elastic) and Password.NoteSelect Enable Kibana Monitoring to enable monitoring for the Auditbeat service in the Kibana console.
Select Enable Kibana Dashboard to generate charts in the Kibana console without additional YML configuration. Because Alibaba Cloud Kibana is configured within a VPC, you must first enable private network access for Kibana on the Kibana configuration page. For more information, see Connect to a cluster by using Kibana.
The following module configurations are from the default
auditbeat.ymlfile and require no changes:Auditd module configuration
- module: auditd # Load audit rules from separate files. Same format as audit.rules(7). audit_rule_files: [ '${path.config}/audit.rules.d/*.conf' ] audit_rules: |audit_rule_files: Specifies the audit rule files to load. Wildcards are supported. By default, 32-bit and 64-bit rule files are provided. Select the one that matches your system.audit_rules: Defines audit rules. You can connect to the ECS instance and run./auditbeat show auditd-rulesto view the default audit rules.-a never,exit -S all -F pid=26253 -a always,exit -F arch=b32 -S all -F key=32bit-abi -a always,exit -F arch=b64 -S execve,execveat -F key=exec -a always,exit -F arch=b64 -S connect,accept,bind -F key=external-access -w /etc/group -p wa -k identity -w /etc/passwd -p wa -k identity -w /etc/gshadow -p wa -k identity -a always,exit -F arch=b64 -S open,truncate,ftruncate,create,openat,open_by_handle_at -F exit=-EACCES -F key=access -a always,exit -F arch=b64 -S open,truncate,ftruncate,create,openat,open_by_handle_at -F exit=-EPERM -F key=accessNoteIn most cases, the default rules meet common audit requirements. To use custom audit rules, modify the rule files in the audit.rules.d directory.
File Integrity module configuration
- module: file_integrity paths: - /bin - /usr/bin - /sbin - /usr/sbin - /etcpaths: Specifies the paths to monitor. By default, Auditbeat monitors/bin,/usr/bin,/sbin,/usr/sbin, and/etc.
Select the ECS instance where you want to install the shipper.
Start the shipper and check its installation status.
Click Start.
After the shipper is started, the Start Shipper dialog box appears.
Click Back to Beats Shippers to return to the Beats Data Shippers page. In the Manage Shippers section, view the Auditbeat shipper that was successfully started.
Wait for the Shipper Status to change to Enabled 1/1, and then click View Instances in the Actions column.
On the View Instances page, check the Installed Shippers. A Normal Heartbeat status indicates a successful installation.
View the results
Log on to the Kibana console of the target Alibaba Cloud Elasticsearch cluster.
For more information, see Log on to the Kibana console.
In the left-side navigation pane, click Discover. Select the predefined auditbeat-* pattern, choose a time range, and view the data collected by Auditbeat during that period.
The top of the page displays the number of hits and a histogram of the data distribution over time. In the data table below, you can expand each record to view details of audit fields such as
event.module,event.action,user.name, andnetwork.direction.In the left-side navigation pane, click Dashboard.
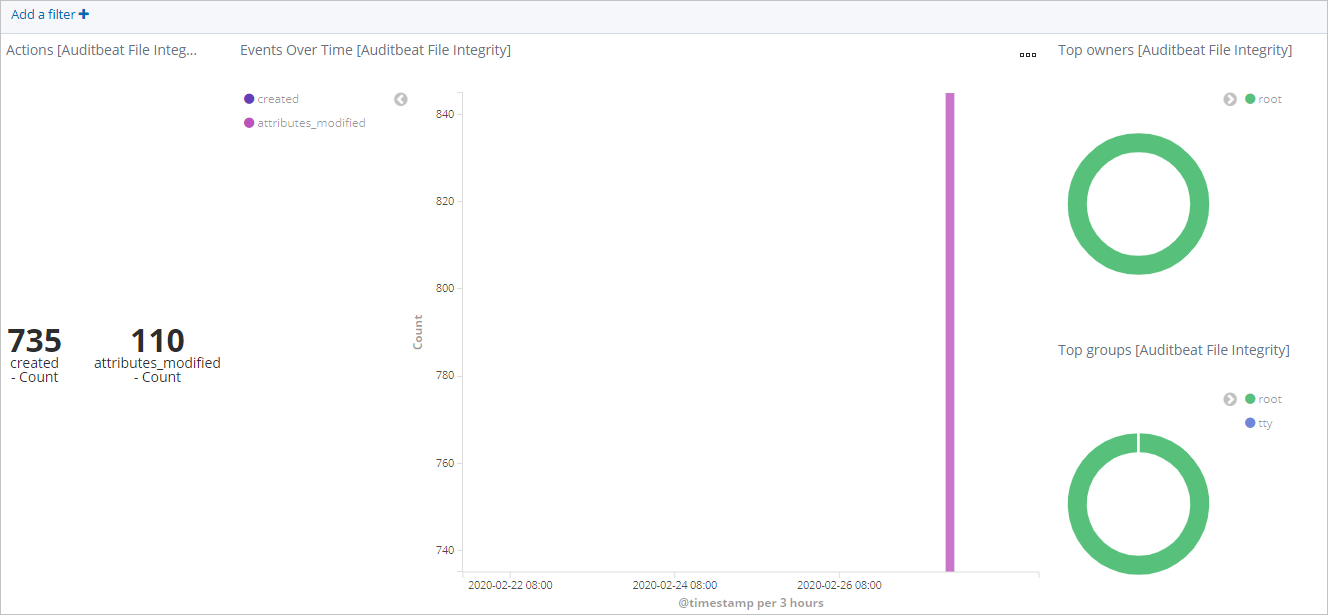
In the Dashboards list, click [Auditbeat File Integrity] Overview. Then, select a time range to view the file changes.