Heartbeat periodically checks network endpoints over HTTP/HTTPS, TCP, and ICMP, then ships the results to Elasticsearch. The Kibana Uptime app reads that data to show availability and response time in real time, alerting you to problems before they affect your users.
This topic walks you through deploying a Heartbeat shipper on an Elastic Compute Service (ECS) instance and viewing your Elasticsearch cluster's health on the Uptime page.
How it works
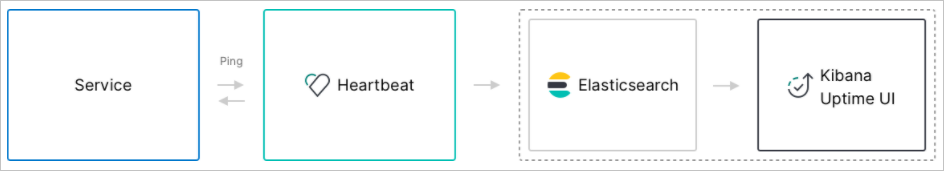
A Heartbeat shipper runs scheduled probes against a target service, ships the results to Elasticsearch, and makes the data available in Kibana Uptime.
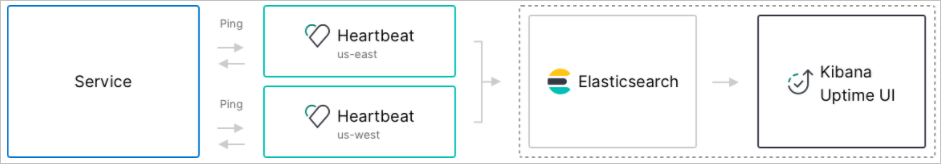
Two deployment patterns are supported:
Single shipper — one Heartbeat instance monitors a service from one location.
Multiple shippers — two Heartbeat instances monitor the same service from different locations. If one shipper goes down, the other can still detect and help isolate the fault.
For more details, see Deployment architecture.
Kibana also provides the Alerting and Actions feature (available in Kibana V7.7 and later) as an alternative way to configure monitoring and alerting. For details, see Alerting and Actions.
Prerequisites
Before you begin, make sure you have:
An Alibaba Cloud Elasticsearch cluster with Auto Indexing enabled. See Create an Alibaba Cloud Elasticsearch cluster and Configure the YML file.
An ECS instance in the same virtual private cloud (VPC) as the Elasticsearch cluster, running one of the supported operating systems: Alibaba Cloud Linux, Red Hat Enterprise Linux (RHEL), or CentOS. See Create an instance on the Custom Launch tab.
Cloud Assistant and Docker installed on the ECS instance. See Install Cloud Assistant Agent and Deploy and use Docker on ECS instances.
Create a Heartbeat shipper
Log on to the Alibaba Cloud Elasticsearch console.
In the left-side navigation pane, click Beats Data Shippers.
In the Create Shipper section, click Heartbeat.
Configure the shipper. For general setup steps, see Collect the logs of an ECS instance and Prepare a YML configuration file for a shipper.
On the heartbeat.yml tab, set the
heartbeat.monitorsparameters. The following example monitors an Elasticsearch cluster over HTTP:
Parameter Description typeMonitor protocol. Set to httpfor this example. HTTP/HTTPS monitors can track response codes, request bodies, and request headers. TCP monitors can track port numbers and strings. ICMP is also supported.urlsThe endpoints to probe. Set this to the internal endpoint of your Elasticsearch cluster. Multiple URLs are allowed. scheduleHow often to run the check. @every 10sruns a probe every 10 seconds.Click Next.
In the ECS instance list, select the instance where you want to install the shipper.
Click Start.
Verify the shipper is running
After starting the shipper, confirm it is healthy:
In the shipper list, find your Heartbeat shipper and click View Instances in the Actions column.
Check that the shipper state is Enabled and the installation state is Normal Heartbeat.
If either status is not as expected, check that the ECS instance can reach the Elasticsearch cluster endpoint and that Docker is running correctly on the instance.
View monitoring results in Kibana Uptime
Log on to the Kibana console that corresponds to the Elasticsearch cluster you set as the Output when creating the Heartbeat shipper. See Log on to the Kibana console.
In the left-side navigation pane, click Uptime.
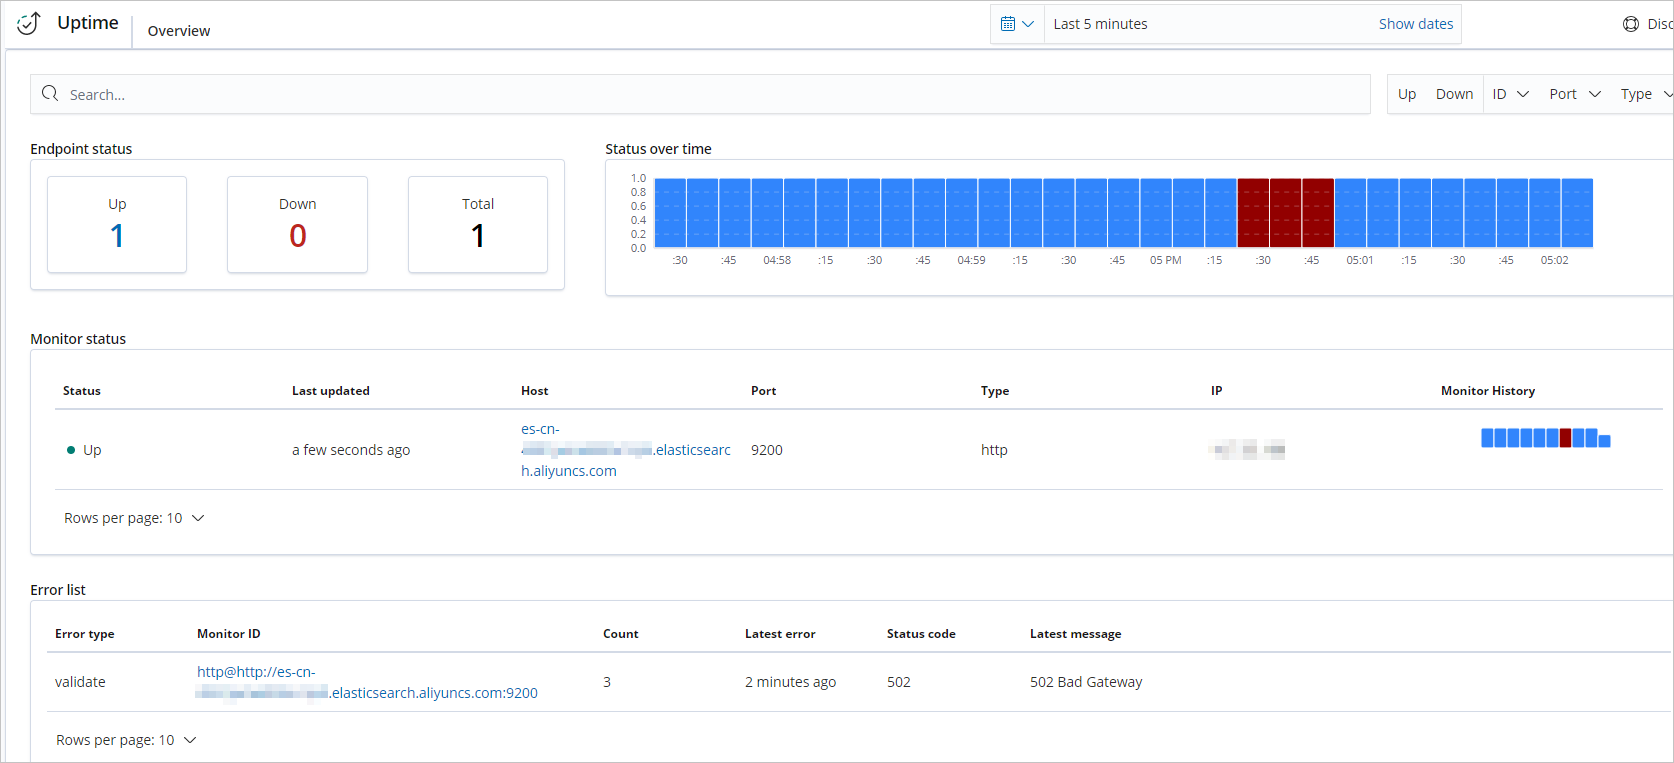
The Uptime page shows the current status of monitored endpoints:
Color Meaning Red The Elasticsearch cluster is in an abnormal state. Check the Heartbeat shipper's communication status or the cluster's health. Blue The Elasticsearch cluster is operating normally.