As time series data accumulates, storage costs grow linearly with volume. The Elasticsearch rollup mechanism lets you aggregate historical data into compact summaries at a fraction of the original storage cost, while still supporting aggregation queries through Kibana.
This tutorial walks through a complete rollup workflow for Logstash traffic monitoring data: creating a rollup job, querying the rollup index, and building a Kibana dashboard to visualize networkoutTraffic and networkinTraffic metrics by instance ID at hourly granularity.
The commands in this tutorial apply to Elasticsearch V7.4. For V6.x commands, see Getting started with rollups.
Prerequisites
Before you begin, make sure you have:
-
The
manageormanage_rolluppermission. For details, see Security privileges -
A running Alibaba Cloud Elasticsearch V7.4 instance (Standard Edition). To create one, see Create an Alibaba Cloud Elasticsearch cluster
-
Access to the Kibana console. For instructions, see Log on to the Kibana console
Run all API commands in this tutorial from the Kibana console.
Background
The source index used in this tutorial follows the pattern monitordata-logstash-sls-*, where * is the date in YYYY-MM-DD format. A new index is created each day.
The index mapping is:
"monitordata-logstash-sls-2020-04-05" : {
    "mappings" : {
      "properties" : {
        "@timestamp" : {
          "type" : "date"
        },
        "__source__" : {
          "type" : "text",
          "fields" : {
            "keyword" : {
              "type" : "keyword",
              "ignore_above" : 256
            }
          }
        },
        "disk_type" : {
          "type" : "text",
          "fields" : {
            "keyword" : {
              "type" : "keyword",
              "ignore_above" : 256
            }
          }
        },
        "host" : {
          "type" : "keyword"
        },
        "instanceId" : {
          "type" : "keyword"
        },
        "metricName" : {
          "type" : "keyword"
        },
        "monitor_type" : {
          "type" : "keyword"
        },
        "networkinTraffic" : {
          "type" : "double"
        },
        "networkoutTraffic" : {
          "type" : "double"
        },
        "node_spec" : {
          "type" : "keyword"
        },
        "node_stats_node_master" : {
          "type" : "keyword"
        },
        "resource_uid" : {
          "type" : "keyword"
        }
      }
    }
  }
}
Step 1: Create a rollup job
A rollup job defines which source indexes to aggregate, what fields to group on, which metrics to compute, and how often to run.
The following job reads from monitordata-logstash-sls-*, groups data by hour and instance ID, computes the sum of each traffic field, and runs every 15 minutes.
PUT _rollup/job/ls-monitordata-sls-1h-job1
{
    "index_pattern": "monitordata-logstash-sls-*",
    "rollup_index": "monitordata-logstash-rollup-1h-1",
    "cron": "0 */15 * * * ?",
    "page_size" :1000,
    "groups" : {
      "date_histogram": {
        "field": "@timestamp",
        "fixed_interval": "1h"
      },
      "terms": {
        "fields": ["instanceId"]
      }
    },
    "metrics": [
        {
            "field": "networkoutTraffic",
            "metrics": ["sum"]
        },
        {
            "field": "networkinTraffic",
            "metrics": ["sum"]
        }
    ]
}
Parameters:
| Parameter | Required | Type | Description |
|---|---|---|---|
index_pattern |
Yes | string | The source index or index pattern. Wildcards (*) are supported. |
rollup_index |
Yes | string | The destination index for rollup summaries. Must be a complete name — wildcards are not supported. |
cron |
Yes | string | How often the rollup job runs. This controls the job execution frequency, not the aggregation granularity. |
page_size |
Yes | integer | The number of bucket results processed per iteration. A higher value speeds up processing but increases memory usage. |
groups |
Yes | object | Defines the grouping fields and aggregation methods. |
groups.date_histogram |
Yes | object | Groups the date field into time-based buckets. |
groups.date_histogram.field |
Yes | string | The date field to roll up. |
groups.date_histogram.fixed_interval |
Yes | time unit | The aggregation granularity. 1h groups data into 1-hour buckets. This is the minimum query interval supported on the rollup index. |
groups.terms |
No | object | Groups by the specified term fields. |
groups.terms.fields |
Yes | string | The fields to group by. Accepts keyword or numeric field types, in any order. |
metrics |
No | object | Defines which numeric fields to aggregate. |
metrics[].field |
Yes | string | The field to aggregate. |
metrics[].metrics |
Yes | array | The aggregation operators to apply: min, max, sum, avg, or value_count. |
For the full parameter reference, see Create rollup jobs API.
Configuration rules:
-
index_patternandrollup_indexmust differ. Ifindex_patternis a wildcard that matchesrollup_index, the API returns an error. -
The
rollup_indexmapping uses the object type. Setting it to the same value asindex_patterncauses an error. -
Rollup jobs support only date histogram aggregation, histogram aggregation, and terms aggregation. For details, see Rollup aggregation limitations.
Step 2: Start the rollup job and check its status
-
Start the rollup job:
POST _rollup/job/ls-monitordata-sls-1h-job1/_start -
Retrieve the job configuration, statistics, and current status:
GET _rollup/job/ls-monitordata-sls-1h-job1/For the full response schema, see Get rollup jobs API. A successful response looks similar to:
{
     ........
      "status" : {
        "job_state" : "indexing",
        "current_position" : {
          "@timestamp.date_histogram" : 1586775600000,
          "instanceId.terms" : "ls-cn-ddddez****"
        },
        "upgraded_doc_id" : true
      },
      "stats" : {
        "pages_processed" : 3,
        "documents_processed" : 11472500,
        "rollups_indexed" : 3000,
        "trigger_count" : 1,
        "index_time_in_ms" : 766,
        "index_total" : 3,
        "index_failures" : 0,
        "search_time_in_ms" : 68559,
        "search_total" : 3,
        "search_failures" : 0
      }
}
Step 3: Query the rollup index
Rollup documents have a different internal structure from raw data. When you query a rollup index, Elasticsearch rewrites your Query DSL to match the rollup format, then restores the result to the shape your client expects.
-
Retrieve all documents in the rollup index:
GET monitordata-logstash-rollup-1h-1/_search { "query": { "match_all": {} } } -
Use
_rollup_searchto compute the sum ofnetworkoutTraffic:GET /monitordata-logstash-rollup-1h-1/_rollup_search { "size": 0, "aggregations": { "sum_temperature": { "sum": { "field": "networkoutTraffic" } } } }
_rollup_search supports a subset of standard search features:
| Feature | Support | Notes |
|---|---|---|
query |
Supported | Query DSL with restrictions. Supported types: term, terms, range, match_all, and compound queries (Boolean, boosting, constant score). |
aggregations |
Supported | Standard aggregation parameter. |
size |
Must be 0 or omitted |
Rollup is aggregation-only — raw documents are not returned. |
highlighter, suggestors, post_filter, profile, explain |
Not supported | — |
For the full list of restrictions, see Rollup search limitations and Rollup aggregation limitations.
Query limitations:
-
Specify only one rollup index per query. Fuzzy match on the rollup index name is not supported. Real-time data queries support multiple indexes.
Step 4: Create a rollup index pattern
Before visualizing rollup data in Kibana, create a rollup index pattern so Kibana recognizes the rollup index.
-
Log on to the Kibana console. For instructions, see Log on to the Kibana console.
-
In the left-side navigation pane, click the Management icon.
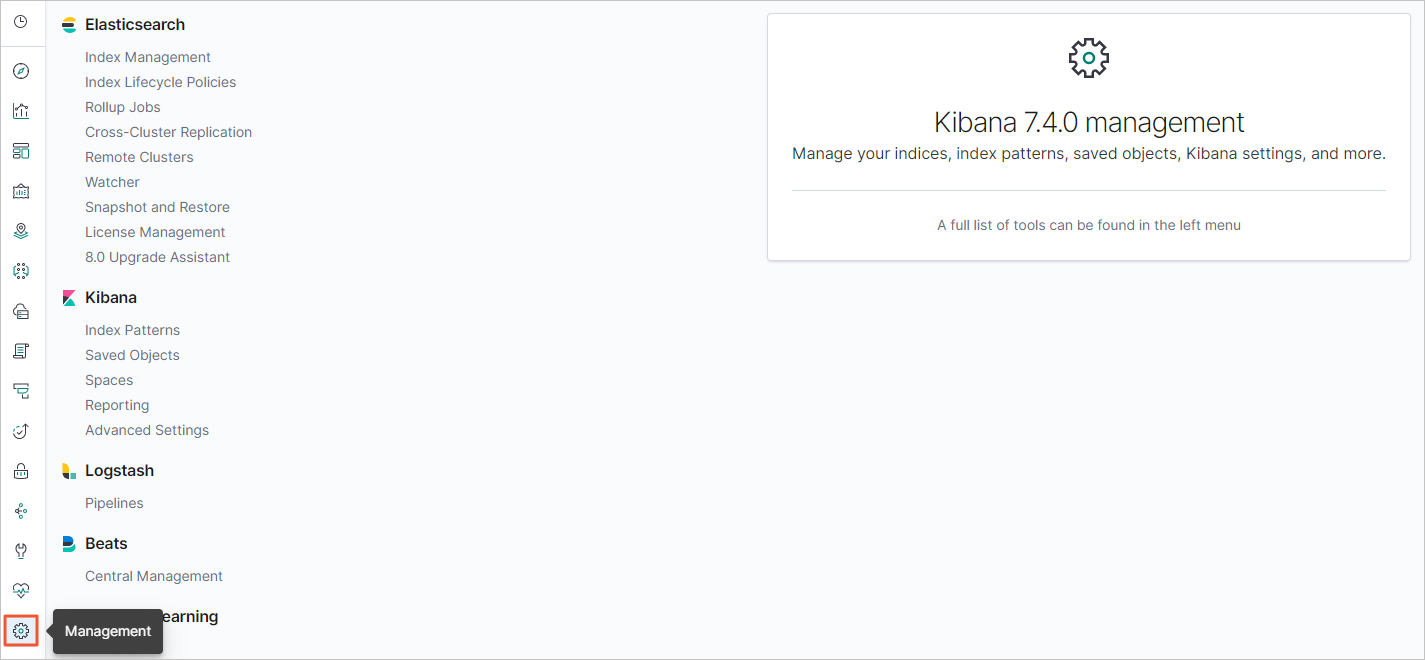
-
In the Kibana area, click Index Patterns.
-
Optional: Close the About index patterns page. Skip this step if you have created an index pattern before.
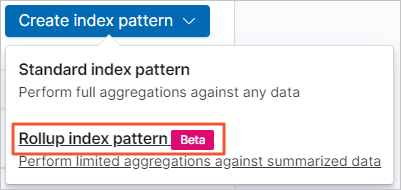
-
Choose Create index pattern > Rollup index pattern.
-
In the Index pattern field, enter the rollup index name (for example,
monitordata-logstash-rollup-1h-1), then click Next step.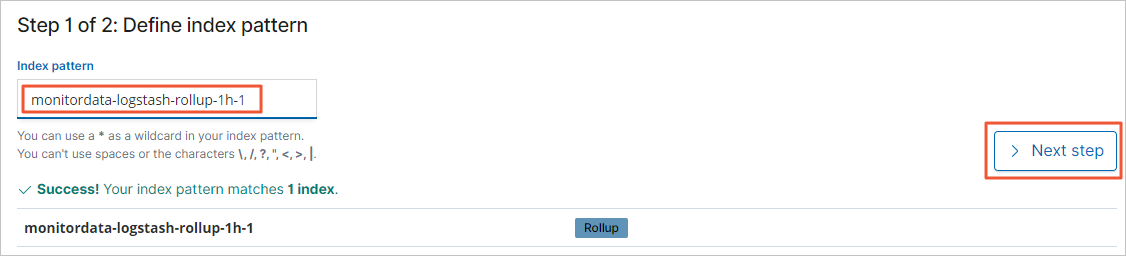
-
From the Time Filter field name drop-down list, select @timestamp.
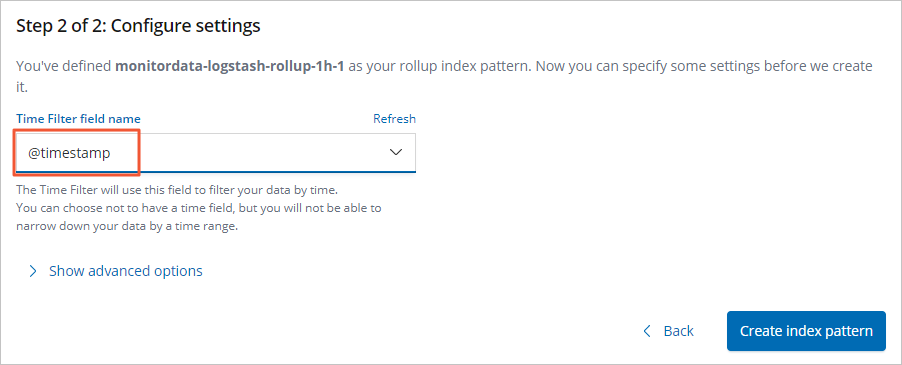
-
Click Create index pattern.
Step 5: Create traffic monitoring charts
Create line charts for networkinTraffic and networkoutTraffic using the rollup index pattern.
-
Log on to the Kibana console. For instructions, see Log on to the Kibana console.
-
Create a line chart:
-
In the left-side navigation pane, click the Visualize icon.
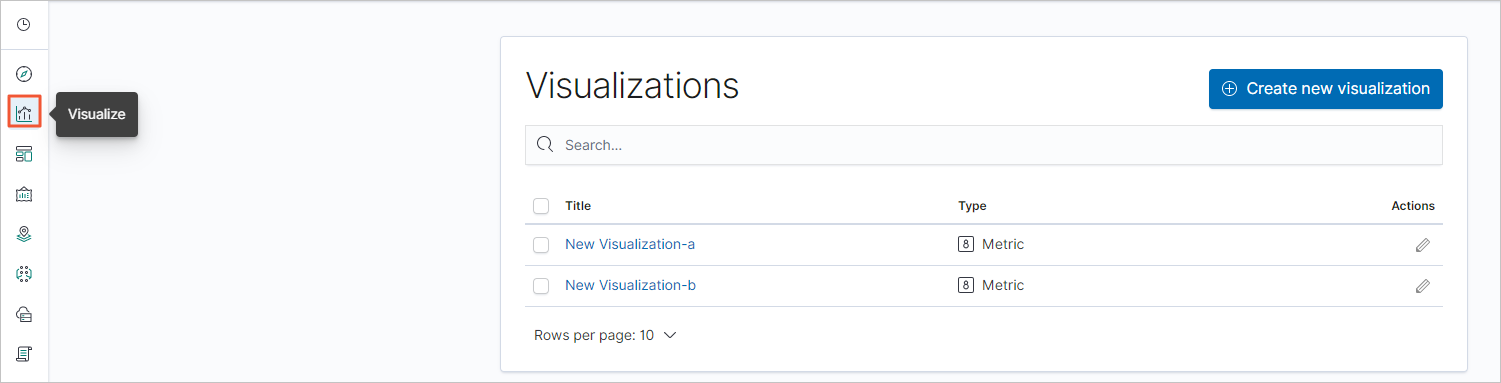
-
Click Create new visualization.
-
In the New Visualization dialog box, click Line.
-
From the index pattern list, select the rollup index pattern you created in Step 4.
-
-
Configure the Metrics and Buckets settings:
-
In the Metrics section, click the Y-axis drop-down arrow
 .
. -
Set the Y-axis parameters:
Parameter Value Aggregation Sum Field networkinTrafficornetworkoutTrafficCustom label Enter a label for the Y-axis -
In the Buckets section, choose Add > X-axis.
-
Set the X-axis parameters:
Parameter Value Aggregation date_histogram(as defined ingroupsin Step 1)Field @timestampMinimum interval An integer multiple of the rollup interval — for example, 2hor3h. The default is the aggregation granularity set in the rollup job. -
Click the Apply Changes icon
 .
.
-
-
In the top navigation bar, click Save.
-
Repeat the steps above to create a gauge chart.
Step 6: Create a traffic monitoring dashboard
-
In the left-side navigation pane, click the Dashboard icon.
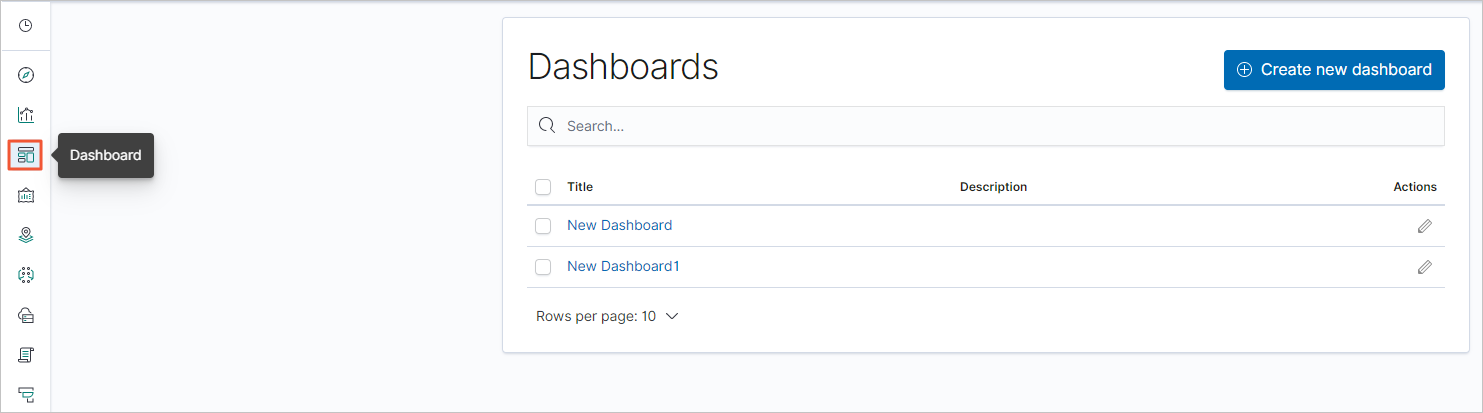
-
Click Create new dashboard.
-
In the top navigation bar, click Add.
-
On the Add panels page, click the chart you created in Step 5.
-
Close the Add panels page, then click Save in the top navigation bar.
-
Enter a dashboard name and click Confirm Save. The dashboard is now displayed.
-
Click + Add filter, select a filter item, configure the filter conditions, and click Save.