You can use an Alibaba Cloud Metricbeat shipper to collect system data, such as CPU usage, memory, disk I/O, and network I/O statistics, along with Nginx service data, and visualize the data in charts.
Prerequisites
-
An Alibaba Cloud Elasticsearch instance is created.
For more information, see Create an Alibaba Cloud Elasticsearch instance.
NoteThe instance must run Elasticsearch 6.0.x to 7.17.x. Version 7.10.0 is recommended to avoid compatibility issues.
-
Automatic indexing is enabled for your Alibaba Cloud Elasticsearch instance.
Automatic indexing is disabled by default for Alibaba Cloud Elasticsearch instances. Beats requires this feature. If Elasticsearch is your shipper output, you must enable automatic indexing. For more information, see Quick access and configuration.
-
An ECS instance is created in the same Virtual Private Cloud (VPC) as your Alibaba Cloud Elasticsearch instance.
For more information, see Create an instance by using the wizard.
ImportantBeats supports only the following operating systems: Alibaba Cloud Linux (Alinux), Red Hat, and CentOS.
-
Cloud Assistant and the Docker service are installed on the target ECS instance.
For more information, see Install the Cloud Assistant agent and Deploy and use Docker.
Collect system data with Metricbeat
Log on to the Alibaba Cloud Elasticsearch console.
-
In the navigation pane on the left, click Beats Data Shippers.
-
In the Create Shipper section, click Metricbeat.
-
Install and configure the shipper.
For more information, see Collect ECS service logs by using Filebeat and Shipper YML Configuration. On the configuration page, enter a Shipper Name such as
zl-metricbeat, select a Version, set Shipper Output to Elasticsearch, select the target Elasticsearch instance and protocol, and then enter its username and password.Note-
Select Enable Kibana Monitoring to monitor the Metricbeat service on the Kibana console.
-
Select Enable Kibana Dashboard. The system automatically generates dashboards on the Kibana console without requiring additional YML configuration. You must enable Kibana private network access because Alibaba Cloud Kibana is configured within a VPC. For more information, see Connect to a cluster by using Kibana.
-
The system module is enabled by default. You do not need to configure the Shipper YML Configuration.
-
-
Click Next.
-
Select the ECS instance where you want to install the shipper.
NoteIf you are creating a shipper for the first time, click Authorize Now and follow the on-screen instructions to grant the Alibaba Cloud Elasticsearch service access to your ECS instances.
-
Start the shipper and check its installation status.
-
Click Start.
After the shipper starts, a Start Shipper dialog box appears.
-
Click Back to Beats Shippers to return to the Beats Data Shippers page. In the Manage Shippers section, find the Metricbeat shipper that you started.
-
Wait until the Shipper Status changes to Enabled. Then, click View Instances in the Actions column.
-
On the View Instances page, check the Installed Shippers status. If the status is Normal Heartbeat, the shipper is successfully installed.
-
-
View the results.
-
Log on to the Kibana console of the target Alibaba Cloud Elasticsearch instance.
For more information, see Log on to the Kibana console.
-
In the navigation pane on the left, click Dashboard.
-
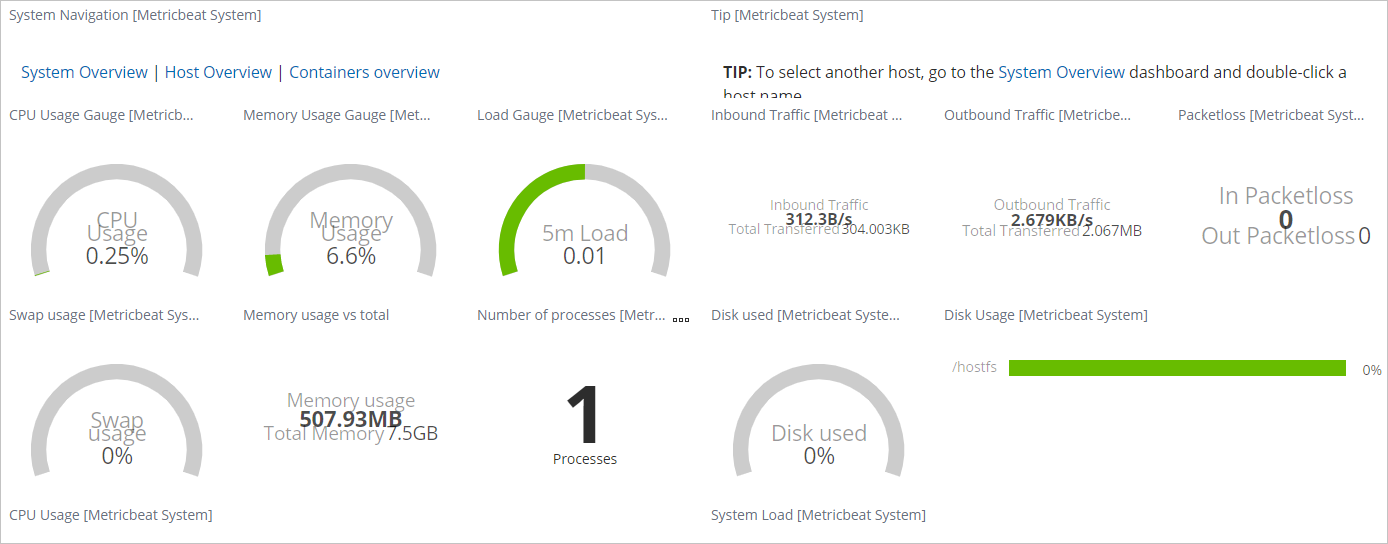
In the Dashboard list, click [Metricbeat System] Overview. Then, click the corresponding Metricbeat system to view its monitoring dashboard.
-
Collect Nginx service data with Metricbeat
Prerequisite: Enable the stub_status module for the Nginx service. The ngx_http_stub_status_module in Nginx collects request statistics. Enable stub_status in the nginx.conf file. For more information about how to modify the nginx.conf file, see How do I change the listening port of a web service, such as Nginx or Tomcat, on a Linux-based ECS instance?.
location /status {
           stub_status on;
           access_log off;
}Ensure that the server_status_path in the metricbeat.yml file matches the status path in the nginx.conf file.
Log on to the Alibaba Cloud Elasticsearch console.
-
In the navigation pane on the left, click Beats Data Shippers.
-
In the Create Shipper section, click Metricbeat.
-
Install and configure the shipper.
For more information, see Collect ECS service logs by using Filebeat and Shipper YML Configuration.
Add the following content to the metricbeat.yml file.
metricbeat.modules: - module: nginx metricsets: ["stubstatus"] enabled: true period: 10s # Nginx hosts hosts: ["http://121.41.**.**"] # Path to server status. Default server-status server_status_path: "status"Note-
Select Enable Kibana Monitoring to monitor the Metricbeat service on the Kibana console.
-
Select Enable Kibana Dashboard. The system automatically generates dashboards on the Kibana console without requiring additional YML configuration. You must enable Kibana private network access because Alibaba Cloud Kibana is configured within a VPC. For more information, see Connect to a cluster by using Kibana.
-
-
Click Next.
-
Select the ECS instance where you want to install the shipper.
NoteIf you are creating a shipper for the first time, click Authorize Now and follow the on-screen instructions to grant the Alibaba Cloud Elasticsearch service access to your ECS instances.
-
Start the shipper and check its installation status.
For more information, see Collect system data by using Metricbeat.
-
View the results.
-
In a web browser, go to
<Nginx hosts>/statusto open the monitoring page.The monitoring page displays status information similar to the following:
Active connections: 3 server accepts handled requests 2257 2257 21394 Reading: 0 Writing: 1 Waiting: 2 -
Log on to the Kibana console of the target Alibaba Cloud Elasticsearch instance.
For more information, see Log on to the Kibana console.
-
In the navigation pane on the left, click Dashboard.
-
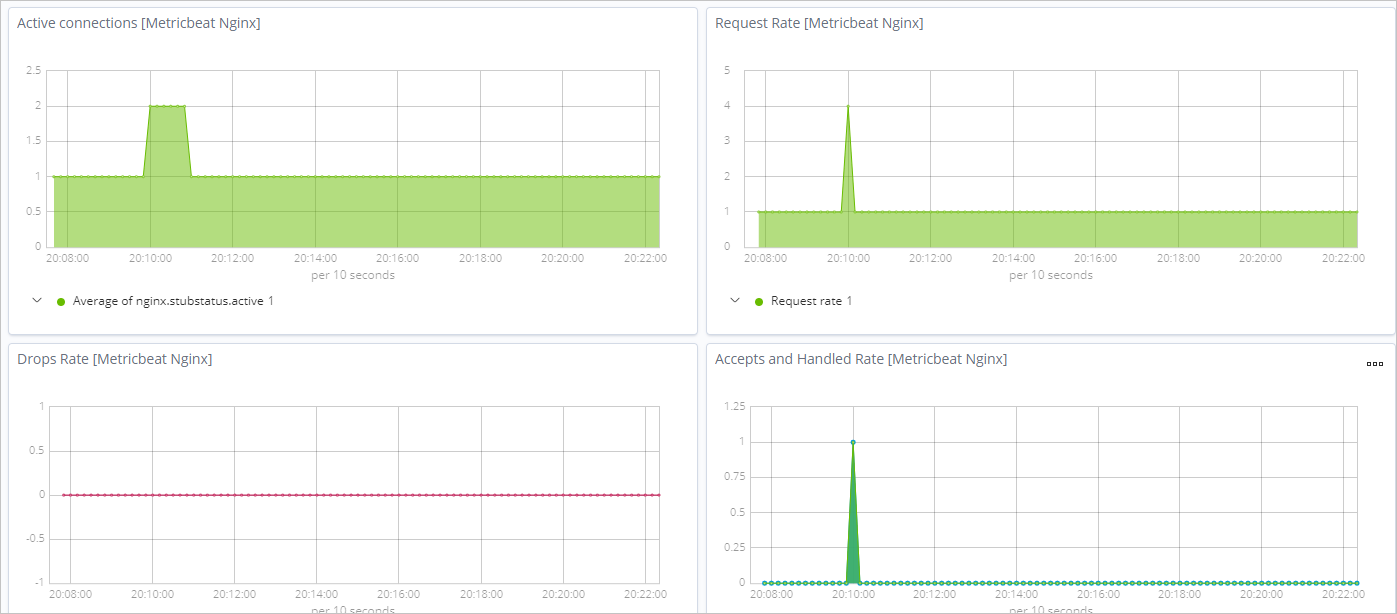
In the Dashboard list, click [Metricbeat Nginx] Overview to view the Nginx monitoring dashboard.
-