Kibana Discover lets you search, filter, and explore large volumes of data within a specific time range. With Discover, you can:
-
Search and filter time-series data using Kibana Query Language (KQL)
-
Browse and expand individual documents to examine field values
-
View documents that occurred before or after a specific log entry
-
Adjust the time range and histogram interval to focus on any period
Background information
Discover helps Kibana find your data and search and filter it for hidden insights and relationships. For more information, see open source Kibana documentation.
Prerequisites
Before you begin, ensure that you have:
-
An Alibaba Cloud Elasticsearch cluster. For more information, see Create an Alibaba Cloud Elasticsearch cluster. This guide uses an Elasticsearch V7.10 cluster.
-
An index created in the cluster. This guide uses an index that stores NGINX logs.
-
Access to the Kibana console of the cluster. For more information, see Log on to the Kibana console.
Create an index pattern
Before you can explore data in Discover, create an index pattern that maps to your Elasticsearch index.
-
On the Kibana homepage, click the
 icon in the upper-left corner to show the names of tabs in the left-side navigation pane.
 -
In the left-side navigation pane, click Stack Management under Management.
-
In the Kibana section, click Index Patterns.
-
Click Create index pattern.
-
Enter an index pattern name in the Index pattern name field, then click Next step. This guide uses
nginx*.
-
Set the Time field parameter, then click Create index pattern. This guide uses
@timestamp.ImportantIf you delete indexes whose names start with
.kibana, all index patterns are lost.
Explore data in Discover
-
In the left-side navigation pane, click Discover under Kibana.
-
Select the
nginx*index pattern from the drop-down list.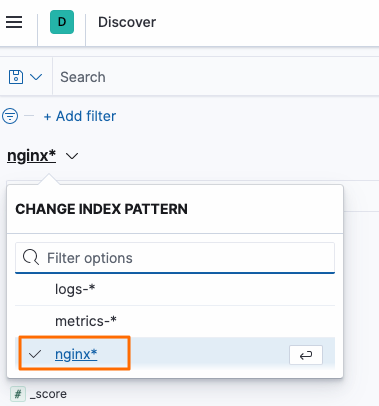
-
On the right side of the Discover page or in the histogram, select a time range to view data within that period. For time filter configuration options, see Configure a time filter.

More features on the Discover page
Overview of the Discover page

Configure a time filter
The time filter controls the time range used to query data. By default, it is set to the previous 15 minutes. Use any of the following methods to change the time range:
-
Time picker icon: Click the
 icon and specify a time range.
Option Description Quick select Select a recent time range and use the back and forward arrows to move between ranges. Commonly used Select a preset range such as Last 15 minutes, Today, or This week. Recently used date ranges Reuse a time range you previously applied. Refresh every Set an automatic refresh frequency. 
-
Start or end time: Click the start time or end time. In the time picker that appears, select Absolute, Relative, or Now, then specify the time.

-
Histogram selection: Select a time range directly from the histogram.
-
Click a bar to zoom in on that time range.
-
Click and drag to select a custom time range.
-
Select an interval from the drop-down list.
Note To start a click-and-drag selection, move the pointer over the histogram background first. The pointer changes to a plus sign when it is over a valid start point.
-
Search for data
Use KQL to search for data. As you type a search query in the search bar, Discover suggests related fields, values, and operators. For more information about KQL syntax, see Kibana query syntax in the open source Kibana documentation.

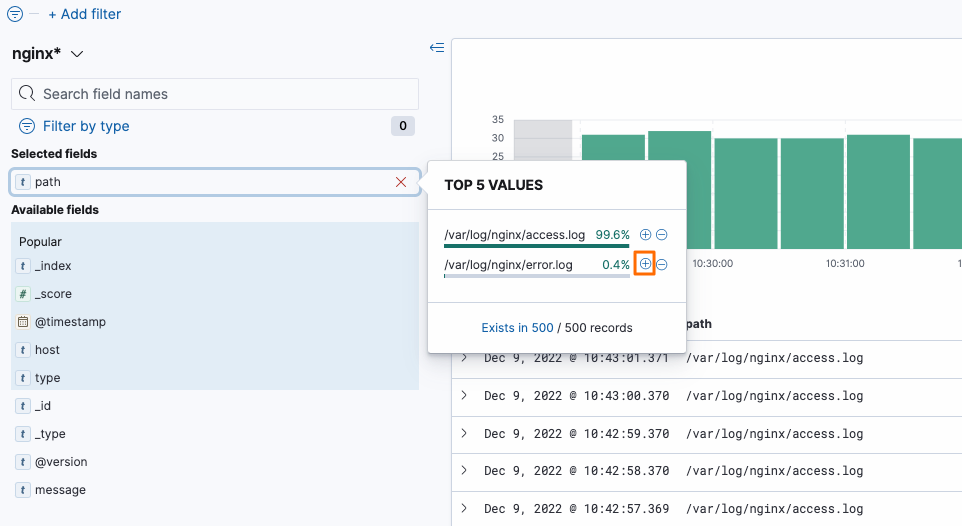
Modify displayed fields
After a search, Discover shows all matching documents and displays the time field and _source field by default. To add a specific field, click the + icon next to the field name.

For example, to display /var/log/nginx/error.log, click + next to that path in the field list.
View a document
Expand a document to view its fields and apply filters. To see documents that occurred immediately before or after the selected document, click View surrounding documents in the upper-right corner. To open a single document on its own page, click View single document.

Troubleshooting
No histogram appears after creating an index pattern
Check whether the index contains time-series data. Open the index mappings and verify that at least one field has the type timestamp. If no such field exists, the histogram cannot render because Discover has no time field to plot.
Searches return no results even though I enter a complete field value
This is caused by the tokenizer behavior in Alibaba Cloud Elasticsearch clusters. Add a wildcard * to the field value in your search query to match tokenized terms.