Heartbeat is a lightweight daemon that periodically checks whether your services are reachable and generates visual charts in Kibana. This topic walks you through configuring an ICMP monitor and an HTTP monitor, deploying Heartbeat on an Elastic Compute Service (ECS) instance, and viewing the collected uptime data.
Background information
Heartbeat checks whether services are reachable — not whether they are running. Unlike most Beats shippers that must be installed on edge nodes, Heartbeat can be installed on a separate machine or even outside the network where the monitored services are deployed.
Heartbeat supports three monitor types:
Monitor type | What it checks | Notes |
ICMP monitor | Host reachability using ICMPv4 or ICMPv6 Echo Requests | Tells you whether a host is up and connected to the network, but does not tell you whether a service on that host is running. Requires root privileges. |
TCP monitor | Whether a service is accessible by sending and receiving payloads over TCP | Supports SSL, Transport Layer Security (TLS), and some proxy settings. |
HTTP monitor | Whether a service returns expected status codes, response headers, or response content over HTTP | Supports SSL, TLS, and some proxy settings. |
Prerequisites
Before you begin, make sure you have:
An Alibaba Cloud Elasticsearch cluster. For more information, see Create an Alibaba Cloud Elasticsearch cluster.
The Auto Indexing feature enabled on the Elasticsearch cluster. Alibaba Cloud Elasticsearch disables Auto Indexing by default for security reasons, but Beats requires it. Enable Auto Indexing when you select Elasticsearch as the Output for a shipper. For more information, see Access and configure an Elasticsearch cluster.
An ECS instance in the same virtual private cloud (VPC) as the Elasticsearch cluster. For more information, see Create an instance on the Custom Launch tab.
ImportantBeats supports only Alibaba Cloud Linux (Alinux), Red Hat Enterprise Linux (RHEL), and CentOS.
Cloud Assistant and Docker installed on the ECS instance. For more information, see Install Cloud Assistant Agent and Deploy and use Docker on ECS instances.
Set up a Heartbeat shipper
Log on to the Alibaba Cloud Elasticsearch console.
In the left-side navigation pane, click Beats Data Shippers.
In the Create Shipper section, click Heartbeat.
Install and configure the shipper. For more information about the installation steps and YAML configuration file, see Collect the logs of an ECS instance and Prepare a YAML configuration file for a shipper. Configure the
heartbeat.monitorsparameter in heartbeat.yml to define your monitors. The following example configures one ICMP monitor and one HTTP monitor:type— The monitor type. This example usesicmpandhttp.schedule— When to run the monitor.'*/5 * * * * * *'runs the check at fixed 5-second intervals (for example, 10:00:00, 10:00:05).'@every 10s'runs the check every 10 seconds from the time Heartbeat starts.hosts— The servers to ping (ICMP monitor).urls— The URLs to check (HTTP monitor).check.response.status— The expected HTTP status code. Setting this to200marks the service as healthy only when it returns200. The HTTP monitor can also check response headers and response body content — see the open source Heartbeat documentation for all available parameters.
- Selecting Enable Kibana Monitoring enables Heartbeat service monitoring in the Kibana console. - Selecting Enable Kibana Dashboard generates charts in Kibana automatically — no YAML file configuration needed. Because Alibaba Cloud Kibana is deployed in a VPC, enable the Private Network Access feature on the Kibana Configuration page first. For more information, see Configure a public or private IP address whitelist for Kibana.
heartbeat.monitors:
- type: icmp                          # 1
  schedule: '*/5 * * * * * *'        # 2
  hosts: ["47.111.xx.xx"]            # 3
- type: http                          # 1
  urls: ["https://es-cn-xxxxx.kibana.elasticsearch.aliyuncs.com:5601/"]  # 4
  schedule: '@every 10s'             # 2
  check.response.status: 200         # 5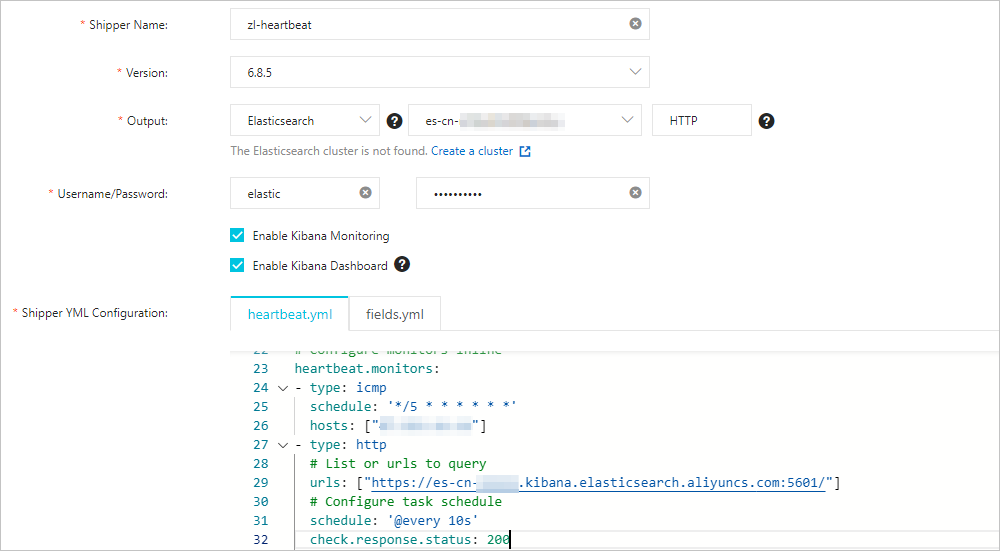
Select the ECS instance on which to install the shipper. The instance must meet all prerequisites listed above.
Click Start. A Start Shipper message appears.
Click Back to Beats Shippers. In the Manage Shippers section of the Beats Data Shippers page, find your shipper and wait for the state to change to Enabled 1/1.
Click View Instances in the Actions column. In the View Instances panel, confirm that Installed Shippers shows Normal Heartbeat. This confirms the shipper is running on the ECS instance.
View the results
Log on to the Kibana console. For more information, see Log on to the Kibana console.
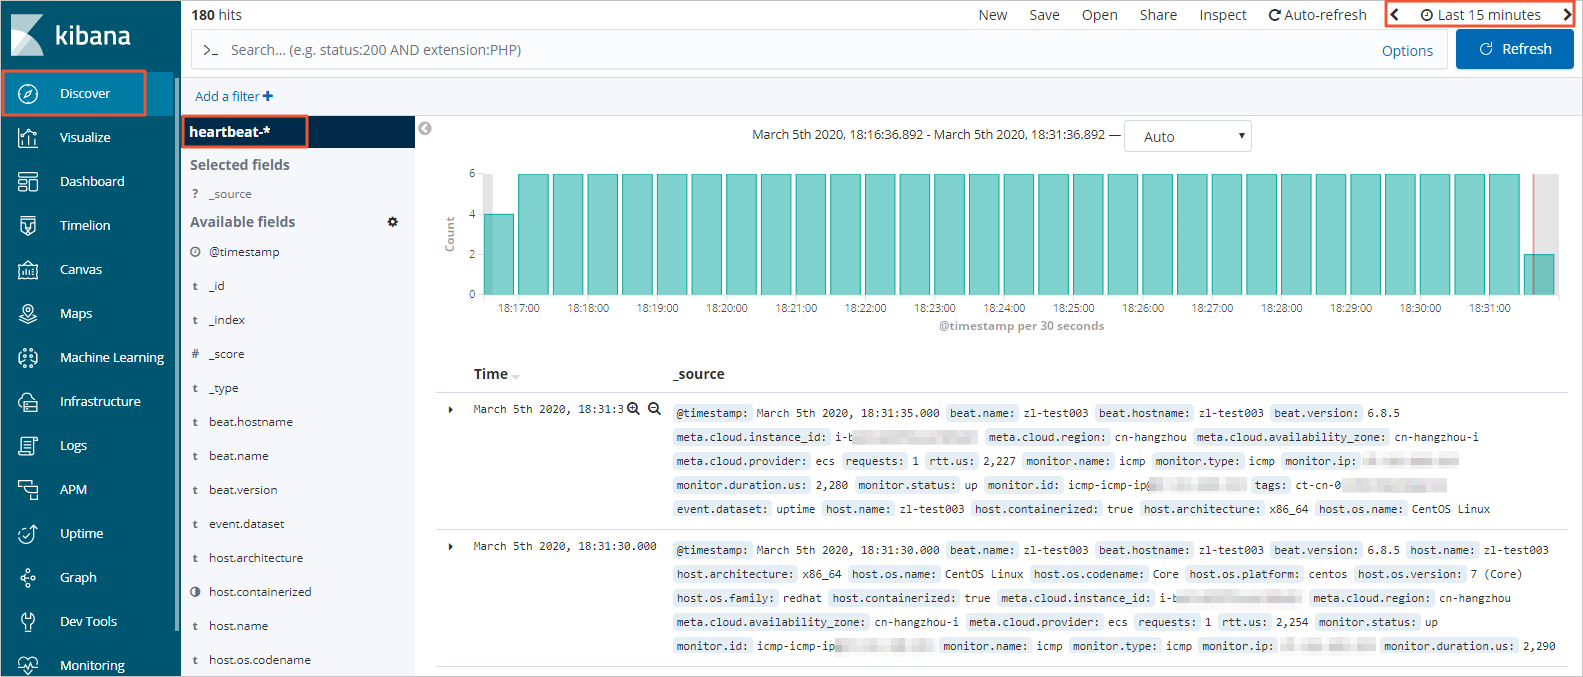
In the left-side navigation pane, click Discover. Select heartbeat-\* from the drop-down list in the upper-left corner, then set a time range in the upper-right corner to view the data Heartbeat collected during that period. > Tip: If no data appears, expand the time range.
In the left-side navigation pane, click Dashboard.
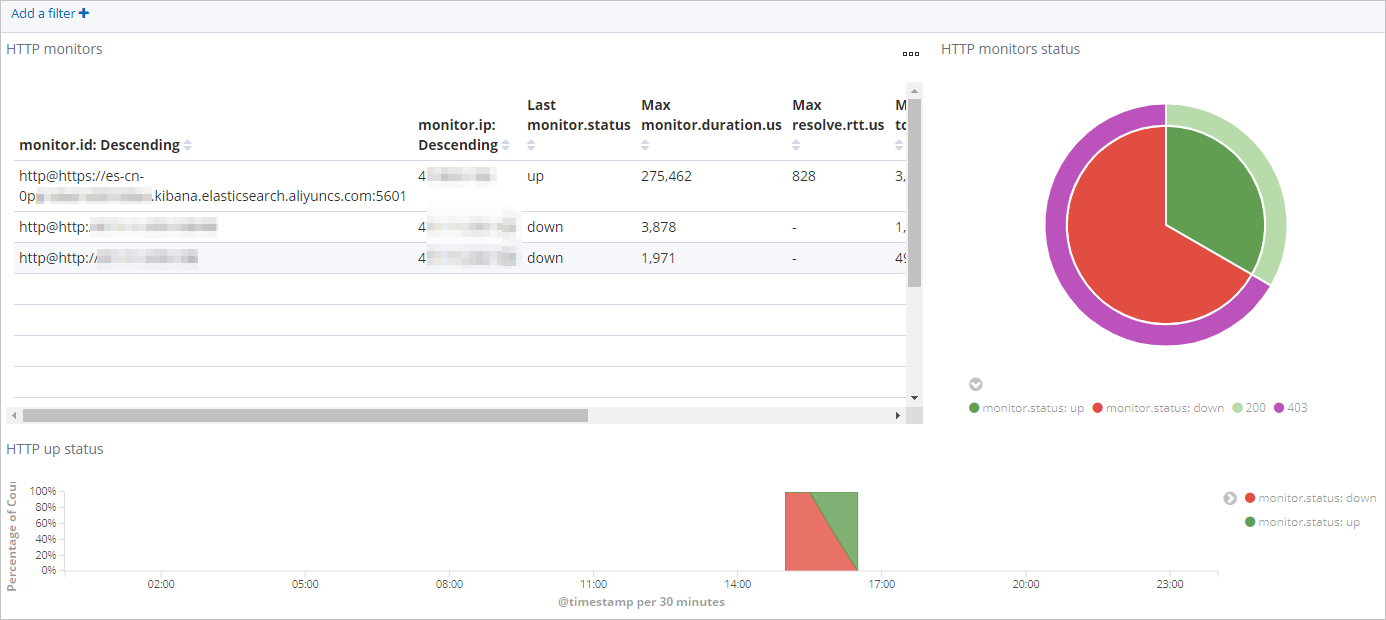
In the Dashboards section, click Heartbeat HTTP monitoring. Set a time range in the upper-right corner to view HTTP status statistics for that period.