When containers running in a Kubernetes cluster generate logs, expose metrics, and serve traffic, diagnosing issues requires correlating data across all three signal types. Elastic Stack addresses this by centralizing logs (Filebeat), infrastructure and application metrics (Metricbeat), and application performance data (Elastic APM) in a single Kibana console—so you can move from a pod alert to a root-cause trace without switching tools.
This guide walks through deploying each component in an Alibaba Cloud Container Service for Kubernetes (ACK) cluster.
Prerequisites
Before you begin, make sure you have:
An Alibaba Cloud Elasticsearch cluster (V6.8) with a whitelist configured and Auto Indexing enabled. See Create an Alibaba Cloud Elasticsearch cluster, Configure a public or private IP address whitelist for an Elasticsearch cluster, and Configure the YML file
An ACK cluster (version 1.18.8-aliyun.1) with pods running; each Elastic Compute Service (ECS) node in this example has 2 vCPUs and 8 GiB of memory. See Create an ACK managed cluster
kubectl configured and able to connect to your ACK cluster. See Obtain the kubeconfig file of a cluster and use kubectl to connect to the cluster
Version compatibility
The official Metricbeat and Filebeat configuration files use the extensions/v1beta1 API version for DaemonSets and Deployments. This version is deprecated in ACK V1.18 and later. Before you apply any configuration, change all DaemonSet, Deployment, and ReplicaSet definitions to use apps/v1.
If you skip this step, deployment will fail with:
no matches for kind "DaemonSet" in version "extensions/v1beta1"Collect metrics with Metricbeat
Metricbeat uses two Kubernetes controllers:
| Controller | Purpose |
|---|---|
| DaemonSet | Runs one pod per node to collect host metrics, system metrics, Docker statistics, and per-node service metrics |
| Deployment | Runs a single instance to collect cluster-level data: Kubernetes events and kube-state-metrics |
This example uses both controllers. You can use either one alone.
Metricbeat depends on kube-state-metrics. By default, ACK deploys kube-state-metrics in the arms-prom namespace. Confirm it is running before you proceed.
Step 1: download the configuration file
curl -L -O https://raw.githubusercontent.com/elastic/beats/6.8/deploy/kubernetes/metricbeat-kubernetes.yamlStep 2: configure the file
2a. Set environment variables
In both kind: DaemonSet and kind: Deployment, set the following variables to match your cluster:
env:
- name: ELASTICSEARCH_HOST
  value: es-cn-nif23p3mo0065****.elasticsearch.aliyuncs.com
- name: ELASTICSEARCH_PORT
  value: "9200"
- name: ELASTICSEARCH_USERNAME
  value: elastic
- name: ELASTICSEARCH_PASSWORD
  value: ****
- name: KIBANA_HOST
  value: es-cn-nif23p3mo0065****-kibana.internal.elasticsearch.aliyuncs.com
- name: KIBANA_PORT
value: "5601"The downloaded file does not include Kibana variables by default. Add them using the env parameter as shown above.
| Parameter | Description |
|---|---|
ELASTICSEARCH_HOST | Internal endpoint of your Elasticsearch cluster |
ELASTICSEARCH_PORT | Private port of your Elasticsearch cluster |
ELASTICSEARCH_USERNAME | Username for your Elasticsearch cluster. Default: elastic |
ELASTICSEARCH_PASSWORD | Password for the elastic user |
KIBANA_HOST | Internal endpoint of Kibana |
KIBANA_PORT | Private port of Kibana |
2b. Add spec.selector to DaemonSet and Deployment
## kind: DaemonSet
spec:
  selector:
    matchLabels:
       k8s-app: metricbeat
  template:
    metadata:
      labels:
        k8s-app: metricbeat

## kind: Deployment
spec:
  selector:
    matchLabels:
       k8s-app: metricbeat
  template:
    metadata:
      labels:
        k8s-app: metricbeat
2c. Configure Elasticsearch and Kibana output
In both metricbeat-daemonset-config and metricbeat-deployment-config:
output.elasticsearch:
      hosts: ['${ELASTICSEARCH_HOST:elasticsearch}:${ELASTICSEARCH_PORT:9200}']
      username: ${ELASTICSEARCH_USERNAME}
      password: ${ELASTICSEARCH_PASSWORD}
setup.kibana:
      host: "https://${KIBANA_HOST}:${KIBANA_PORT}"
setup.dashboards.enabled: true
2d. Configure DaemonSet modules
The metricbeat-daemonset-modules ConfigMap defines which metrics each node collects. The System module collects CPU, load, memory, network, and filesystem metrics. The Kubernetes module collects node, pod, container, and volume data.
For available metricsets, see System module and Kubernetes module.
apiVersion: v1
kind: ConfigMap
metadata:
  name: metricbeat-daemonset-modules
  namespace: kube-system
  labels:
    k8s-app: metricbeat
data:
  system.yml: |-
    - module: system
      period: 10s
      metricsets:
        - cpu
        - load
        - memory
        - network
        - process
        - process_summary
        - core
        - diskio
        - socket
      processes: ['.*']
      process.include_top_n:
        by_cpu: 5      # include top 5 processes by CPU
        by_memory: 5   # include top 5 processes by memory

    - module: system
      period: 1m
      metricsets:
        - filesystem
        - fsstat
      processors:
      - drop_event.when.regexp:
          system.filesystem.mount_point: '^/(sys|cgroup|proc|dev|etc|host|lib)($|/)'
  kubernetes.yml: |-
    - module: kubernetes
      metricsets:
        - node
        - system
        - pod
        - container
        - volume
      period: 10s
      host: ${NODE_NAME}
      hosts: ["localhost:10255"]
2e. Configure Deployment modules
The metricbeat-deployment-modules ConfigMap collects kube-state-metrics and Kubernetes events.
Metricbeat runs in kube-system. kube-state-metrics runs in arms-prom by default. Because they are in different namespaces, set hosts to kube-state-metrics.<namespace>:8080. If both services are in the same namespace, use kube-state-metrics:8080.
apiVersion: v1
kind: ConfigMap
metadata:
  name: metricbeat-deployment-modules
  namespace: kube-system
  labels:
    k8s-app: metricbeat
data:
  # This module requires `kube-state-metrics` up and running under `kube-system` namespace
  kubernetes.yml: |-
    - module: kubernetes
      metricsets:
        - state_node
        - state_deployment
        - state_replicaset
        - state_pod
        - state_container
      period: 10s
      host: ${NODE_NAME}
      hosts: ["kube-state-metrics.arms-prom:8080"]
      # Uncomment this to get k8s events:
    - module: kubernetes
      metricsets:
        - event
2f. Configure role-based access control (RBAC)
Create a ClusterRole and bind it to Metricbeat's ServiceAccount so Metricbeat can read ACK cluster resources:
apiVersion: rbac.authorization.k8s.io/v1beta1
kind: ClusterRoleBinding
metadata:
  name: metricbeat
subjects:
- kind: ServiceAccount
  name: metricbeat
  namespace: kube-system
roleRef:
  kind: ClusterRole
  name: metricbeat
  apiGroup: rbac.authorization.k8s.io
---
apiVersion: rbac.authorization.k8s.io/v1beta1
kind: ClusterRole
metadata:
  name: metricbeat
  labels:
    k8s-app: metricbeat
rules:
- apiGroups: [""]
  resources:
  - nodes
  - namespaces
  - events
  - pods
  verbs: ["get", "list", "watch"]
- apiGroups: ["extensions"]
  resources:
  - replicasets
  verbs: ["get", "list", "watch"]
- apiGroups: ["apps"]
  resources:
  - statefulsets
  - deployments
  verbs: ["get", "list", "watch"]
- apiGroups:
  - ""
  resources:
  - nodes/stats
  verbs:
  - get
---
apiVersion: v1
kind: ServiceAccount
metadata:
  name: metricbeat
  namespace: kube-system
  labels:
    k8s-app: metricbeat
---
Step 3: deploy Metricbeat and verify
kubectl apply -f metricbeat-kubernetes.yaml
kubectl get pods -n kube-systemAll pods must show Running status before metrics appear in Kibana. If any pod is not running, check its logs with kubectl logs <pod-name> -n kube-system before proceeding.
Step 4: view metrics in Kibana
Log on to the Kibana console. See Log on to the Kibana console.
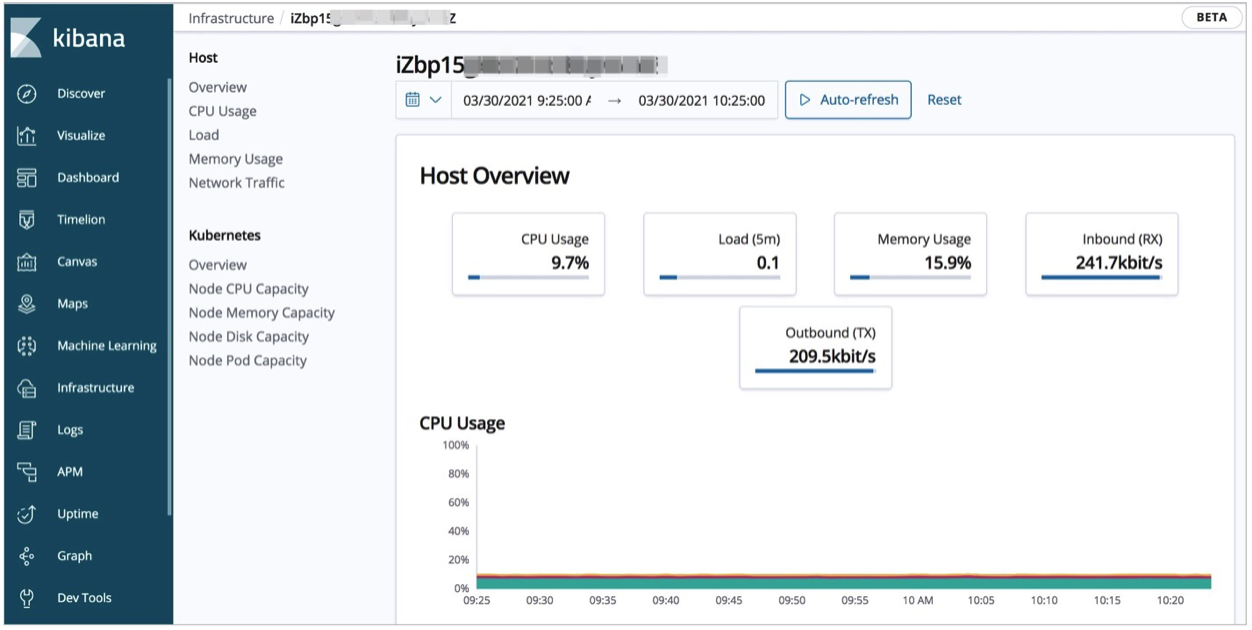
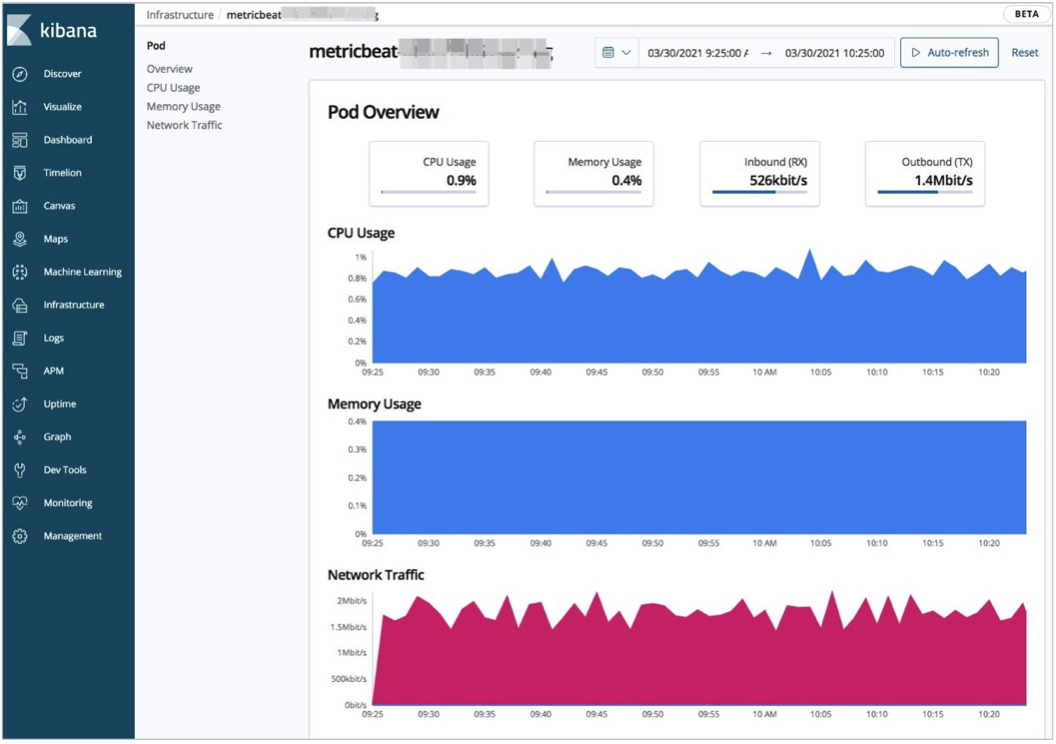
Click Infrastructure in the left-side navigation pane.
View host and pod metrics:
Host metrics: Click Hosts in the upper-right corner. On the Map View tab, click a host and select View metrics to see CPU, load, and memory statistics.
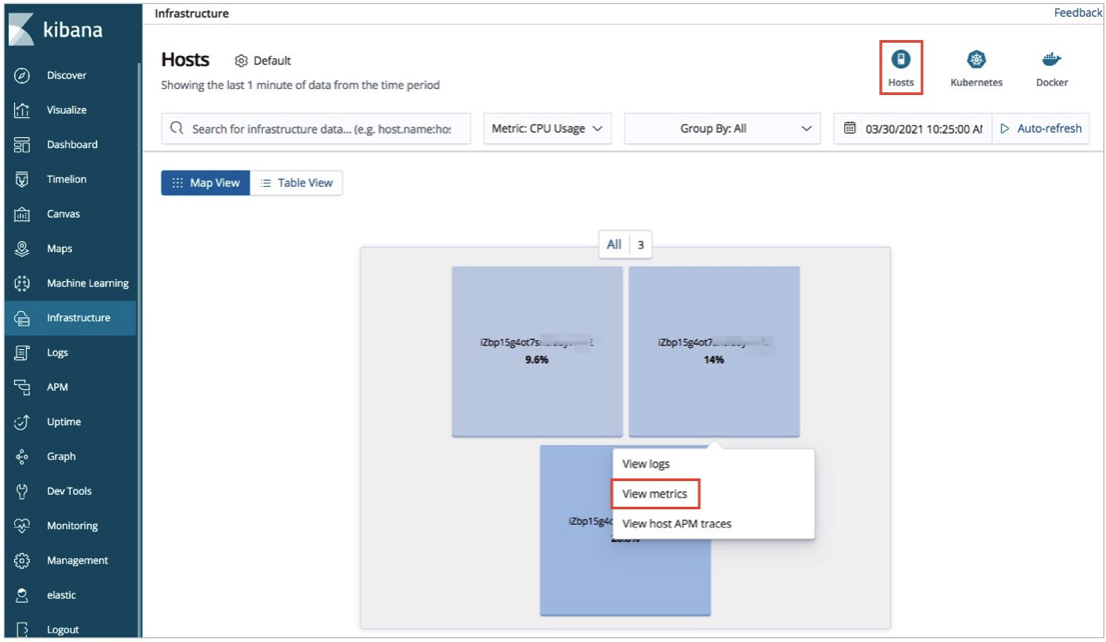
Pod metrics: Click Kubernetes in the upper-right corner. On the Map View tab, click a pod and select View metrics to see CPU, memory, and network statistics.
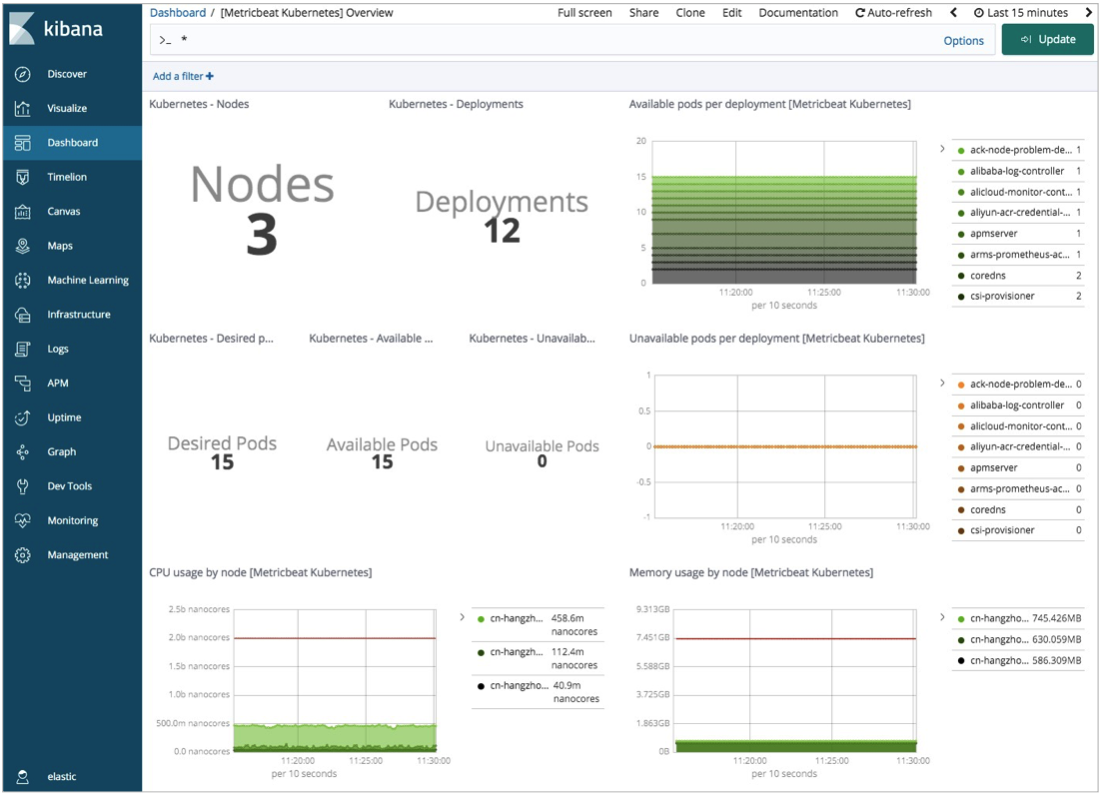
To view a cluster-wide resource summary, click Dashboard in the left-side navigation pane, then open [Metricbeat Kubernetes] Overview.
Collect logs with Filebeat
Filebeat runs as a DaemonSet, placing one pod on each node to collect container logs. The resources in this example are deployed in the kube-system namespace. Edit the configuration file to deploy to a different namespace.
Step 1: download the configuration file
curl -L -O https://raw.githubusercontent.com/elastic/beats/6.8/deploy/kubernetes/filebeat-kubernetes.yamlStep 2: configure the file
2a. Set environment variables in kind: DaemonSet
env:
- name: ELASTICSEARCH_HOST
  value: es-cn-nif23p3mo0065****.elasticsearch.aliyuncs.com
- name: ELASTICSEARCH_PORT
  value: "9200"
- name: ELASTICSEARCH_USERNAME
  value: elastic
- name: ELASTICSEARCH_PASSWORD
  value: ****
- name: KIBANA_HOST
  value: es-cn-nif23p3mo0065****-kibana.internal.elasticsearch.aliyuncs.com
- name: KIBANA_PORT
  value: "5601"
- name: NODE_NAME
  valueFrom:
     fieldRef:
fieldPath: spec.nodeName| Parameter | Description |
|---|---|
ELASTICSEARCH_HOST | Internal endpoint of your Elasticsearch cluster |
ELASTICSEARCH_PORT | Private port of your Elasticsearch cluster |
ELASTICSEARCH_USERNAME | Username for your Elasticsearch cluster. Default: elastic |
ELASTICSEARCH_PASSWORD | Password for the elastic user |
KIBANA_HOST | Internal endpoint of Kibana |
KIBANA_PORT | Private port of Kibana |
NODE_NAME | Populated automatically from the node's spec.nodeName field |
2b. Configure Elasticsearch and Kibana output
In the filebeat-config ConfigMap, the environment variables defined in the DaemonSet are referenced here. Update the output section:
output.elasticsearch:
      hosts: ['${ELASTICSEARCH_HOST:elasticsearch}:${ELASTICSEARCH_PORT:9200}']
      username: ${ELASTICSEARCH_USERNAME}
      password: ${ELASTICSEARCH_PASSWORD}
setup.kibana:
      host: "https://${KIBANA_HOST}:${KIBANA_PORT}"
2c. Configure log collection
The filebeat-inputs ConfigMap tells Filebeat to collect logs from all Docker containers and enrich them with Kubernetes metadata:
apiVersion: v1
kind: ConfigMap
metadata:
  name: filebeat-inputs
  namespace: kube-system
  labels:
    k8s-app: filebeat
data:
  kubernetes.yml: |-
    - type: docker
      containers.ids:
      - "*"
      processors:
        - add_kubernetes_metadata:
            host: ${NODE_NAME}
            in_cluster: true
---
Step 3: deploy Filebeat and verify
kubectl apply -f filebeat-kubernetes.yaml
kubectl get pods -n kube-systemAll pods must show Running status before logs appear in Kibana. If any pod is not running, check its logs with kubectl logs <pod-name> -n kube-system before proceeding.
Step 4: view logs in Kibana
Log on to the Kibana console. See Log on to the Kibana console.
Click Infrastructure in the left-side navigation pane.
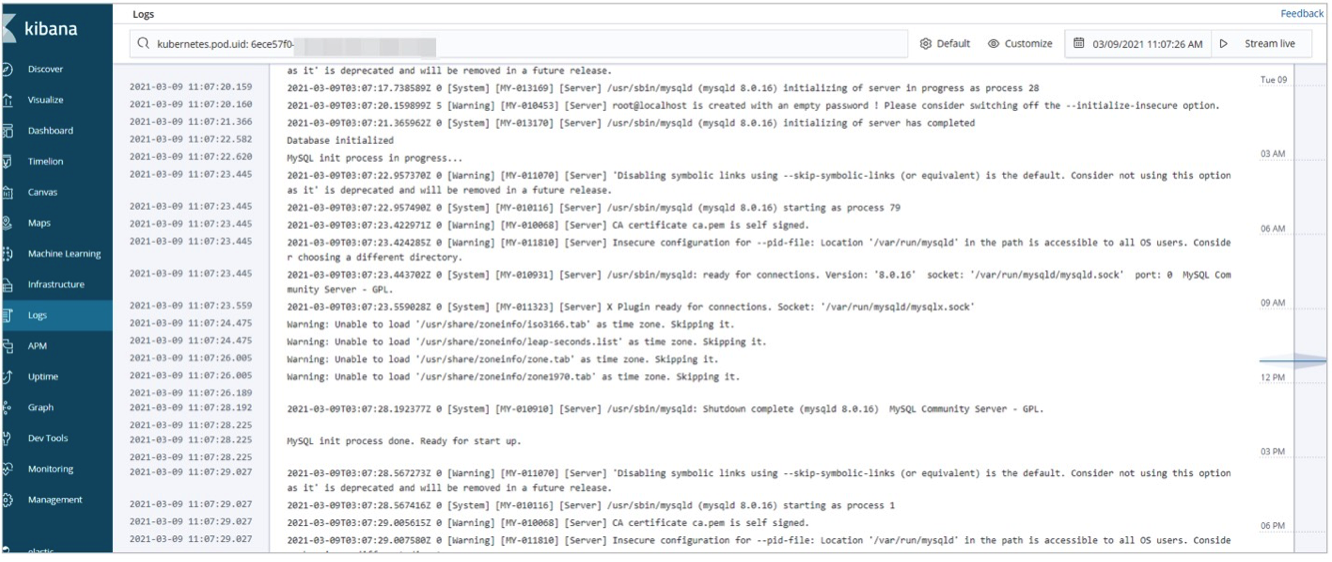
View logs for hosts and pods:
Host logs: Click Hosts in the upper-right corner. On the Map View tab, click a host and select View logs.
Pod logs: Click Kubernetes in the upper-right corner. On the Map View tab, click a pod and select View logs.
Monitor application performance with Elastic APM
Elastic APM collects detailed performance data in real time: response times, database queries, cache calls, and external HTTP requests. It also captures unhandled errors and groups them by stack trace, making it easier to spot recurring issues and track error frequency.
For background on Elastic APM, see Elastic APM overview.
This example instruments a Java application using the Elastic Java APM agent. Elastic APM also supports agents for other languages; refer to the Elastic APM agent documentation for details.
Step 1: deploy APM Server
APM Server runs as a Deployment in the ACK cluster. A ConfigMap defines its configuration, a Service exposes port 8200 for APM agents, and a ServiceAccount scopes its permissions.
1a. Create the APM Server configuration
---
apiVersion: v1
kind: ConfigMap
metadata:
  name: apm-deployment-config
  namespace: kube-system
  labels:
    k8s-app: apmserver
data:
  apm-server.yml: |-
      apm-server.host: "0.0.0.0:8200"
      output.elasticsearch:
         hosts: ['${ELASTICSEARCH_HOST:elasticsearch}:${ELASTICSEARCH_PORT:9200}']
         username: ${ELASTICSEARCH_USERNAME}
         password: ${ELASTICSEARCH_PASSWORD}
      setup.kibana:
         host: "https://${KIBANA_HOST}:${KIBANA_PORT}"

---
apiVersion: apps/v1
kind: Deployment
metadata:
  name: apmserver
  namespace: kube-system
  labels:
    k8s-app: apmserver
spec:
  selector:
    matchLabels:
       k8s-app: apmserver
  template:
    metadata:
      labels:
        k8s-app: apmserver
    spec:
      serviceAccountName: apmserver
      hostNetwork: true
      dnsPolicy: ClusterFirstWithHostNet
      containers:
      - name: apmserver
        image: docker.elastic.co/apm/apm-server:6.8.14
        args: [
          "-c", "/etc/apm-server.yml",
          "-e",
        ]
        env:
        - name: ELASTICSEARCH_HOST
          value: es-cn-oew20i5h90006****.elasticsearch.aliyuncs.com
        - name: ELASTICSEARCH_PORT
          value: "9200"
        - name: ELASTICSEARCH_USERNAME
          value: elastic
        - name: ELASTICSEARCH_PASSWORD
          value: ****
        - name: KIBANA_HOST
          value: es-cn-oew20i5h90006****-kibana.internal.elasticsearch.aliyuncs.com
        - name: KIBANA_PORT
          value: "5601"
        - name: NODE_NAME
          valueFrom:
            fieldRef:
              fieldPath: spec.nodeName
        securityContext:
          runAsUser: 0
        resources:
          limits:
            memory: 50Mi
          requests:
            cpu: 20m
            memory: 30Mi
        volumeMounts:
        - name: config
          mountPath: /etc/apm-server.yml
          readOnly: true
          subPath: apm-server.yml
      volumes:
      - name: config
        configMap:
          defaultMode: 0600
          name: apm-deployment-config
---
apiVersion: v1
kind: Service
metadata:
  name: apmserver
  namespace: kube-system
  labels:
    k8s-app: apmserver
spec:
  clusterIP: None
  ports:
  - name: http-metrics
    port: 8200
    targetPort: 8200
  selector:
    k8s-app: apmserver
---
apiVersion: v1
kind: ServiceAccount
metadata:
  name: apmserver
  namespace: kube-system
  labels:
    k8s-app: apmserver
---The APM Server image version (
6.8.14) must match your Elasticsearch cluster version.Port 8200 is exposed via the Service so APM agents can reach APM Server.
| Parameter | Description |
|---|---|
ELASTICSEARCH_HOST | Internal endpoint of your Elasticsearch cluster |
ELASTICSEARCH_PORT | Private port of your Elasticsearch cluster |
ELASTICSEARCH_USERNAME | Username for your Elasticsearch cluster. Default: elastic |
ELASTICSEARCH_PASSWORD | Password for the elastic user |
KIBANA_HOST | Internal endpoint of Kibana |
KIBANA_PORT | Private port of Kibana |
NODE_NAME | Populated automatically from the node's spec.nodeName field |
1b. Deploy APM Server and verify
kubectl apply -f apm-server.yml
kubectl get pods -n kube-systemAll pods must show Running status before APM data appears in Kibana. If any pod is not running, check its logs with kubectl logs <pod-name> -n kube-system before proceeding.
Step 2: configure APM agents
This example uses a Spring Boot application packaged as a JAR file. The Java APM agent is downloaded from Maven Central and bundled into a Docker image. For Spring Boot setup, see Spring Boot.
2a. Create a Dockerfile named myapply
FROM frolvlad/alpine-oraclejdk8
MAINTAINER peterwanghao.com
VOLUME /tmp
ADD spring-boot-0.0.1-SNAPSHOT.jar spring-boot-0.0.1-SNAPSHOT.jar
ADD elastic-apm-agent-1.21.0.jar elastic-apm-agent-1.21.0.jar
EXPOSE 8080
ENTRYPOINT ["java","-javaagent:/elastic-apm-agent-1.21.0.jar","-Delastic.apm.service_name=my-application","-Delastic.apm.server_url=http://apmserver:8200","-Delastic.apm.application_packages=com.example","-jar","/spring-boot-0.0.1-SNAPSHOT.jar"]
The ENTRYPOINT passes the following Java agent parameters:
| Parameter | Description |
|---|---|
-javaagent | Path to the APM agent JAR |
-Delastic.apm.service_name | Service name. Accepts letters, digits, hyphens, underscores, and spaces |
-Delastic.apm.server_url | APM Server URL. Set to http://apmserver:8200 as defined in apm-server.yml |
-Delastic.apm.application_packages | Base package of your application |
-jar | Path to the application JAR |
2b. Build the Docker image
docker build -t myapply .2c. Load the image onto other nodes
Copy the built image to the other nodes in your ACK cluster.
2d. Create the pod deployment file my-application.yaml
---
apiVersion: v1
kind: Pod
metadata:
  name: my-apply
  namespace: kube-system
  labels:
    app: my-apply
spec:
  containers:
    - name: my-apply
      image: myapply:latest
      ports:
        - containerPort: 8080
      imagePullPolicy: Never
---
apiVersion: v1
kind: Service
metadata:
  name: my-apply
  namespace: kube-system
  labels:
    app: my-apply
spec:
  type: NodePort
  ports:
  - name: http-metrics
    port: 8080
    nodePort: 30000
  selector:
    app: my-apply

---image specifies the image built in step 2b.
2e. Deploy the application
kubectl apply -f my-application.yaml2f. Verify the APM agent
After all pod resources are running, send a test request over port 30000:
curl http://10.7.XX.XX:30000Replace 10.7.XX.XX with the IP address of a node in your ACK cluster. A successful response confirms the APM agent is running and sending data to APM Server.
Step 3: view APM data in Kibana
Log on to the Kibana console. See Log on to the Kibana console.
Click APM in the left-side navigation pane.
Select an application (in this example,
my-application) to view its overall performance statistics.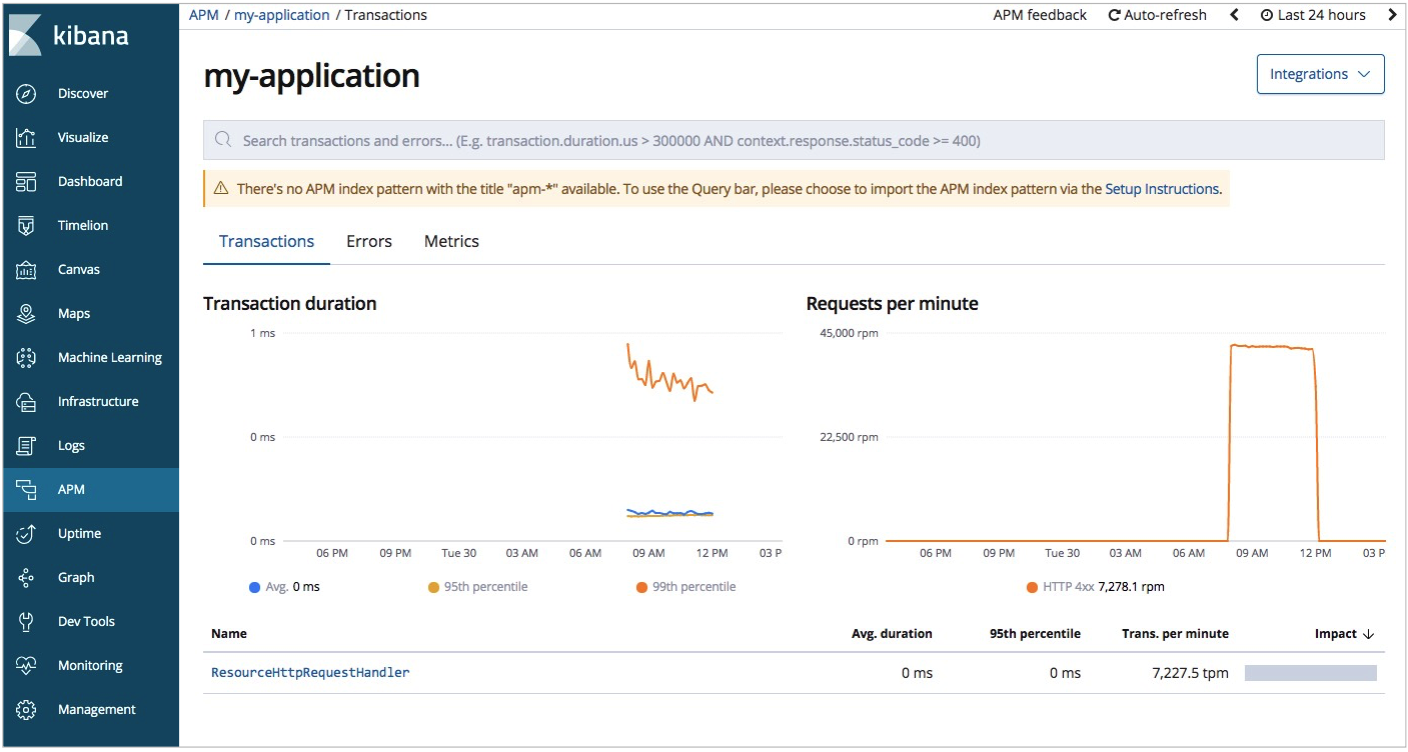
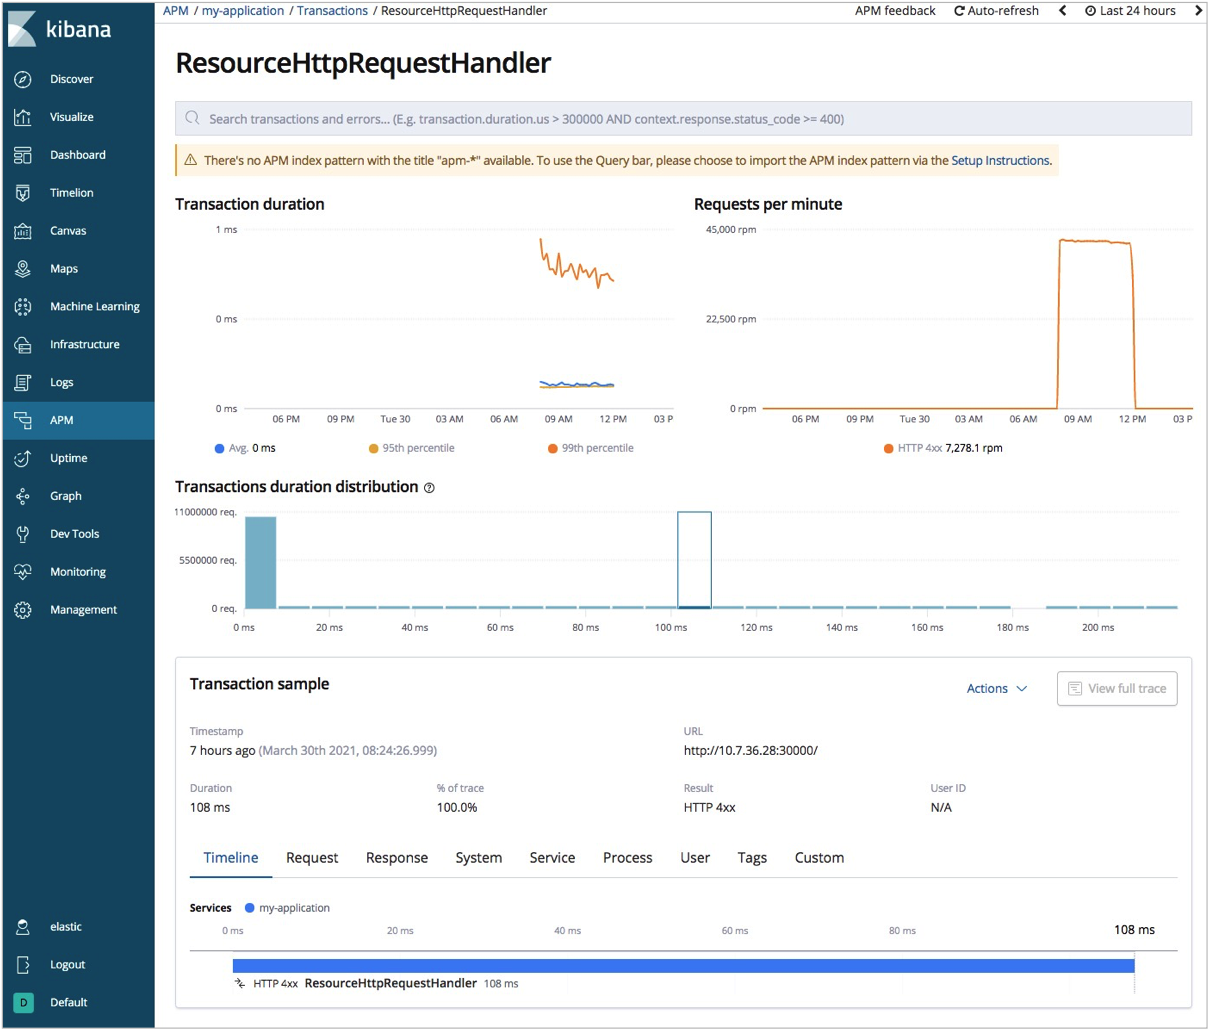
Click a request endpoint to see detailed request information.
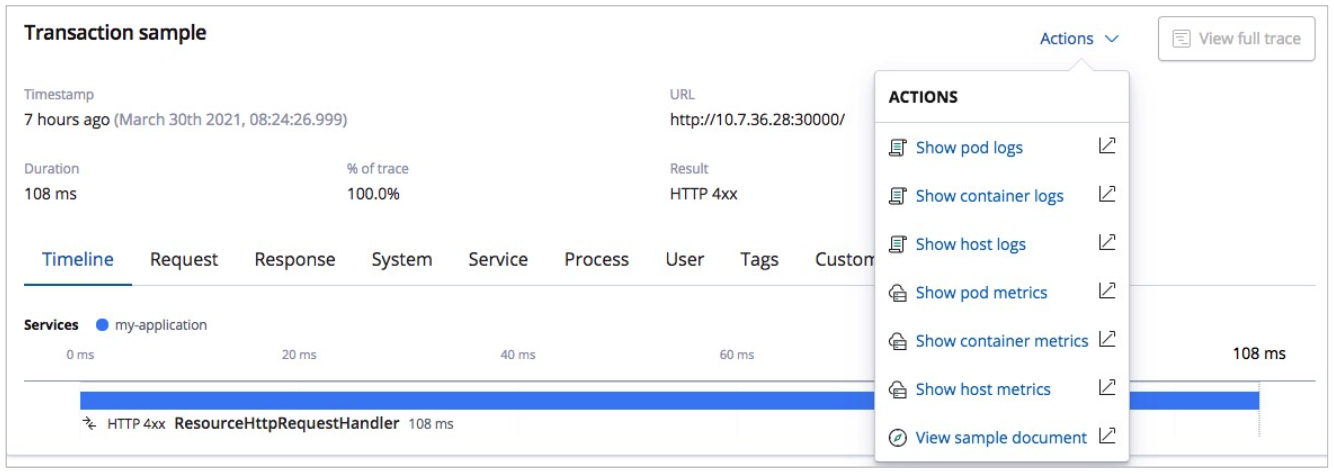
To view pod logs or metrics from the APM view, click Actions and select Show pod logs or Show pod metrics.
FAQ
Pods fail to start because `resources.requests` is set too high
Lower the resources.requests values in the Metricbeat, Filebeat, and Elastic APM configuration files. Set the values to match your ACK cluster's actual node specifications.
Deployment fails with `no matches for kind "DaemonSet" in version "extensions/v1beta1"`
Change all DaemonSet, Deployment, and ReplicaSet definitions to use apps/v1. The official configuration files use extensions/v1beta1, which is deprecated in ACK V1.18 and later.
What to do next
With Metricbeat, Filebeat, and Elastic APM running, you have full observability across your ACK cluster. From here, you can:
Set up alerts: Use Kibana's alerting features to notify your team when metrics cross thresholds or errors spike
Customize dashboards: Clone and extend the built-in Metricbeat Kubernetes dashboard to surface the metrics most relevant to your workloads
Tune resource requests: Adjust
resources.requestsandresources.limitsin each component's configuration to match your cluster's capacityExtend APM coverage: Add the Elastic APM agent to other services in your cluster using the same pattern shown in this guide