Elasticsearch Machine Learning is a tool that you can use to perform intelligent detection and prediction on data in Elasticsearch based on the machine learning technology. The tool can automatically identify data patterns and anomalies that occur in the data, and generate new features and aggregation results, which can support data analysis and data use. Elasticsearch Machine Learning can improve the availability and value of data and provide more intelligent and efficient data analysis and use solutions. This topic describes how to perform unsupervised and supervised machine learning.
Background information
Elasticsearch Machine Learning supports two learning modes: unsupervised machine learning and supervised machine learning.
Unsupervised machine learning can be used to detect anomalies that occur in data in scenarios such as single metric-based detection and population. In unsupervised machine learning mode, you do not need to train a task to learn about what an anomaly is. A machine learning algorithm can automatically detect anomalous patterns or anomalies that occur in data.
Supervised machine learning is suitable for scenarios such as regression and classification and can resolve complex issues based on regression and classification algorithms. Supervised machine learning requires that you use specific data to train a prediction task. Then, you can use the task to classify new data and perform prediction on the data.
Scenario category | Scenario | Mode of machine learning | Description |
Anomaly detection | Single metric-based detection | Unsupervised | In this scenario, anomalies are detected in only a single time series, and data analysis is performed on only one index field. |
Multi-metric-based detection | Unsupervised | In this scenario, anomalies are detected based on one or more metrics, and metrics may be split for analysis based on business requirements. Data analysis is performed on multiple index fields. | |
Population | Unsupervised | Actual behaviors are compared with behaviors in the population to detect anomalous behaviors. The population is the collection of individuals, things, or phenomena that may be studied in a specific field. | |
Advanced use of machine learning tasks | Unsupervised | More options and settings are provided, which allows you to tailor your machine learning tasks to different scenarios and data types and optimize the tasks for advanced scenarios. | |
Categorization | Unsupervised | In this scenario, unsupervised machine learning can be used to identify and analyze the features and patterns in log messages, categorize the log messages, and detect anomalies in the log messages. | |
Data frame analytics | Outlier detection | Unsupervised | Clustering and anomaly detection algorithms are used to train tasks. These tasks can be used to quickly identify anomalous behaviors or anomalies that occur in data. |
Regression | Supervised | Regression prediction is performed on data values in datasets. | |
Classification | Supervised | Classification prediction is performed on data points in datasets to determine the categories of the data points. |
Preparations
Create an Alibaba Cloud Elasticsearch cluster. In this example, an Elasticsearch V8.5 cluster is created. For more information, see Create an Alibaba Cloud Elasticsearch cluster.
NoteThe use methods of the machine learning technology in Elasticsearch clusters of different versions may differ. For more information, see What is Elastic Machine Learning?
Log on to the Kibana console of the Elasticsearch cluster. For more information, see Log on to the Kibana console.
Add sample data.
On the homepage of the Kibana console, click Try sample data in the Get started by adding integrations section.
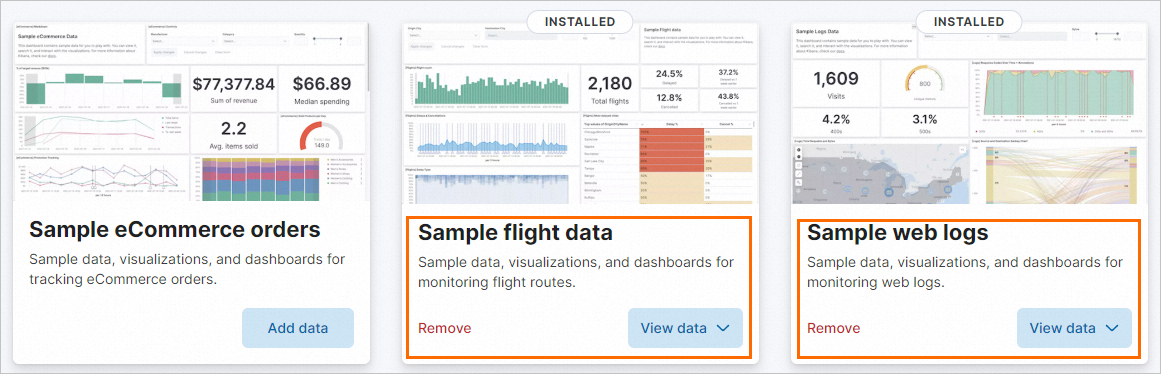
On the Sample data tab of the page that appears, click Other sample data sets.
Separately click Add data in the Sample flight data and Sample web logs cards.
If Add data changes to View data, the datasets are added. After the datasets are added, Kibana automatically creates the kibana_sample_data_flights index and the kibana_sample_data_logs index.
Create machine learning tasks
This section describes the practices of unsupervised machine learning and supervised machine learning.
Create a machine learning task based on a single metric
In this example, an unsupervised machine learning task is created based on a single metric to analyze sample data in the Sample web logs dataset that is provided by Kibana. This dataset provides simulation data of accessing a web server. You can use the task to analyze the access behaviors of users, optimize website performance, and detect anomalous access behaviors.
The following code shows a data record in the Sample web logs dataset:
{
  "_index": "kibana_sample_data_logs",
  "_type": "_doc",
  "_id": "n6GHI4gBmNQSVxOwNnPn",
  "_version": 1,
  "_score": null,
  "_source": {
    "agent": "Mozilla/5.0 (X11; Linux i686) AppleWebKit/534.24 (KHTML, like Gecko) Chrome/11.0.696.50 Safari/534.24",
    "bytes": 847,
    "clientip": "122.62.233.59",
    "extension": "",
    "geo": {
      "srcdest": "CN:CO",
      "src": "CN",
      "dest": "CO",
      "coordinates": {
        "lat": 31.24905556,
        "lon": -82.39530556
      }
    },
    "host": "www.elastic.co",
    "index": "kibana_sample_data_logs",
    "ip": "122.62.233.59",
    "machine": {
      "ram": 4294967296,
      "os": "win xp"
    },
    "memory": null,
    "message": "122.62.233.59 - - [2018-08-21T02:34:54.901Z] \"GET /logging HTTP/1.1\" 200 847 \"-\" \"Mozilla/5.0 (X11; Linux i686) AppleWebKit/534.24 (KHTML, like Gecko) Chrome/11.0.696.50 Safari/534.24\"",
    "phpmemory": null,
    "referer": "http://twitter.com/success/paul-w-richards",
    "request": "/logging",
    "response": 200,
    "tags": [
      "success",
      "info"
    ],
    "timestamp": "2023-06-06T02:34:54.901Z",
    "url": "https://www.elastic.co/solutions/logging",
    "utc_time": "2023-06-06T02:34:54.901Z",
    "event": {
      "dataset": "sample_web_logs"
    }
  },
  "fields": {
    "@timestamp": [
      "2023-06-06T02:34:54.901Z"
    ],
    "utc_time": [
      "2023-06-06T02:34:54.901Z"
    ],
    "hour_of_day": [
      2
    ],
    "timestamp": [
      "2023-06-06T02:34:54.901Z"
    ]
  },
  "sort": [
    1686018894901
  ]
}You can use Transforms to aggregate input data into statistics or a higher level of metrics and store the aggregation result in a new index. This helps improve query performance, reduce response time, and provide fundamental data for subsequent analysis and machine learning.
Click the
 icon in the upper-left corner of the Kibana console. In the left-side navigation pane, choose Analytics > Machine Learning.
 In the left-side navigation pane of the page that appears, choose .
On the Anomaly Detection Jobs page, click Create job.
Select the kibana_sample_data_logs index.
In the Use a wizard section of the Create a job from the data view Kibana Sample Data Logs page, click Single metric to create a single-metric job.
Configure the single-metric job.
In the Time range step, click Use full data, and click Next.
NoteThe sample dataset provides only a small amount of data. In this example, all data in the kibana_sample_data_logs index is used.
In the Pick fields step, select Count(Event rate) from the drop-down list, configure the Bucket span and Sparse data parameters, and then click Next.
NoteCount(Event rate) is a metric in a single-metric view. The value of this metric reflects the number of times that the server responds to requests within each second. This metric can be used as an objective of anomaly detection.
Bucket span: defines the interval for time series analysis. This parameter is used to split time series data into different parts for subsequent analysis and prediction. You can configure this parameter based on your business requirements.
Sparse data: specifies whether to consider data that does not have values as an exception. In machine learning, sparse data refers to data that does not have values or data whose values are missing.
In the Job details step, enter an ID in the Job ID field and enter a description in the Job description field. Then, click Next.
In the Validation step, if the validation on the time range and the task memory limit is passed, click Next.
In the Summary step, click Create job in the lower part of the page.
Elasticsearch displays the data based on time series, analyzes and studies the data, creates a task based on the data, and evaluates subsequent data.
NoteWhen you create a job, a specific amount of time is required to perform validation. The actual time that is consumed varies based on the size of data in the related index.
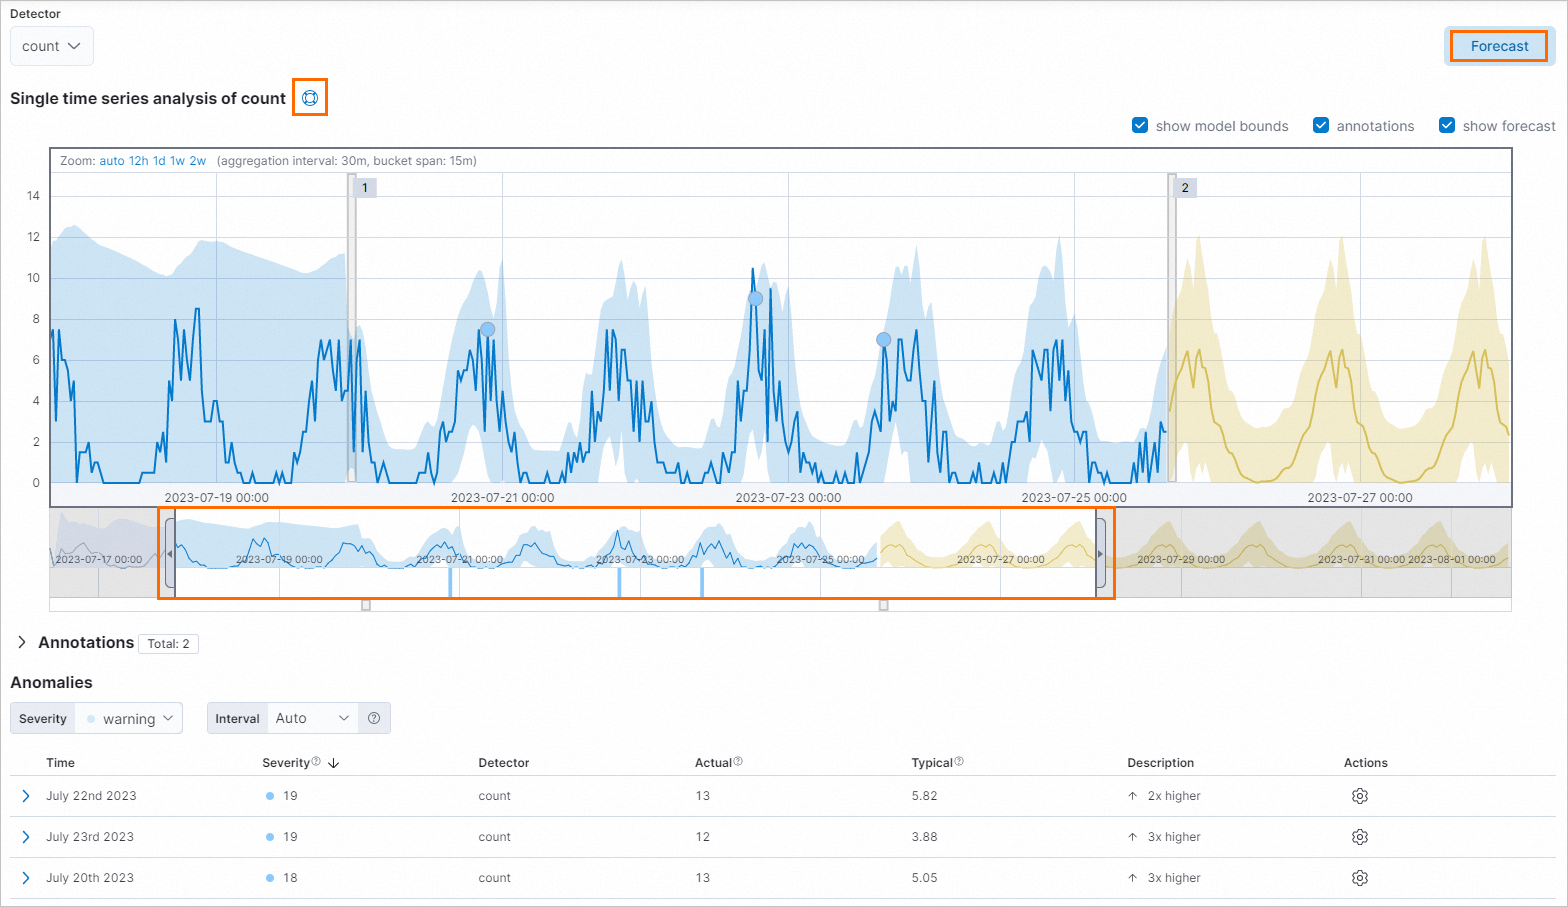
After the job is created, click View results in the lower-left corner of the page to view the result.
On the Single Metric Viewer page, click the
 icon next to Single time series analysis of count to view the description of single time series analysis.
 Drag the left or right edge of the timeline or move the timeline to select a time range in which you want to perform anomaly detection.
Click Forecast on the Single Metric Viewer page to perform a prediction on subsequent data.
Create an inference machine learning task
Train a flight delay prediction task
In this example, a supervised machine learning task for flight delay prediction is trained by using regression algorithms based on specific historical data in a sample dataset that is provided by Kibana. The sample dataset is named Sample flight data and provides simulated flight data. The task can provide important reference information for airways and passengers and help passengers better schedule itineraries and flights.
The following code shows a data record in the Sample flight data dataset:
{
  "_index": "kibana_sample_data_flights",
  "_type": "_doc",
  "_id": "7b0aeogBmNQSVxOwslB_",
  "_version": 1,
  "_score": null,
  "_source": {
    "FlightNum": "QYX9S3I",
    "DestCountry": "CH",
    "OriginWeather": "Cloudy",
    "OriginCityName": "Chicago",
    "AvgTicketPrice": 824.8516378170061,
    "DistanceMiles": 4442.909325899777,
    "FlightDelay": false,
    "DestWeather": "Thunder & Lightning",
    "Dest": "Zurich Airport",
    "FlightDelayType": "No Delay",
    "OriginCountry": "US",
    "dayOfWeek": 4,
    "DistanceKilometers": 7150.1694661808515,
    "timestamp": "2023-06-02T07:28:15",
    "DestLocation": {
      "lat": "47.464699",
      "lon": "8.54917"
    },
    "DestAirportID": "ZRH",
    "Carrier": "Logstash Airways",
    "Cancelled": false,
    "FlightTimeMin": 420.59820389299125,
    "Origin": "Chicago O'Hare International Airport",
    "OriginLocation": {
      "lat": "41.97859955",
      "lon": "-87.90480042"
    },
    "DestRegion": "CH-ZH",
    "OriginAirportID": "ORD",
    "OriginRegion": "US-IL",
    "DestCityName": "Zurich",
    "FlightTimeHour": 7.009970064883188,
    "FlightDelayMin": 0
  }
}
Click the
 icon in the upper-left corner of the Kibana console. In the left-side navigation pane, choose Analytics > Machine Learning.
 In the left-side navigation pane of the page that appears, choose .
On the Data Frame Analytics Jobs page, click Create job.
On the New analytics job / Choose a source data view page, select the kibana_sample_data_logs index.
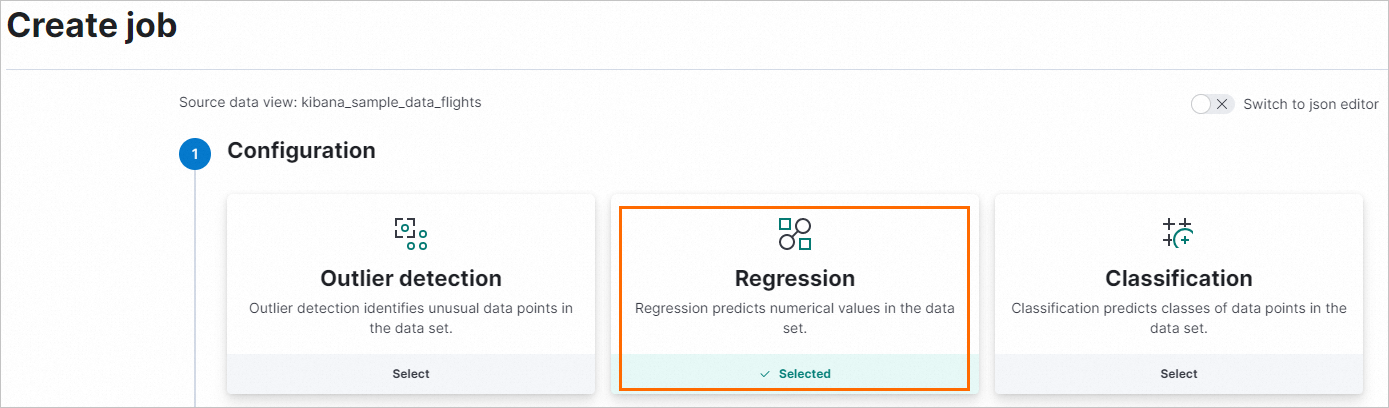
In the Configuration step of the Create job page, configure basic information for the job.
Select Regression.
Select FlightDelayMin from the Dependent variable drop-down list. The dependent variable is the variable on which a prediction needs to be performed.
In the included fields section, clear Cancelled, FlightDelay, and FlightDelayType in the Field name column.
The Cancelled, FlightDelay, and FlightDelayType fields are useless for the prediction of flight delays. To ensure that the task is not affected by unnecessary factors and improve prediction accuracy, we recommend that you exclude these fields.
In the Training percent section, slide the knob to change the percentage of data that is used for training.
You can change the percentage based on your business requirements. In this example, the percentage is set to 90%.
NoteIf a large amount of data is used for training, you need to take note of the time that is required to train the task. A larger amount of data requires a longer training period. If you have a large amount of data, we recommend that you specify a small percentage, such as 50% or less. Then, you can change the percentage based on your business requirements to obtain an appropriate accuracy.
Click Continue. Configure settings in the Additional options step.
Set Feature importance values to 5. This way, the top five features that most significantly affect the prediction result are determined. This helps you identify which features have the most impact on the prediction result, and help you select the most appropriate features and optimize the task.
Set Prediction field name to FlightDelayMin_prediction. This parameter specifies the name of the variable on which you want to perform a prediction.
Disable Use estimated model memory limit and set Model memory limit to 500 MB. The Model memory limit parameter specifies the upper limit for the size of the memory that can be used by the machine learning task. If the data size of your dataset is large and your machine learning task is complex, a large amount of memory may be consumed. If the size of the memory that is used exceeds the upper limit, the training of the machine learning task may fail, or the performance of the task degrades. You must specify an appropriate upper limit based on the data size of your dataset and the complexity of your machine learning task.
Set Maximum number of threads to 1. This parameter specifies the maximum number of threads that can be used to train the machine learning task. If you specify a large number of threads, the memory may be insufficient, or the system may stop responding.
Click Continue, and configure parameters in the Job details step. Set Job ID to flightdelaymin_job.
Click Continue. The system validates the task.
If the validation is passed, click Continue.
In the Create step, click Create.
The system requires a specific amount of time to generate the job. The actual time that is consumed is determined by the amount of data used for the training.
After the job is created, click View Results to view the running result of the job.
In the Model evaluation section of the page that appears, view the metrics that indicate the reliability of the task.
Generalization error: measures the performance of the task on new data, which reflects the generalization capability of the task. A smaller generalization error indicates a better generalization capability. A task with a better generalization capability can perform more accurate prediction on new data.
Training error: reflects the performance of the task on dataset-based training and the error generated during the learning process of the task. A smaller value indicates better performance of the task on dataset-based training.
Description of evaluation metrics:
Mean squared error: an important metric that measures the performance of a regression task. A smaller value indicates a more accurate prediction result. The value is obtained by calculating the mean square of the difference between an actual value and a prediction value that is provided by a regression task.
R squared: an important metric that measures the performance of a regression task. A value that is closer to 1 indicates that the task better fits actual values. A value greater than 0.8 indicates that the task has a high fitting degree.
Mean squared logarithmic error: A smaller value indicates a better prediction effect. The value is obtained by calculating the average value of the sum of squared errors after the logarithms of prediction values and actual values are returned.
NoteWhen you compare multiple regression tasks, you must take note of the value of the Mean squared error metric and the value of the R squared metric. This can help you determine the optimal task or the task that is suitable for specific datasets.
In most cases, the value of the Mean squared error metric is impossible to be 0, and the value of the R squared metric is impossible to be 1. The reason is that the prediction result of a task is affected by multiple factors. You may not be able to take into account all these factors and eliminate errors.
The value NaN of the Mean squared logarithmic error metric indicates that the prediction result or the actual value is a non-positive number or 0.
For more information, see Evaluating data frame analytics.
Use the flight delay prediction task
You can use the flight delay prediction task based on the inference processor provided by Kibana.
Click the
icon in the upper-left corner of the Kibana console. In the left-side navigation pane, choose Management > Dev Tools. On the Console tab, run the following command to view and record the value of the model_id parameter:
GET _ml/inference/flightdelaymin_job*?human=trueThis command is used to query all inference and analysis results of the job whose ID is flightdelaymin_job and return the results in a human-readable format. flightdelaymin_job in the command specifies the ID of the job that is created for training the regression and inference task.
Create a pipeline based on the regression and inference task and the inference processor.
NoteYou must replace the value of the model_id parameter in the following command with the value that you obtained in the preceding step.
PUT _ingest/pipeline/flight_flightDelayMin_predict
{
  "description": "Predict the number of minutes of delay for each flight",
  "processors": [
    {
      "inference": {
        "model_id": "flightDelayMin_job-168609891****",
        "inference_config": {
          "regression": {}
        },
        "field_map": {},
        "tag": "flightDelayMin_prediction"
      }
    }
  ]
}
Perform data analysis and prediction on the FlightDelayMin variable based on data in the kibana_sample_data_flights index.
POST _ingest/pipeline/flight_flightDelayMin_predict/_simulate
{
  "docs": [
    {
      "_source": {
        "FlightNum": "EDGSV3T",
        "DestCountry": "CN",
        "OriginWeather": "Damaging Wind",
        "OriginCityName": "Durban",
        "AvgTicketPrice": 1065.7037805199147,
        "DistanceMiles": 7273.460817641552,
        "FlightDelay": true,
        "DestWeather": "Rain",
        "Dest": "Shanghai Pudong International Airport",
        "FlightDelayType": "Carrier Delay",
        "OriginCountry": "ZA",
        "dayOfWeek": 5,
        "DistanceKilometers": 11705.500526106527,
        "timestamp": "2023-06-03T09:34:00",
        "DestLocation": {
          "lat": "31.14340019",
          "lon": "121.8050003"
        },
        "DestAirportID": "PVG",
        "Carrier": "Kibana Airlines",
        "Cancelled": false,
        "FlightTimeMin": 881.1071804361806,
        "Origin": "King Shaka International Airport",
        "OriginLocation": {
          "lat": "-29.61444444",
          "lon": "31.11972222"
        },
        "DestRegion": "SE-BD",
        "OriginAirportID": "DUR",
        "OriginRegion": "SE-BD",
        "DestCityName": "Shanghai",
        "FlightTimeHour": 14.685119673936343,
        "FlightDelayMin": 45
      }
    }
  ]
}
The following figure shows the result.
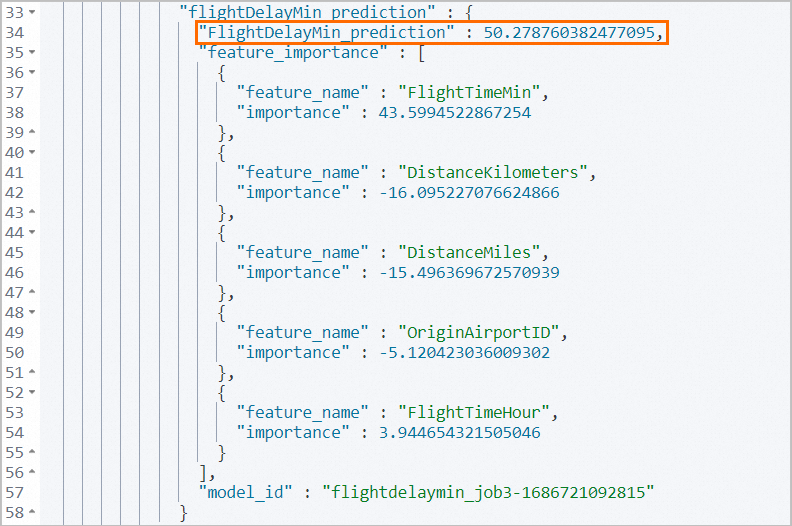
The actual value of the FlightDelayMin variable is 45 minutes. The value of the FlightDelayMin_prediction variable obtained in the prediction is 50.28 minutes, which is close to the actual value.
The feature_importance parameter returns the top five factors that most significantly affect the prediction result of flight delays: FlightTimeMin, DistanceKilometers, DistanceMiles, OriginAirportID, and FlightTimeHour. You can change the values of these factors to obtain different prediction results. This way, the task can predict the delay time of each flight in a more accurate manner.