Use Fleet Server in Kibana to centrally manage Elastic Agents running on multiple Elastic Compute Service (ECS) instances. The agents collect NGINX access and error logs and send them to Elasticsearch, where you can visualize and query the data in Kibana.
This guide shows how to configure a shared agent policy for two ECS instances that both run NGINX.
Limitations
This feature requires an Elasticsearch cluster that uses the Basic Management (V2) architecture. Clusters using the cloud-native Next-Gen Management (V3) architecture do not support creating agent policies in Kibana Fleet. A replacement solution will be available later. To check your cluster's architecture, go to Basic Information > Control Architecture Type.
Key concepts
| Term | Description |
|---|---|
| Fleet | A centralized management solution in Elasticsearch that manages Elastic Agents across your environment. |
| Fleet Agent | A lightweight data collection agent that runs on multiple operating systems and gathers data from source systems. |
| Fleet Server | A service that transfers data collected by Elastic Agents to Elasticsearch. |
Prerequisites
Before you begin, ensure that you have:
-
An Alibaba Cloud Elasticsearch cluster (version 7.10 or later, excluding 7.16). This guide uses Elasticsearch 8.5.
-
Two ECS instances in the same virtual private cloud (VPC) as the Elasticsearch cluster, each with an elastic IP address (EIP) associated. The ECS instances act as the source servers from which Elastic Agents collect NGINX logs.
Create an agent policy and add integrations
Step 1: Create an agent policy
-
Log on to the Kibana console. For more information, see Log on to the Kibana console.
-
Go to Management > Fleet.
-
On the Fleet page, click the Agent policies tab, then click Create agent policy.
-
In the Create agent policy panel, configure the following settings:
-
In the Name field, enter
nginx-log. -
Clear Collect System Logs and Metrics.
-
Click Advanced options. Under Agent monitoring, clear both Collect agent logs and Collect agent metrics.
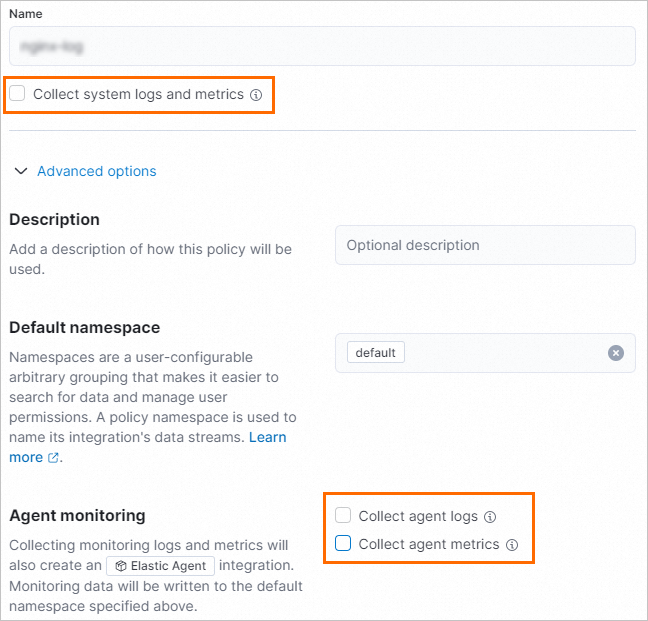 > Note: This setup collects only NGINX logs. Disable system logs, metrics, and agent-specific data to avoid unnecessary data collection.
-
-
Click Create agent policy.
Step 2: Add a Fleet Server integration
-
On the Agent policies tab, click the nginx-log policy.
-
On the Integrations tab, click Add integration.
-
Search for
Fleet Serverand select it. -
Install the Fleet Server assets:
-
On the Fleet Server page, click the Settings tab.
-
Click Install Fleet Server assets, then confirm by clicking Install Fleet Server. > Note: After installation, the integration version appears on the Settings tab.
-
-
In the upper-right corner, click Add Fleet Server.
-
On the Add Fleet Server integration page, enter a name for the integration. The
nginx-logagent policy is selected by default. -
Click Save and continue, then click Add Elastic Agent later.
Step 3: Add an NGINX integration
-
On the nginx-log agent policy page, click the Integrations tab, then click Add integration.
-
Search for
NGINXand select it. -
Install the NGINX assets:
-
On the NGINX page, click the Settings tab.
-
Click Install NGINX assets, then confirm by clicking Install NGINX. > Note: After installation, the integration version appears on the Settings tab.
-
-
In the upper-right corner, click Add NGINX.
-
On the Add NGINX integration page, configure the integration:
-
In the Configure integration section, keep the default name
nginx-1in the Integration name field. -
Next to Collect logs from NGINX instances, click Change defaults to set a custom log path.
-
In the Where to add this integration section, click the Existing hosts tab, then select
nginx-logfrom the agent policy list.
-
-
Click Save and continue, then click Add Elastic Agent later.
Add Elastic Agent
Step 1: Configure a Fleet Server host
-
Go to Management > Fleet.
-
On the Fleet page, click the Settings tab.
-
Under Fleet server hosts, click Edit hosts.
-
In the Fleet Server hosts panel, enter the private endpoint of your ECS instance in the format
https://<Private IP address>:<Port>, for examplehttps://172.16.*.***:8220.This example uses the primary private IP address of an ECS instance. For details, see Fleet Server hosts.
-
Under Outputs, click the edit icon in the Actions column.
-
In the Edit output panel, enter the private endpoint of your Elasticsearch cluster in the format
http://<Private endpoint>:<Port>, for examplehttp://es-cn-uqm3auln80001****.elasticsearch.aliyuncs.com:9200. -
Click Save and apply settings, then confirm by clicking Save and deploy.
Step 2: Add an Elastic Agent to each ECS instance
-
On the Fleet page, click the Agent policies tab.
-
Find the
nginx-logpolicy, click the actions icon in the Actions column, and select Add Agent. -
In the Select a policy for Fleet Server section, keep the default
nginx-logagent policy. -
In the Choose a deployment mode for security section, keep the default Quick start.
-
Under Add your Fleet Server host, click Add host.
-
Under Generate a service token, click Generate service token.
-
Under Install Fleet Server to a centralized host, copy the generated code block and run it on the first ECS instance. When
Successfullyappears in the output, Elastic Agent is installed and running on the instance.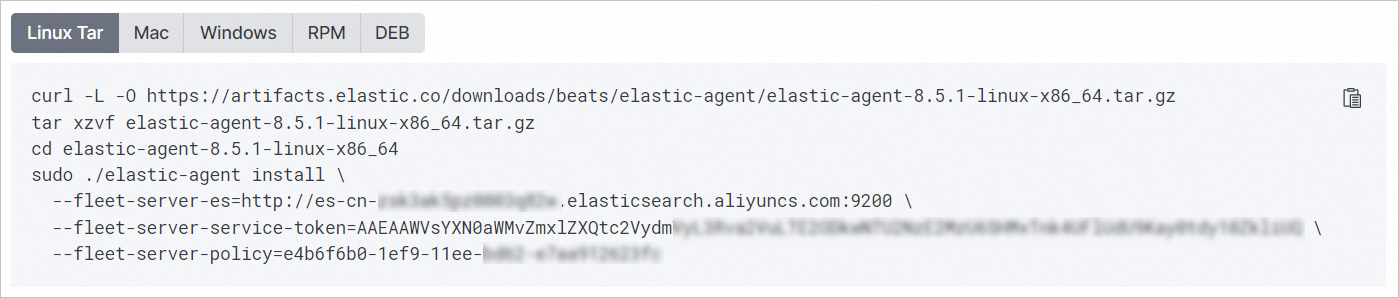
-
Repeat the previous step to add Elastic Agent to the second ECS instance.
View NGINX logs
After Elastic Agents start collecting data, view the logs using any of the following methods.
View logs on Dashboards
-
Go to Management > Fleet.
-
On the Fleet page, click the Data streams tab. NGINX logs appear in the dataset list.
-
In the Actions column for the NGINX dataset, click the actions icon and select View Dashboards.
-
Select a dashboard, for example
[Metrics Nginx] Overview.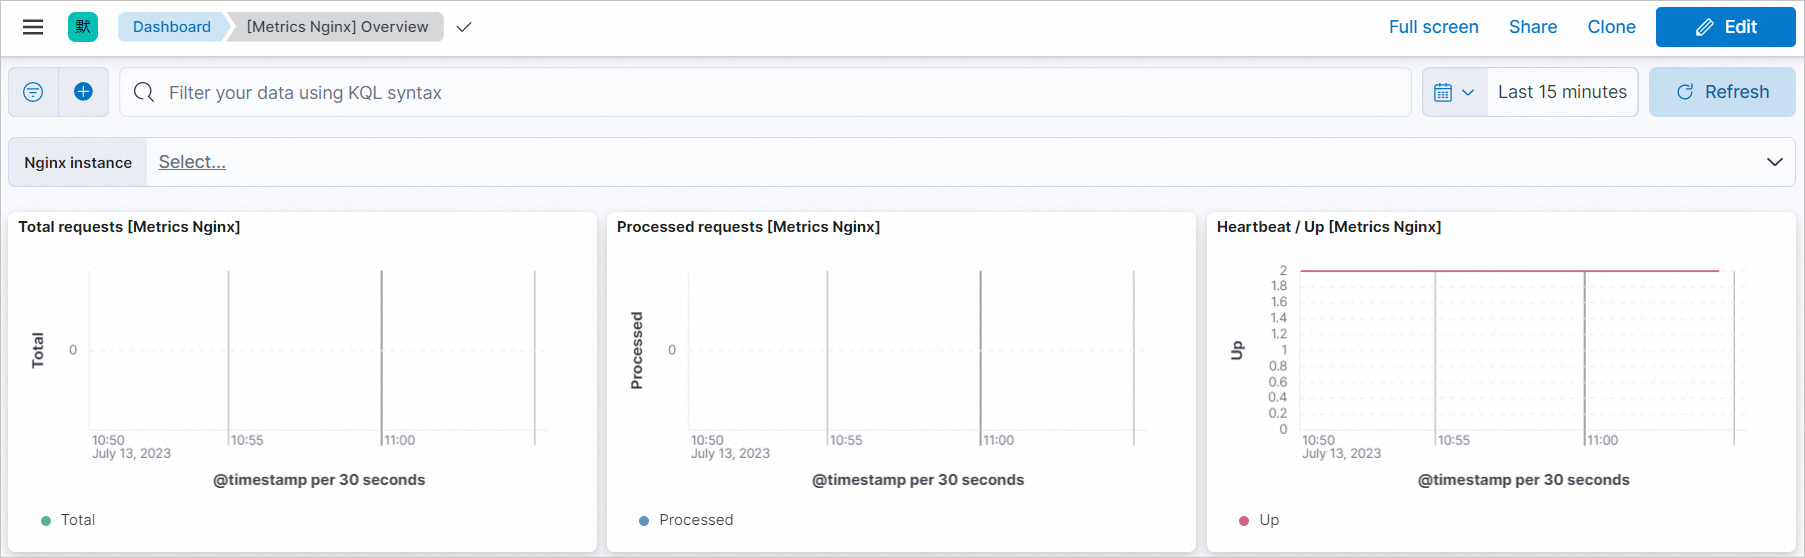
Explore logs in Discover
-
Go to Analytics > Discover.
-
In the upper-right corner, select a data view, for example
metrics-*.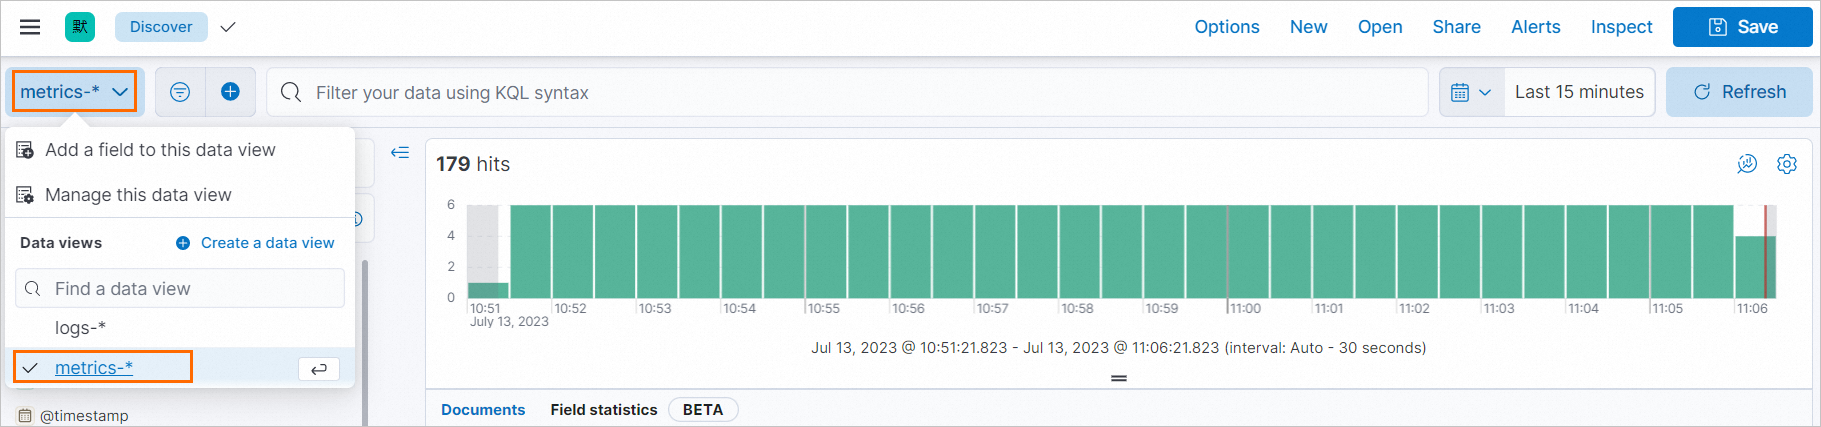
Query logs in Dev Tools
-
Go to Management > Dev Tools.
-
Run the following queries to retrieve NGINX log data:
GET logs-nginx.access-*/_search
GET logs-nginx.error-*/_search