Fleet lets you centrally manage Elastic Agents and route collected data to Elasticsearch. This guide walks you through deploying a Fleet agent on an Elastic Compute Service (ECS) instance to collect custom log files and index them into Elasticsearch.
Prerequisites
Before you begin, make sure you have:
-
An Alibaba Cloud Elasticsearch cluster at version V7.16 or V8.5. This guide uses V8.5. For setup instructions, see Create an Alibaba Cloud Elasticsearch cluster
-
An ECS instance in the same virtual private cloud (VPC) as your Elasticsearch cluster. This instance acts as the source server from which the Fleet agent collects data. For setup instructions, see Create an instance by using the wizard
How it works
Fleet is composed of two components:
-
Fleet agent: A lightweight data collection agent that runs on a host and collects data from it. A single Fleet agent can collect multiple data types across different operating systems.
-
Fleet Server: The central node that manages all Fleet agents and forwards collected data to Elasticsearch.
The end-to-end flow is:
-
Create an agent policy and add the Fleet Server and Custom Logs integrations.
-
Configure the Fleet Server host and Elasticsearch output.
-
Install the Fleet agent on the ECS instance.
-
Verify that log data appears in Elasticsearch.
Create an agent policy and add integrations
Step 1: Create an agent policy
-
Log in to the Kibana console of your Elasticsearch cluster. For instructions, see Log on to the Kibana console.
-
Click the
 icon in the upper-left corner, then choose Management > Fleet in the left-side navigation pane.
 -
On the Fleet page, click the Agent policies tab, then click Create agent policy.
-
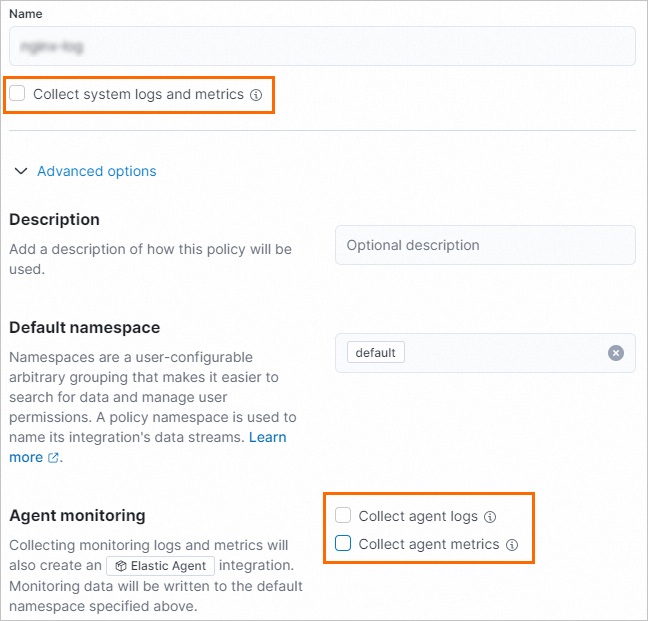
In the Create agent policy panel:
-
Enter
custom-login the Name field. -
Clear Collect system logs and metrics.
-
Click Advanced options. In the Agent monitoring section, clear Collect agent logs and Collect agent metrics.
 Note
NoteThis guide collects only custom logs, so system logs, agent logs, and agent metrics are not needed.
-
-
Click Create agent policy.
Step 2: Add the Fleet Server integration
-
On the Agent policies tab, click the custom-log policy.
-
On the Integrations tab, click Add integration.
-
On the Browse integrations tab, search for
Fleet Serverand click the Fleet Server card. -
Install the Fleet Server integration:
-
On the Fleet Server page, click the Settings tab.
-
Click Install Fleet Server assets. In the confirmation dialog, click Install Fleet Server.
NoteAfter installation, the integration version appears on the Settings tab.
-
-
In the upper-right corner, click Add Fleet Server.
-
On the Add Fleet Server integration page:
-
In the Configure integration section, enter a name in the Integration name field.
-
In the Where to add this integration section, select
custom-logfrom the Agent policy drop-down list.
-
-
Click Save and continue. In the confirmation message, click Add Elastic Agent later.
Step 3: Add the Custom Logs integration
-
On the Integrations tab of the custom-log policy, click Add integration.
-
On the Browse integrations tab, search for
Custom Logsand click the Custom Logs card. -
Install the Custom Logs integration:
-
On the Custom Logs page, click the Settings tab.
-
Click Install Custom Logs assets. In the confirmation dialog, click Install Custom Logs.
NoteAfter installation, the integration version appears on the Settings tab.
-
-
In the upper-right corner, click Add Custom Logs.
-
On the Add Custom Logs integration page:
-
In the Configure integration section, enter a name in the Integration name field.
-
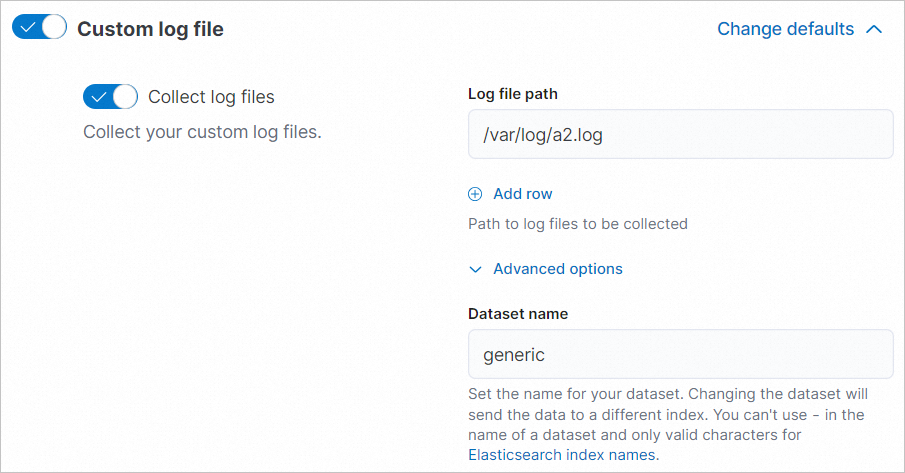
In the Custom log file section, enter the log file path in the Log file path field, for example,
/var/log/a2.log. -
Click Advanced options and enter a name in the Dataset name field.
 Note
NoteThe dataset name determines the Elasticsearch index where collected data is stored. It must follow Elasticsearch index naming rules and can contain only letters, digits, and underscores (
_). Data is routed to an index with the same name as the dataset, which makes data management more flexible. -
On the Existing hosts tab in the Where to add this integration section, select
custom-logfrom the Agent policy drop-down list.
-
-
Click Save and continue. In the confirmation message, click Add Elastic Agent later.
Add a Fleet agent
Step 1: Configure the Fleet Server host
-
Log in to the Kibana console and navigate to Management > Fleet.
-
On the Fleet page, click the Settings tab.
-
Configure the Fleet Server host:
-
In the Fleet server hosts section, click Edit hosts.
-
In the Fleet Server hosts panel, enter the Fleet Server URL in the Specify host URL field using the format
https://<private-ip-of-ECS>:<port>, for example,https://172.16.*.*:8220. Click Save and apply settings, then click Save and deploy in the confirmation dialog.NoteEnter the primary private IP address of your ECS instance. For more details on Fleet Server host settings, see Fleet Server hosts.
-
-
Configure the Elasticsearch output:
-
In the Outputs section, click the
 icon in the Actions column.
 -
In the Edit output panel, enter your Elasticsearch cluster URL in the Hosts field using the format
http://<internal-endpoint>:<port>, for example,http://es-cn-uqm3auln80001****.elasticsearch.aliyuncs.com:9200. -
Click Save and apply settings, then click Save and deploy.
-
Step 2: Install the Fleet agent on the ECS instance
To collect logs from multiple source servers, repeat these steps for each server. Each Fleet agent collects data independently, and Fleet Server manages them all from a central location.
-
On the Fleet page, click the Agent policies tab.
-
Find the custom-log policy, click the
 icon in the Actions column, and select Add agent.
 -
On the Enroll in Fleet tab of the Add agent panel, click Add Fleet Server.
-
In the Add a Fleet Server panel, click Advanced. In the Select a policy for Fleet Server section, keep the default value
custom-log. -
In the Choose a deployment mode for security section, keep the default value Quick start.
-
In the Add your Fleet Server host section, click Add host.
-
In the Generate a service token section, click Generate service token.
-
In the Install Fleet Server to a centralized host section, copy the generated command and run it on the ECS instance. If the output includes
Successfully, the Fleet agent is installed and running.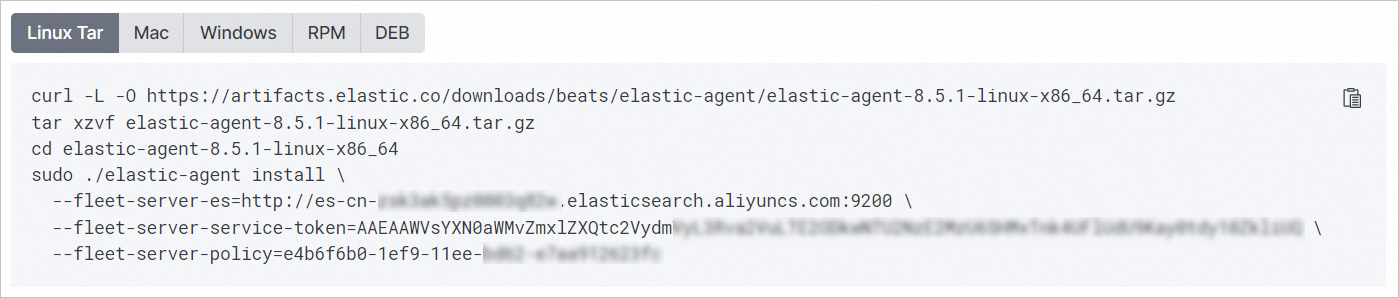
Verify collected data
This section uses the log path /var/log/a2.log and dataset generic from the example above.
Make sure that data exists at the log file path you specified before verifying.
Step 1: Identify the data stream
-
Click the
icon and choose Management > Stack Management. -
In the left-side navigation pane, choose Data > Index Management.
-
On the Data Streams tab, look for a data stream whose name contains
generic, such aslogs-generic-default.
Step 2: Query the index
-
Click the
icon and choose Management > Dev Tools. -
On the Console tab, run the following command to get the index name for the data stream:
GET _data_Stream/logs-generic-defaultThe
index_namefield in the response is the backing index name. -
Query the log data in the index:
GET <index_name>/_search
{
  "query":{
    "match":{
      "log.file.path":"/var/log/a2.log"
    }
  }
}
Replace
<index_name>with the value from the previous step. Matching documents confirm that the Fleet agent is successfully collecting and indexing your custom log data.