A Query Profile records the execution details of a query in your StarRocks instance. Use Query Profiles to diagnose query performance, pinpoint bottlenecks, and select the optimization technique that resolves them.
Query Profile overview
Query Profile visualization
StarRocks Manager supports visual analytics for Query Profiles. For more information, see Query Profile introduction.
Identify query bottlenecks
In the Query Profile visualization in StarRocks Manager, operators that take longer to run appear in darker colors. The three operators with the longest execution duration are highlighted, which makes query bottlenecks easy to identify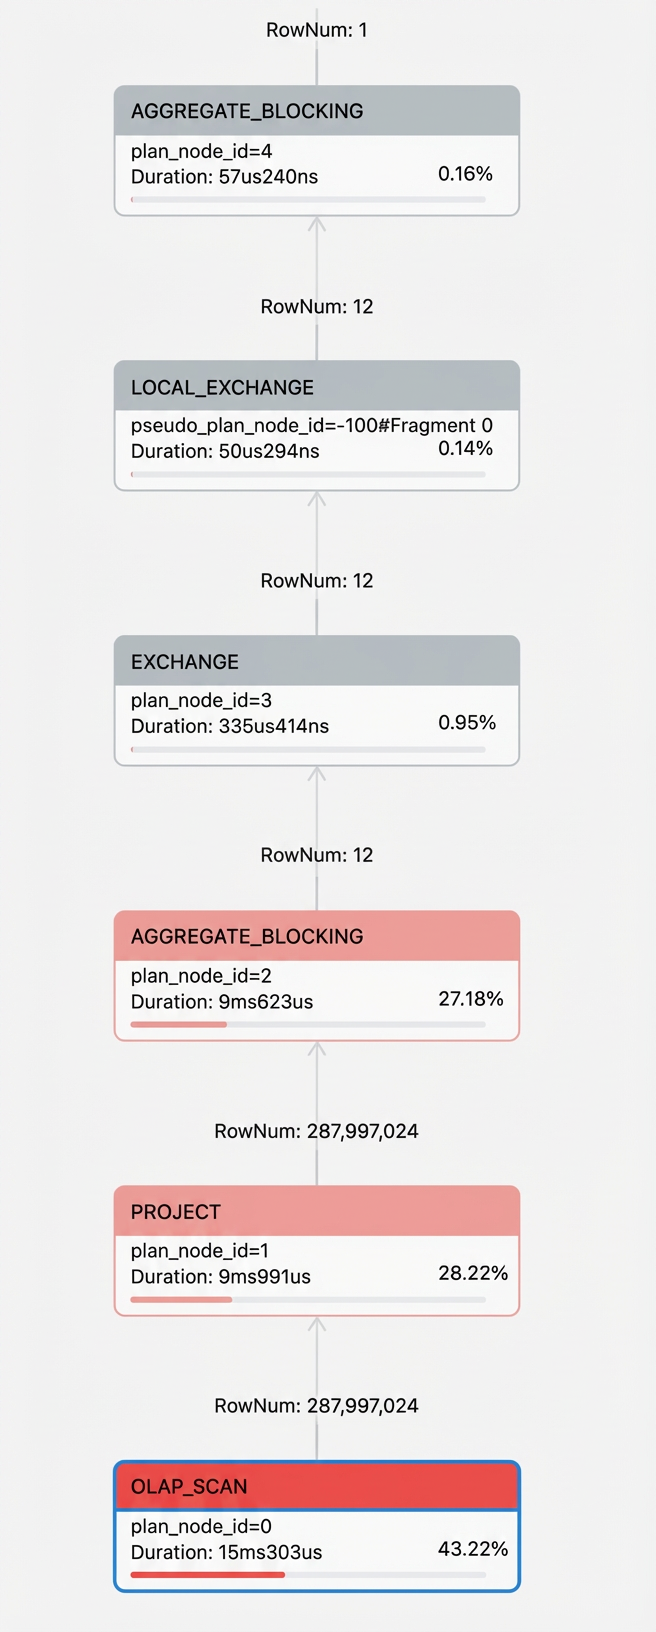
Why is the CONNECTOR_SCAN time longer than the SCANTIME?
CONNECTOR_SCAN represents the cumulative active time of an operator across all of its parallel instances. This value includes SCANTIME, IOTaskExecTime, OperatorTotalTime, and other components. As a result, CONNECTOR_SCAN can be numerically larger than the SCANTIME of a single instance.
Optimization use cases
The following sections describe how to diagnose and resolve common query performance problems in StarRocks:
Optimize large-field queries that cause out-of-memory (OOM) errors
When you query a table that contains large fields such as TEXT or VARCHAR, reading or computing too much large-field data can cause an out-of-memory (OOM) error. For memory limit errors that data skew causes instead, see Optimization measures for memory limit errors (Memory of process exceed limit) caused by data skew. Apply the following measures to reduce memory consumption:
Avoid
SELECT *. Explicitly specify only the columns that you need to reduce the data volume that is scanned and loaded into memory.Keep large fields out of aggregate operations such as
GROUP BYandDISTINCTto prevent oversized intermediate result sets.Enable the spill to disk feature to relieve memory pressure by setting the session variable
enable_spill=true.Optimize the table schema by moving large text fields into a separate table, and keep only indexes and small fields in the primary table. This table-splitting approach does not take effect in aggregation scenarios.
Bitmap index
A Bitmap index is a special type of database index that uses a bit array. Each bit in the array corresponds to a single row in the data table. The value of the bit, either 0 or 1, is determined by the value of the corresponding row.
Use a Bitmap index to improve query performance for columns that have low cardinality and a high number of repeating values, such as a
gendercolumn.To check if a query hits a Bitmap index, view the
BitmapIndexFilterRowsfield in the Query Profile.
Create an index
Create a Bitmap index when you create a table.
CREATE TABLE `student_info` (
  `s_stukey` bigint(20) NULL COMMENT "",
  `s_name` varchar(65533) NULL COMMENT "",
  `s_gender` varchar(65533) NULL COMMENT "",
  INDEX index1 (s_gender) USING BITMAP COMMENT 'index1'
) ENGINE=OLAP
DUPLICATE KEY(`s_stukey`)
COMMENT "OLAP"
DISTRIBUTED BY HASH(`s_stukey`);
INSERT INTO student_info
VALUES
    (001,'student#000000019','male'),
    (002,'student#000000020','male'),
    (003,'student#000000021','male'),
    (004,'student#000000022','female');
Create a Bitmap index on an existing table by using
CREATE INDEX.
CREATE INDEX index_name ON table_name (column_name) [USING BITMAP] [COMMENT ''];Check the index creation progress
Run the following command to check the progress of an index creation task:
SHOW ALTER TABLE COLUMN [FROM db_name];View an index
Run the following command to view the indexes on a table:
SHOW {INDEX[ES] | KEY[S] } FROM [db_name.]table_name [FROM db_name];The following output is returned:
MySQL [db_test]> show index from student_info;
+------------------------+------------+----------+--------------+-------------+-----------+-------------+----------+--------+------+------------+---------+
| Table                  | Non_unique | Key_name | Seq_in_index | Column_name | Collation | Cardinality | Sub_part | Packed | Null | Index_type | Comment |
+------------------------+------------+----------+--------------+-------------+-----------+-------------+----------+--------+------+------------+---------+
| db_test.student_info   |            | index1   |              | s_gender    |           |             |          |        |      | BITMAP     | index1  |
+------------------------+------------+----------+--------------+-------------+-----------+-------------+----------+--------+------+------------+---------+
1 row in set (0.01 sec)
Drop an index
Run the following command to drop an index:
DROP INDEX index_name ON [db_name.]table_name;Test a single-column query
Run a query that filters the
s_gendercolumn.select * from student_info where s_gender='male';View the Profile.
Click OLAP_SCAN, then click the Node Details tab on the right. Filter the metrics for
Bitmapto confirm that the Bitmap index has taken effect.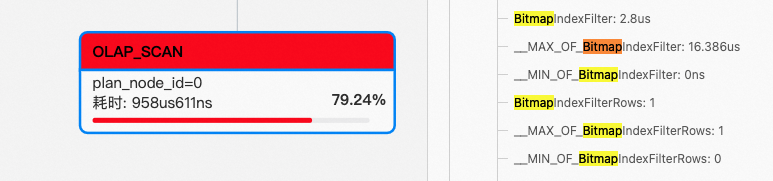
Bloom filter index
A Bloom filter index quickly determines whether a data file contains the target data. If it does not, the file is skipped, which reduces the data volume scanned. A Bloom filter is space-efficient and well-suited for high-cardinality columns, such as ID columns.
In the Primary Key model and Duplicate model, you can create a Bloom filter index on any column. In the Aggregate model and Update model, you can create a Bloom filter index only on key columns.
Bloom filter indexes are not supported for columns of the TINYINT, FLOAT, DOUBLE, or DECIMAL data types.
A Bloom filter index only improves performance for queries that contain
inor=predicates, such asSELECT ... WHERE ... IN ()andSELECT ... WHERE column = ....To check if a query hits a Bloom filter index, view the
BloomFilterFilterRowsfield in the Query Profile.
Create an index
When you create a table, you can create a Bloom filter index by specifying bloom_filter_columns in the PROPERTIES clause. The following example shows how to do this.
CREATE TABLE table1
(
  k1 BIGINT,
  k2 LARGEINT,
  v1 VARCHAR(2048) REPLACE,
  v2 SMALLINT DEFAULT "10"
)
ENGINE = olap
PRIMARY KEY(k1, k2)
DISTRIBUTED BY HASH (k1, k2) BUCKETS 10
PROPERTIES("bloom_filter_columns" = "k1,k2"); -- Separate multiple index columns with commas (,).
View an index
Run the following command to view the indexes on a table:
SHOW CREATE TABLE table1;Modify an index
For example:
Add a Bloom filter index for column
v1.
ALTER TABLE table1 SET ("bloom_filter_columns" = "k1,k2,v1");Remove the Bloom filter index for column
k2.
ALTER TABLE table1 SET ("bloom_filter_columns" = "k1");Delete all Bloom filter indexes from
table1.
ALTER TABLE table1 SET ("bloom_filter_columns" = "");Example
Take the
customertable from TPC-H as an example. Add a Bloom filter index on a high-cardinality column that is not a sort key, such as thec_phonecolumn.ALTER TABLE tpc_h_sf100.customer SET ("bloom_filter_columns" = "c_custkey, c_phone");View the index to confirm that the Bloom filter index has been added.
SHOW CREATE TABLE tpc_h_sf100.customer;| customer | CREATE TABLE `customer` ( `c_custkey` bigint(20) NULL COMMENT "", `c_name` varchar(65533) NULL COMMENT "", `c_address` varchar(65533) NULL COMMENT "", `c_nationkey` bigint(20) NULL COMMENT "", `c_phone` varchar(65533) NULL COMMENT "", `c_acctbal` double NULL COMMENT "", `c_mktsegment` varchar(65533) NULL COMMENT "", `c_comment` varchar(65533) NULL COMMENT "", `Gender` varchar(65533) NULL DEFAULT "default_value" COMMENT "" ) ENGINE=OLAP DUPLICATE KEY(`c_custkey`) COMMENT "OLAP" DISTRIBUTED BY HASH(`c_custkey`) BUCKETS 24 PROPERTIES ( "replication_num" = "1", "bloom_filter_columns" = "c_custkey, c_phone", "in_memory" = "false", "storage_format" = "DEFAULT", "enable_persistent_index" = "false", "compression" = "LZ4" ); |Run a query that filters the
c_phonecolumn.select * from tpc_h_sf100.customer where c_phone = "10-334-921-5346";View the Profile.
Click OLAP_SCAN, then click the Node Details tab on the right. Find the
BloomFilterFilterRowsmetric to confirm that the Bloom filter index is active.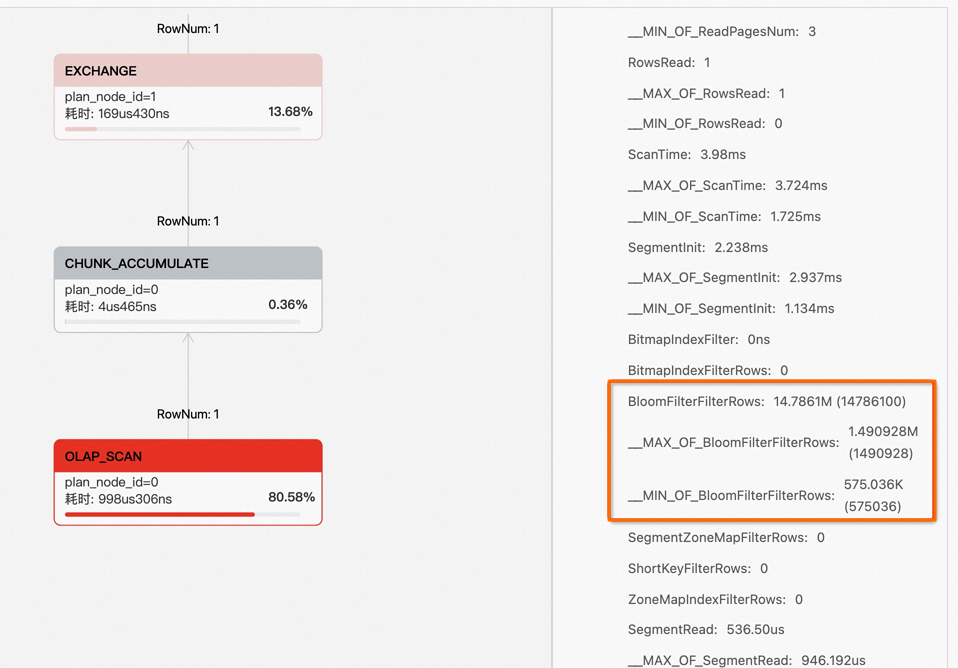
Optimize for data skew
This example uses the lineitem table from TPC-H and selects a column with an uneven value distribution as the bucketing key to demonstrate a data skew problem. In this example, the l_tag column has the same value in every row, which produces extreme data skew.
Create test data. Add a new column to the
lineitemtable from TPC-H to use as the distribution key.CREATE TABLE `lineitem_tag` ( `l_orderkey` bigint(20) NULL COMMENT "", `l_partkey` bigint(20) NULL COMMENT "", `l_suppkey` bigint(20) NULL COMMENT "", `l_linenumber` int(11) NULL COMMENT "", `l_quantity` double NULL COMMENT "", `l_extendedprice` double NULL COMMENT "", `l_discount` double NULL COMMENT "", `l_tax` double NULL COMMENT "", `l_returnflag` varchar(65533) NULL COMMENT "", `l_linestatus` varchar(65533) NULL COMMENT "", `l_shipdate` date NULL COMMENT "", `l_commitdate` date NULL COMMENT "", `l_receiptdate` date NULL COMMENT "", `l_shipinstruct` varchar(65533) NULL COMMENT "", `l_shipmode` varchar(65533) NULL COMMENT "", `l_comment` varchar(65533) NULL COMMENT "", `l_tag` varchar(65533) default 'false' COMMENT "" ) ENGINE=OLAP DUPLICATE KEY(`l_orderkey`) COMMENT "OLAP" DISTRIBUTED BY HASH(`l_tag`) BUCKETS 96 PROPERTIES ( "replication_num" = "1", "in_memory" = "false", "storage_format" = "DEFAULT", "enable_persistent_index" = "false" ); insert into lineitem_tag select *, 'false' as l_tag from tpc_h_sf100.lineitem;Run a query to perform a full table scan.
select count(1) from lineitem_tag;View the Profile.
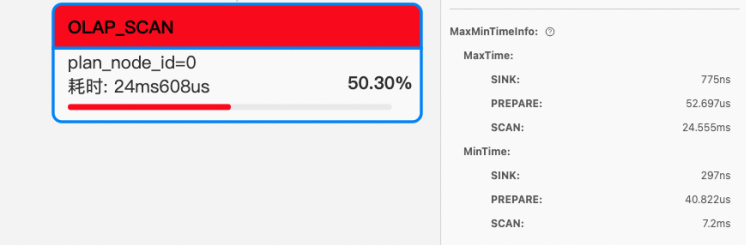
Click OLAP_SCAN and go to the Node tab on the right. Compare the SCAN time under MaxTime and MinTime. If the times differ by several orders of magnitude, data skew might have occurred.
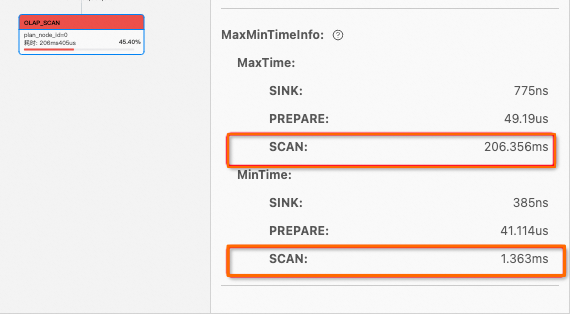
Optimize the table schema by redefining the distribution key. Create a new table named
lineitem2and change the bucketing key froml_tagtol_orderkeyto resolve the data skew. The following statement creates the table, where the critical change isDISTRIBUTED BY HASH(`l_orderkey`) BUCKETS 96.CREATE TABLE `lineitem2` ( `l_orderkey` bigint(20) NULL COMMENT "", `l_partkey` bigint(20) NULL COMMENT "", `l_suppkey` bigint(20) NULL COMMENT "", `l_linenumber` int(11) NULL COMMENT "", `l_quantity` double NULL COMMENT "", `l_extendedprice` double NULL COMMENT "", `l_discount` double NULL COMMENT "", `l_tax` double NULL COMMENT "", `l_returnflag` varchar(65533) NULL COMMENT "", `l_linestatus` varchar(65533) NULL COMMENT "", `l_shipdate` date NULL COMMENT "", `l_commitdate` date NULL COMMENT "", `l_receiptdate` date NULL COMMENT "", `l_shipinstruct` varchar(65533) NULL COMMENT "", `l_shipmode` varchar(65533) NULL COMMENT "", `l_comment` varchar(65533) NULL COMMENT "", `l_tag` varchar(65533) NULL DEFAULT "default_value" COMMENT "" ) ENGINE=OLAP DUPLICATE KEY(`l_orderkey`) COMMENT "OLAP" DISTRIBUTED BY HASH(`l_orderkey`) BUCKETS 96 PROPERTIES ( "replication_num" = "1", "bloom_filter_columns" = "l_orderkey", "in_memory" = "false", "storage_format" = "DEFAULT", "enable_persistent_index" = "false", "compression" = "LZ4" );View the Profile again. Compare the SCAN time under MaxTime and MinTime. You can see that the data skew issue has been mitigated.
Optimization measures for memory limit errors (Memory of process exceed limit) caused by data skew
Data skew can also cause queries to fail with a Memory of process exceed limit error. For OOM errors that large fields cause instead, see Optimize large-field queries that cause out-of-memory (OOM) errors. If you encounter memory limit errors caused by data skew, try the following optimizations in addition to changing the bucketing key:
Optimize the bucketing strategy: Use a high-cardinality column as the bucketing key, combine multiple columns for bucketing, or apply salting or random bucketing to hot values.
Adjust the JOIN execution strategy: Use Broadcast Join when joining a small table with a large table. When joining two large tables, make sure the join keys are evenly distributed, or use
DISTRIBUTE BYto redistribute the data.Dynamically adjust and optimize resource parameters: Change the bucketing method of the existing table, increase BE concurrent execution parameters such as
parallel_fragment_exec_instance_num, or add more BE nodes or replicas to spread the load.
Single-table materialized view
A single-table materialized view (also known as a Rollup) in StarRocks is a special type of index that cannot be queried directly. If your data warehouse contains a large number of complex or repetitive queries, you can create a single-table materialized view to accelerate them.
Test a query
Take the
lineitemtable from TPC-H as an example and run a query.select l_returnflag,l_linestatus,l_shipmode,sum(l_extendedprice) from lineitem group by l_returnflag,l_linestatus,l_shipmode;The initial query takes 1115 ms to complete because no materialized view has been created.
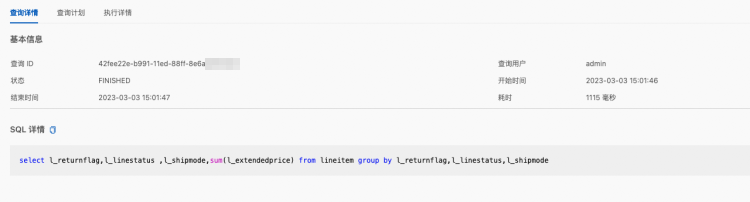
View the Profile.
Click OLAP_SCAN and go to the Node tab on the right. You can see that the Rollup scanned the
lineitemtable itself.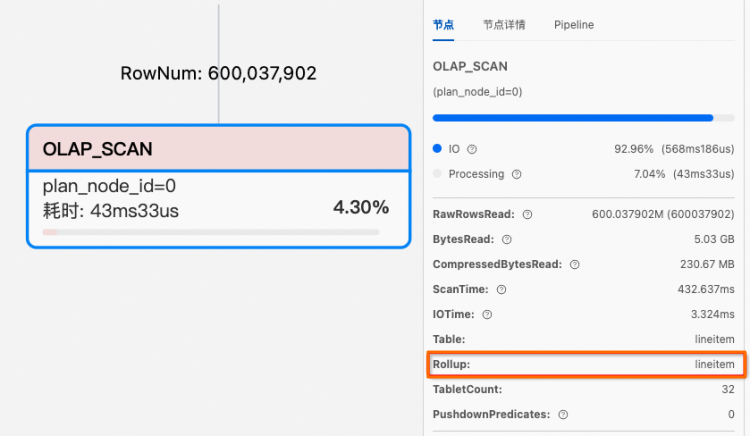
Create a materialized view
Run the following command to create a single-table materialized view:
CREATE MATERIALIZED VIEW material_test AS select l_returnflag,l_linestatus ,l_shipmode,sum(l_extendedprice) from lineitem group by l_returnflag,l_linestatus,l_shipmode;Verify materialized view hit
Use the
EXPLAINcommand to check whether the query hits the single-table materialized view.explain select l_returnflag,l_linestatus ,l_shipmode,sum(l_extendedprice) from lineitem group by l_returnflag,l_linestatus,l_shipmode;In the returned result,
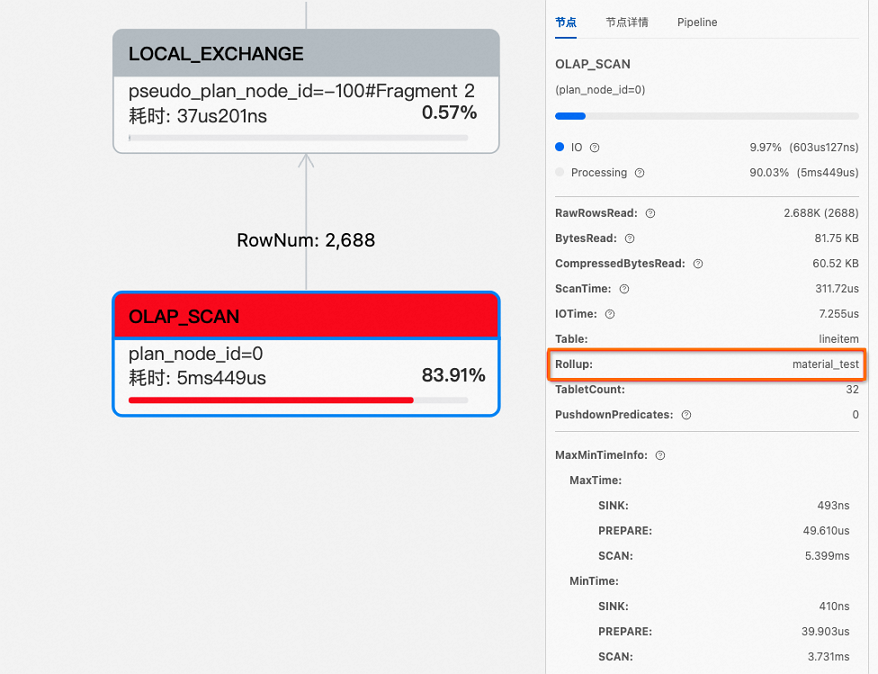
rollup: material_testindicates that the query hit the materialized view namedmaterial_test.0:OlapScanNode TABLE: lineitem PREAGGREGATION: OFF. Reason: null partitions=1/1 rollup: material_test tabletRatio=96/96 tabletList=15646,15648,15650,15652,15654,15656,15658,15660,15662,15664 ... cardinality=600037902 avgRowSize=14.285666 numNodes=0View the Profile.
Click OLAP_SCAN. On the Node tab on the right, you can see that the query hits the materialized view and the query time is reduced to 0.05 ms.
Verify if JoinRuntimeFilter is active
When the right table in a JOIN operation builds a hash table, a Runtime Filter is created. This filter is sent to the left side of the query tree and pushed down to the scan operator whenever possible. You can view metrics related to JoinRuntimeFilter on the Node Details tab of the scan operator.
Take
query72.sqlfrom TPC-DS as an example.select i_item_desc, w_warehouse_name, d1.d_week_seq, sum(case when p_promo_sk is null then 1 else 0 end) no_promo, sum(case when p_promo_sk is not null then 1 else 0 end) promo, count(*) total_cnt from inventory join catalog_sales on (cs_item_sk = inv_item_sk) join warehouse on (w_warehouse_sk=inv_warehouse_sk) join item on (i_item_sk = cs_item_sk) join customer_demographics on (cs_bill_cdemo_sk = cd_demo_sk) join household_demographics on (cs_bill_hdemo_sk = hd_demo_sk) join date_dim d1 on (cs_sold_date_sk = d1.d_date_sk) join date_dim d2 on (inv_date_sk = d2.d_date_sk) join date_dim d3 on (cs_ship_date_sk = d3.d_date_sk) left outer join promotion on (cs_promo_sk=p_promo_sk) left outer join catalog_returns on (cr_item_sk = cs_item_sk and cr_order_number = cs_order_number) where d1.d_week_seq = d2.d_week_seq and inv_quantity_on_hand < cs_quantity and d3.d_date > (cast(d1.d_date AS DATE) + interval '5' day) and hd_buy_potential = '>10000' and d1.d_year = 1999 and cd_marital_status = 'D' group by i_item_desc,w_warehouse_name,d1.d_week_seq order by total_cnt desc, i_item_desc, w_warehouse_name, d1.d_week_seq limit 100;View the Profile.
Click OLAP_SCAN, then click the Node Details tab on the right. You can see that the JoinRuntimeFilter was triggered when the scan operator scanned the
inventorytable.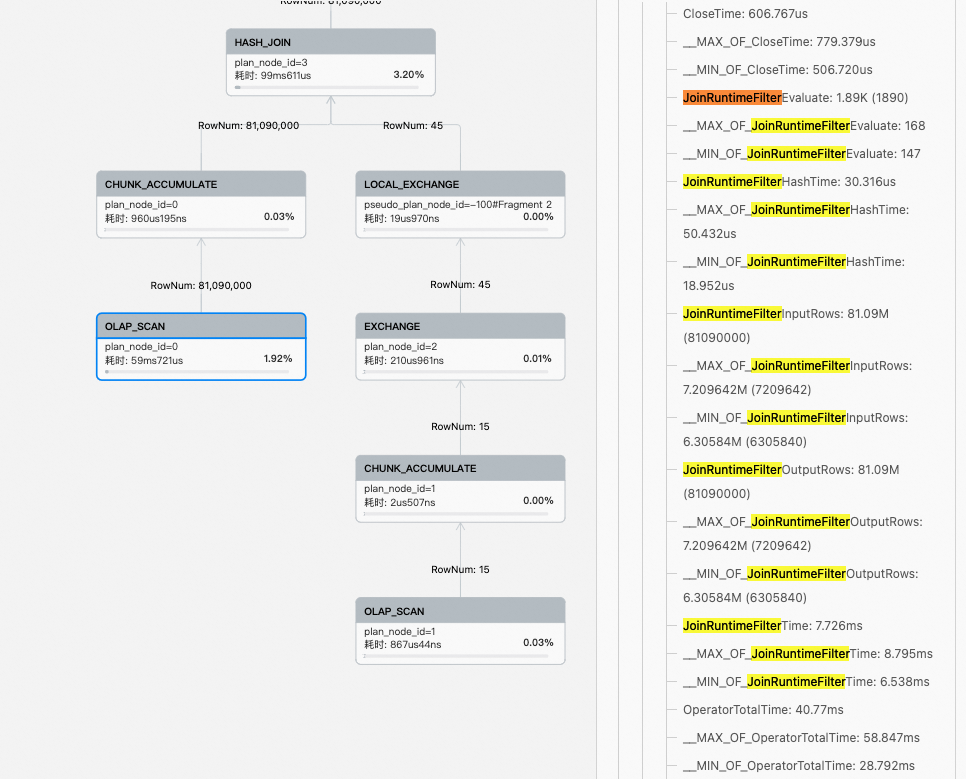
Colocate Join
To use Colocate Join in StarRocks, assign tables to a Colocation Group (CG) when you create them. Tables in the same CG must follow the same Colocation Group Schema (CGS) so that their data is distributed across the same set of BE nodes. When the join column is also the bucketing key, compute nodes only need to perform a local join, which reduces data transfer time between nodes. Unlike a Shuffle Join or a Broadcast Join, a Colocate Join avoids network data transfer and improves query performance.
Create a colocated table
StarRocks supports Colocate Join operations only on tables within the same database.
Run the following statement to create a table in a Colocation Group:
CREATE TABLE tbl (k1 int, v1 int sum)
DISTRIBUTED BY HASH(k1)
BUCKETS 8
PROPERTIES(
    "colocate_with" = "group1"
);
Automatic deletion of a Colocation Group
When the last table in a Group is permanently deleted, the Group is also automatically deleted. Permanent deletion means that the table is removed from the Recycle Bin. After you delete a table by using the DROP TABLE command, the table remains in the Recycle Bin for one day by default before it is permanently deleted.
View group information
For example, run the following command to view group information.
SHOW PROC '/colocation_group';The command returns the following information.
+-------------+--------------+----------+------------+----------------+----------+----------+
| GroupId     | GroupName    | TableIds | BucketsNum | ReplicationNum | DistCols | IsStable |
+-------------+--------------+----------+------------+----------------+----------+----------+
| 11912.11916 | 11912_group1 | 11914    | 8          | 3              | int(11)  | true     |
+-------------+--------------+----------+------------+----------------+----------+----------+
The following table describes the columns.
Column | Description |
GroupId | The unique identifier of a group across the entire cluster. The first part is the database ID, and the second part is the group ID. |
GroupName | The full name of the group. |
TableIds | A list of table IDs included in this group. |
BucketsNum | The number of buckets. |
ReplicationNum | The number of replicas. |
DistCols | The data type of the distribution columns. |
IsStable | Indicates whether the group is stable. |
You can run the following command to view the data distribution of a specific group.
SHOW PROC '/colocation_group/GroupId';
SHOW PROC '/colocation_group/11912.11916';
The command returns the following information.
+-------------+---------------------+
| BucketIndex | BackendIds          |
+-------------+---------------------+
| 0           | 10002, 10004, 10003 |
| 1           | 10002, 10004, 10003 |
| 2           | 10002, 10004, 10003 |
| 3           | 10002, 10004, 10003 |
| 4           | 10002, 10004, 10003 |
| 5           | 10002, 10004, 10003 |
| 6           | 10002, 10004, 10003 |
| 7           | 10002, 10004, 10003 |
+-------------+---------------------+
8 rows in set (0.00 sec)
Modify group properties
Run the following statement to move a table to a different Colocation Group:
ALTER TABLE tbl SET ("colocate_with" = "group_name");Example
Assign the
ordersandlineitemtables in the TPC-H dataset to the same Colocation Group.use tpc_h_sf100; ALTER TABLE orders SET ("colocate_with" = "cg_tpc_orders"); ALTER TABLE lineitem SET ("colocate_with" = "cg_tpc_orders");Run the following query.
select count(1) from orders as o join lineitem as l on o.o_orderkey = l.l_orderkey;Check whether the Colocate Join is active on the Query Plan tab for the query in the StarRocks Manager UI.
When
colocateis true, Colocate Join has taken effect. In the execution plan, this appears ascolocate: true. The corresponding query plan fragment is:
2:HASH JOIN
|  join op: INNER JOIN (COLOCATE)
|  colocate: true
|  equal join conjunct: 10: l_orderkey = 1: o_orderkey
|
|----1:OlapScanNode
|       TABLE: orders
|       PREAGGREGATION: ON
|       PREDICATES: 1: o_orderkey IS NOT NULL
|       partitions=1/1
|       rollup: orders
|       tabletRatio=96/96
|       tabletList=12403,12405,12407,12409,12411,12413,12415,12417,12419,12421 ...
|       cardinality=135000000
|       avgRowSize=1.0
|       numNodes=0
Verify bucket and partition pruning
On the Query Plan tab for your query in the StarRocks Manager UI, you can view the partition or the tabletRatio parameter to verify if partition pruning or bucket pruning is active.
How do I troubleshoot continuously rising FE memory that triggers a memory alert?
When FE memory keeps rising and triggers a memory alert, troubleshoot the issue in the following order:
Check for metadata bloat — Run
SHOW PROC '/statistic'and check the totalTabletNum. A totalTabletNumabove 1,000,000 indicates metadata bloat.Locate resource-intensive queries — If the
TabletNumis normal, query the audit log table_starrocks_audit_db_.starrocks_audit_tbl, sort the records by CPU or memory consumption, and then optimize the high-load SQL statements.Resolve unbalanced load — Configure SLB and a client-side connection pool to enable load balancing across FE nodes. This prevents requests from concentrating on a single FE Leader, which causes memory spikes and frequent GC.
Optimize the write method — Replace large
VALUESinserts with Stream Load to eliminate FE parsing hotspots at the source.