This topic describes the E-MapReduce (EMR) Serverless StarRocks health report and illustrates its use cases with examples. The health report provides data from the previous day (T+1) and includes query analysis, import analysis, table analysis, compaction analysis, and cache analysis.
Business insights
-
Go to the E-MapReduce Serverless StarRocks instance list page.
-
Log on to the E-MapReduce console.
-
In the navigation pane on the left, choose .
-
In the top menu bar, select the required region.
-
-
Click the ID of the target instance.
-
Click the Business Insights tab.
The Business Insights page provides insights into Business Insights, Business Insights, Business Insights, Business Insights, and Business Insights.
Query insights
This page provides metrics in the Query time, DB Lock, SQL Analysis, and Parameterized SQL Analysis sections. Select a date, SQL type, and database catalog to view top SQL metrics.
The following SQL types are supported:
-
DML: Statements used to query and modify data, such as SELECT, UPDATE, and DELETE.
-
DDL: Statements used to define and modify data structures, such as CREATE and ALTER.
-
Other: Auxiliary SQL commands that are not DML or DDL, such as SHOW.
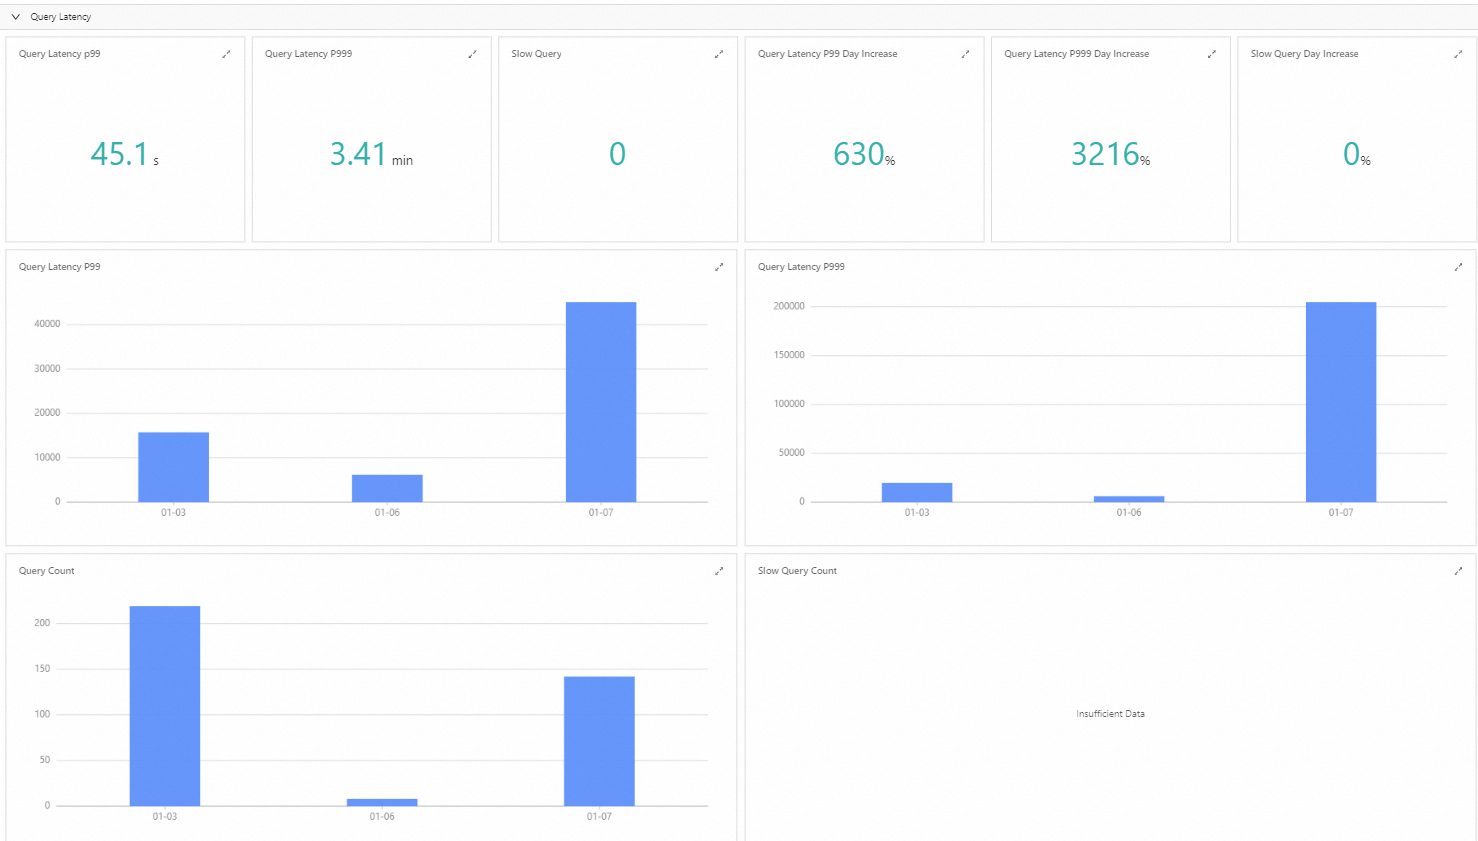
Query latency
Query latency statistics are derived from daily audit data.
P99 query latency is a key performance metric that measures the distribution of system response times. Specifically, P99 indicates that 99% of requests are completed within this time. This metric is crucial for evaluating service quality and user experience.
By monitoring P99 latency, you can understand the actual response speeds for most users.
The seven-day query latency data helps you proactively identify potential performance risks in an instance before they significantly impact your services.
DB lock
The DB Lock feature helps you monitor and analyze lock contention, which occurs when multiple transactions attempt to access the same data. To ensure data consistency and integrity, databases use a locking mechanism to control concurrent access to specific rows or tables. Long waits for a lock can degrade system performance and service quality. Use this data to troubleshoot these performance issues.
SQL analysis
This section ranks SQL statements executed in StarRocks by metrics such as query time, CPU cost, and memory consumption. This allows you to identify top SQL statements and view their execution metrics. You can use these metrics to tune potential performance bottlenecks. For example, you can view the 10 longest-running SQL statements on a specific day in the Slow Query Top 10 list. Then, use the detailed information provided by the query profile to optimize these slow-running SQL statements. For more information about query profile analysis, see Query Profile Introduction.
The following table describes the main fields in the report.
|
Field |
Description |
|
QueryId |
A unique identifier for an SQL execution. A new ID is generated for each execution. |
|
User |
The StarRocks database user who executed the SQL statement. |
|
Query Time (ms) |
The execution time of the SQL statement, in milliseconds (ms). |
|
CPU Cost (ns) |
The total CPU time used for SQL execution, aggregated across all involved cores. Unit: ns. |
|
Memory Bytes |
The amount of memory used during SQL execution. Unit: bytes. |
|
Scan Bytes |
The amount of data scanned during SQL execution. Unit: bytes. |
|
Scan Rows |
The number of rows scanned during SQL execution. |
|
Return Rows |
The number of rows returned by the SQL statement. |
|
SQL Text |
The text of the specific SQL statement. |
Parameterized SQL analysis
A parameterized SQL is a template created by replacing literal values in an SQL statement with a ? parameter. This process normalizes queries by removing comments and standardizing spacing, while preserving the core syntax. It allows you to group and analyze structurally similar SQL statements together.
For example, the following two SQL statements are reduced to the same parameterized template:
-
Original SQL
SELECT * FROM orders WHERE customer_id=10 AND quantity>20 SELECT * FROM orders WHERE customer_id=20 AND quantity>100 -
Parameterized SQL
SELECT * FROM orders WHERE customer_id=? AND quantity>?
Parameterized SQL Analysis ranks queries based on metrics such as execution count, total execution time, execution time variance, total CPU resource consumption, total memory resource consumption, and execution failure count. This helps you identify top parameterized SQL and view related metrics.
With Parameterized SQL Analysis, you can:
-
Understand the overall SQL execution status in your StarRocks database.
-
Optimize frequently executed, long-running, and resource-intensive (CPU and memory) SQL to achieve significant performance gains.
-
Use the query time CV to measure the stability of SQL execution times and identify potential performance issues. For example, increased execution time for similar SQL queries may indicate issues such as data skew or resource contention.
The following table describes the related fields.
Field
Description
Parameterized SQL ID
The hash value of the parameterized SQL, used as its unique identifier.
query time CV
The ratio of the standard deviation of query execution time to its mean. A higher coefficient of variation (CV) typically indicates greater variability in the execution time of similar SQL queries.
execution count
The total number of executions for the parameterized SQL.
Parameterized SQL Text
The template text of the parameterized SQL.
-
Use the execution failure count to investigate the causes of SQL failures and identify potential issues.
The following table describes the related fields.
Field
Description
Parameterized SQL ID
The hash value of the parameterized SQL, used as its unique identifier.
execution failure count
The total number of failed executions for the parameterized SQL.
execution count
The total number of executions for the parameterized SQL.
Parameterized SQL Text
The template text of the parameterized SQL.
Import insights
This page displays statistics for import tasks and provides analysis from multiple perspectives.
Currently, the system supports statistics and analysis only for import tasks on shared-nothing instances.
Too many versions scenario
The analysis of high-frequency imports is based on logs containing the "too many versions" error. When the compaction score exceeds 1,000, StarRocks reports this error. To resolve this issue, you can reduce the concurrency and frequency of your import tasks.
Top analysis
Small file analysis
For table-level imports, the system analyzes the data files generated by all import tasks for each table. This analysis assesses the severity of potential small file issues and calculates a corresponding impact score. This section displays the top 20 tables most affected by small files, ranked by this score in descending order. The presence of small files can degrade query performance and reduce compaction efficiency. To address this issue, you can:
-
Choose an appropriate number of partitions and buckets based on the table's actual data size to prevent small file issues.
-
Increase batch sizes to improve data processing throughput while reducing the number of small files in Object Storage Service (OSS).
-
Although compaction consolidates data files and improves system performance, it also consumes system resources. If resources are limited, consider adjusting the compaction frequency to balance resource usage and performance.
The small file score is calculated using the following algorithm:
-
For a primary key table, the formula is
write file count / average write file size. A high score, resulting from many small files, indicates a significant potential impact. -
For a non-primary key table, the formula is
write file count / average write time. A high score, resulting from many files and a short average write time, indicates a significant potential impact.
Using this algorithm, you can quantify the small file problem and apply targeted optimizations to the top 20 tables, improving overall instance performance.
The following table describes the key fields.
|
Parameter |
Description |
|
Table set |
All related tables an import task can write to. |
|
Table type |
Can be a primary key table or a non-primary key table. Non-primary key tables include fact tables, aggregate tables, and update tables. |
|
Small file score |
An algorithm-based score that evaluates the potential impact of small files. A higher score indicates a more severe problem. |
|
Update bucket count |
The total number of Tablets an import task updates. |
|
Write file count |
The total number of Segment files written. |
|
Average write file size |
The average amount of data per written file, calculated by dividing the total data size by the total number of files. |
|
Average write time |
The average time for a file write operation, calculated by dividing the total file write time by the total number of files. |
Top import-heavy tables
This section lists the top 20 tables with the highest number of import tasks and data import transactions.
Import-heavy nodes
You can analyze data balance by importing the statistics for each node. For example, you can analyze whether the writes to each broker are balanced based on the Total Write Size metric.
Table insights
This page displays metrics such as table query frequency, SQL query patterns, data distribution evenness, and tables that were not accessed in the last 90 days. Use these metrics to optimize your tables. The following table describes the key metrics.
|
Metric |
Description |
|
SQL execution count |
The total number of executions of SQL statements that reference this table. A high execution count often suggests that the table design requires optimization. |
|
Associated parameterized SQL count |
The number of parameterized SQL templates associated with the table. Analyze query patterns to optimize the table's design. Additionally, identifying common query patterns can help you decide whether to create a materialized view for this table. |
|
CV of tablet data size |
The coefficient of variation (CV) of tablet data size measures how evenly data is distributed across tablets within a partition. It is calculated by dividing the standard deviation of tablet data size by the average size within the same partition. A higher CV suggests a greater likelihood of data skew in the partition. |
Cache analysis
This page displays statistics on cache-related metrics for shared-data instances. It helps you analyze cache performance across the table, parameterized SQL, and SQL dimensions by viewing top metrics for a selected day.
This feature is not applicable to shared-nothing instances.
Usage
Increasing an instance's cache hit ratio improves query performance. This page analyzes the cache status of an instance based on its Query Profile data. A Query Profile records the execution information of all operators in a query and provides cache-related metrics for in-depth analysis of cache usage.
In a Query Profile, each scan of a table, view, or materialized view corresponds to a CONNECTOR_SCAN operator. The Query Profile provides various metrics for this operator. The following table describes some of the key cache-related metrics.
|
Metric |
Description |
Internal table |
External table |
|
Cache hit volume |
The number of bytes read from the cache. |
CompressedBytesReadLocalDisk |
dataCacheReadBytes |
|
Cache miss volume |
The number of bytes read from remote storage. |
CompressedBytesReadRemote |
FSIOBytesRead |
|
Local I/O count |
The number of I/O operations for reading from the cache. |
IOCountLocalDisk |
dataCacheReadCounter |
|
Remote I/O count |
The number of I/O operations for reading from remote storage. |
IOCountRemote |
FSIOCounter |
|
Local I/O time |
The time taken to read data from the cache. |
IOTimeLocalDisk |
dataCacheReadTimer |
|
Remote I/O time |
The time taken to read data from remote storage. |
IOTimeRemote |
FSIOTime |
You can use the preceding metrics to calculate the following three cache-related indicators:
-
cache hit ratio = cache hit volume / (cache hit volume + cache miss volume)
-
local I/O time percentage = local I/O time / (local I/O time + remote I/O time)
-
local I/O count percentage = local I/O count / (local I/O count + remote I/O count)
The system extracts the preceding metrics from the CONNECTOR_SCAN operators for all SQL statements in a day's Query Profile records. It then groups them by the following three dimensions and calculates metrics such as average cache hit volume and cache hit ratio for each group. This process helps you analyze cache status from different perspectives. The following table describes the use cases for each dimension.
|
Dimension |
Use cases |
|
Table Dimension |
Identifies tables with high scan count, low cache hit ratios, and high cache miss volumes. Optimizing their cache status with methods like cache prefetch can help improve query performance. |
|
Parameterized SQL Dimension |
Analyzes the cache hit status of parameterized SQL with the highest number of |
|
SQL Dimension |
Analyzes individual SQL statements with long query times, low cache hit ratios, or high cache miss volumes. Optimizing the SQL statements or performing cache prefetch on the tables they access can improve query performance. |
Table dimension
Analysis by table provides the following cache-related information:
-
View the cache hit status of tables with the highest scan counts. For example, in the following figure, the table with the highest scan count (6,411) has a cache hit ratio of only 24.2%. Increasing this table's cache hit ratio improves query efficiency. You can perform cache prefetch for such tables with high scan counts and low cache hit ratios to optimize cache usage.
-
Identify tables with low cache hit ratios or high cache miss volumes. You can use cache prefetch to improve their cache status and, in turn, boost the performance of related queries.
In practice, you often need to consider multiple metrics to decide whether to perform cache prefetch for a table. For example, if a table appears in the "Top 20 by Scan Count," "Top 20 by Low Cache Hit Ratio," and "Top 20 by Average Cache Miss Volume" lists, it indicates that the table has a high scan count, involves large data reads, and has a low cache hit ratio. Therefore, you should prioritize it for cache prefetch.
The following table describes the key fields involved.
|
Field |
Description |
|
Number of visits |
The number of |
|
Cache hit rate |
Calculated as |
|
Local I/O time percentage |
Calculated as |
|
Local I/O count percentage |
Calculated as |
|
Average cache hit volume |
Calculated as |
|
Average cache miss volume |
Calculated as |
Parameterized SQL dimension
Parameterized SQL replaces constants in an SQL statement with ? parameters, while preserving the original syntax, removing comments, and adjusting spaces to create a new statement. This process maps SQL statements with similar structures to a single parameterized format, which helps in the comprehensive analysis of similar types of SQL.
This parameterized SQL analysis ranks queries based on metrics such as scan count, cache hit ratio, cache hit volume, and cache miss volume to identify the top parameterized SQL statements and display their related indicators.
This analysis provides the following insights:
-
View the cache hit status of parameterized SQL statements with high scan counts. For example, a parameterized SQL ranked seventh has a scan count of 1,086 and a long average query time of 42.5 seconds, but its cache hit ratio is only 6.5%. Optimizing these SQL statements or prefetching the tables they scan can help you use the cache more effectively and improve query performance.
-
View the cache hit status of parameterized SQL statements with long average query times. For instance, the top-ranked parameterized SQL has an average query time of 201 seconds but only 4 scans, indicating it is a cold query. Whether it needs optimization depends on your business requirements. In contrast, the seventh-ranked parameterized SQL has an average query time of 42.5 seconds and a scan count of 1,086, making it a higher priority for optimization.
-
Identify parameterized SQL statements with low cache hit ratios and high cache miss volumes, and decide whether to optimize them based on their scan counts and average query times.
The following table describes the key fields involved.
|
Field |
Description |
|
Parameterized SQL ID |
The hash value of the parameterized SQL, used as its unique identifier. |
|
Scan count |
The total number of |
|
Cache hit rate |
Calculated as |
|
Local I/O time percentage |
Calculated as |
|
Local I/O count percentage |
Calculated as |
|
Average cache hit volume |
Calculated as |
|
Average cache miss volume |
Calculated as |
|
Parameterized SQL statement |
The text of the parameterized SQL statement. |
SQL dimension
This section ranks SQL statements executed in StarRocks by metrics such as query time, cache hit ratio, cache hit volume, and cache miss volume, and displays the top SQL statements and their corresponding indicators.
Optimizing these SQL statements or performing cache prefetch on the tables they access can improve cache performance.
This page includes ranking dimensions such as Top 20 Slow SQL and Top 20 High Cache Hit Ratio, which respectively show the SQL statements with the longest query times and the highest cache hit ratios, along with their various metrics.
The following table describes the key fields involved.
|
Field |
Description |
|
Query ID |
The unique identifier for an SQL execution in StarRocks. A new ID is generated for each execution. |
|
Query time (s) |
The execution time of the SQL statement, in seconds (s). |
|
Cache hit rate |
Calculated as |
|
Local I/O time percentage |
Calculated as |
|
Local I/O count percentage |
Calculated as |
|
Data table |
All tables, views, and materialized views queried by the SQL statement. |
|
Username |
The user who executed the SQL. |
|
sumSegmentInit |
The sum of the segment initialization time for all |
|
SQL Statements |
The text of the executed SQL statement. |