Power BI is a unified, scalable platform for self-service and enterprise business intelligence (BI). You can use it to model data, perform visual analytics, and create personalized reports. This topic describes how to use Power BI to connect to EMR Serverless Spark and visualize data.
Limitations
You cannot access the data catalogs or tables of Paimon or Iceberg.
Prerequisites
Download and install Power BI. For more information, see Microsoft Power BI.
Create a Spark Thrift Server session and obtain the session token. For more information, see Create a Spark Thrift Server session and Manage Spark Thrift Server sessions.
(Optional) Prepare test data
This topic uses the `user_behavior` table as an example. If you already have test data, you can skip this step.
Click user.csv to download the test data, and then upload the file to Alibaba Cloud Object Storage Service (OSS).
For example, the path used in this topic is
oss://emr-oss-hdfs/spark/user_behavior/user.csv. For more information about how to upload files, see Upload files.Create an SQL session.
Go to the Sessions page.
Log on to the EMR console.
In the left-side navigation pane, choose .
On the Spark page, click the name of the workspace that you want to manage.
In the left-side navigation pane of the EMR Serverless Spark page, choose Operation Center > Sessions.
On the SQL Sessions tab, click Create SQL Session.
On the Create SQL Session page, click Create.
For more information about the parameters, see Manage SQL sessions.
Create a data development job.
On the EMR Serverless Spark page, in the navigation pane on the left, click Development.
On the Development tab, click the
 icon.
icon.In the New dialog box, enter a name, such as `user_behavior`. Leave the type as the default, `SparkSQL`, and click OK.
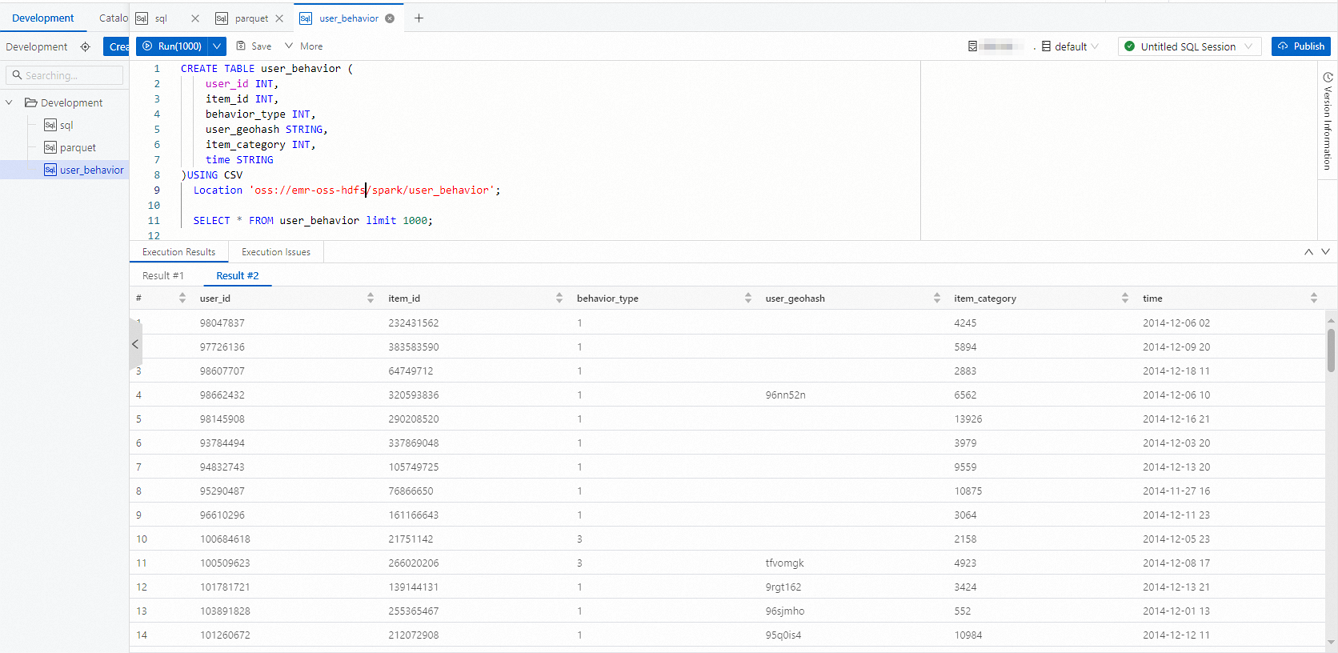
Copy the following code to the new `user_behavior` SparkSQL tab.
CREATE TABLE user_behavior (
    user_id INT,
    item_id INT,
    behavior_type INT,
    user_geohash STRING,
    item_category INT,
    time STRING
)USING CSV
  Location 'oss://emr-oss-hdfs/spark/user_behavior';

  SELECT * FROM user_behavior limit 1000;
Select a database, such as `default`, and select the SQL session instance that you started in a previous step.
Click Run to execute the task.
Use Power BI to connect to EMR Serverless Spark
Choose one of the following methods to connect. If you choose the ODBC method, you must first install and configure Open Database Connectivity (ODBC).
ODBC method
Download and install the Microsoft Spark ODBC Driver. For more information, see Microsoft Spark ODBC Driver.
Configure the ODBC driver.
Open the ODBC Data Source Administrator. On the User DSN tab, click Add.
In the Create New Data Source dialog box, select Microsoft Spark ODBC Driver and click Finish.
In the Microsoft Spark ODBC Driver DSN Setup dialog box, enter the following information. You can use the default settings for the other parameters.
Parameter
Description
Date Source Name
The name of the data source. For example, `serverless_spark_test`.
Host(s)
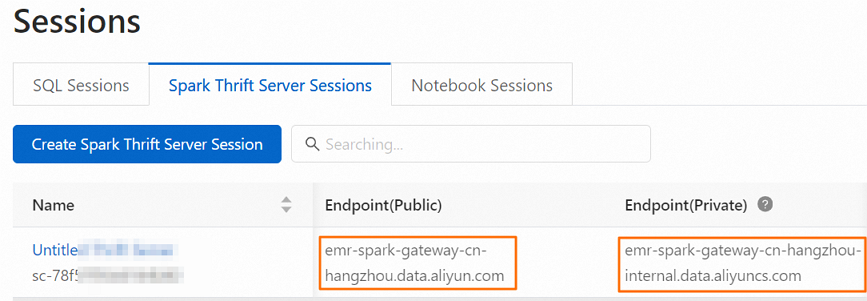
The Public Endpoint or Internal Same-region Endpoint of the Spark Thrift Server session that you created.
Mechanism
The authentication method. Select User Name and Password.
User Name
The token name from the Token Management tab.
Password
The token from the Token Management tab.
Click HTTP Options. In the HTTP Path field, enter
/cliserviceand click OK.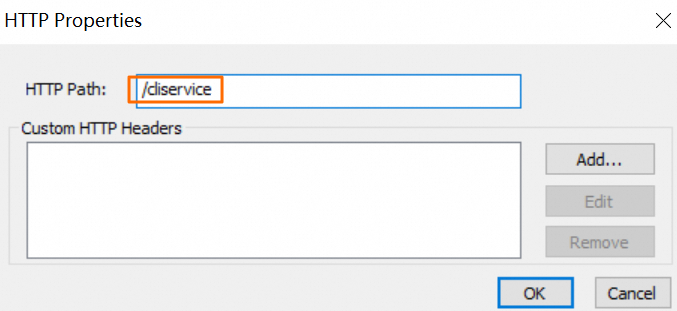
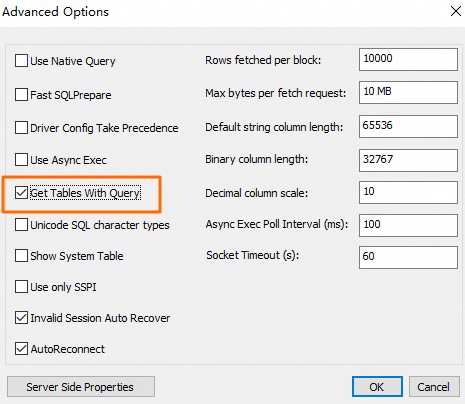
(Optional) Click Advanced Options. In the dialog box that appears, select Get Tables With Query and click OK.
NoteConfigure this option if Paimon or Iceberg tables exist in the default catalog.
In the Microsoft Spark ODBC Driver DSN Setup dialog box, click Test to test the connectivity.
If the returned message contains
SUCCESS, the ODBC driver is successfully connected to the Serverless Spark Thrift Server.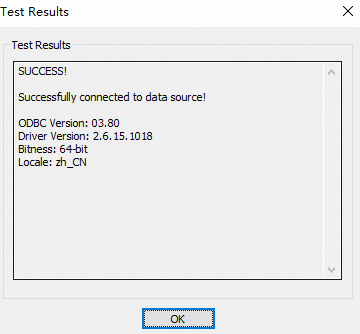
In the Microsoft Spark ODBC Driver DSN Setup dialog box, click OK to save the DSN configuration.
Connect to EMR Serverless Spark.
Open Power BI Desktop. On the Home tab, click Get Data From Other Sources.
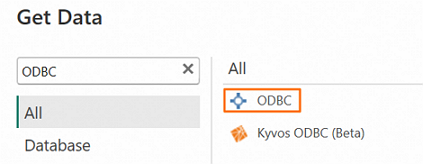
In the Get Data dialog box, on the All tab, search for and select ODBC, and then click Connect.
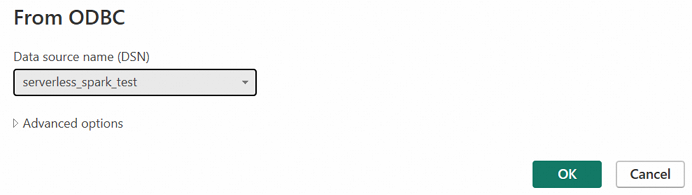
Select the data source name that you just saved (`serverless_spark_test`) and click OK.
In the dialog box that appears, on the Windows tab, select Use My Current Credentials and click Connect.
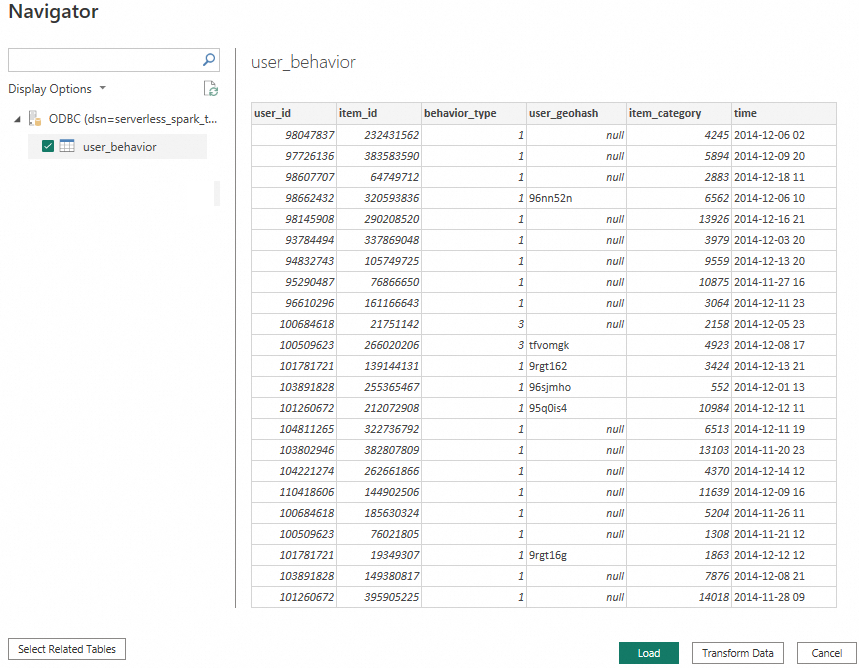
In the Navigator dialog box, select the table to import and click Load.
Spark method
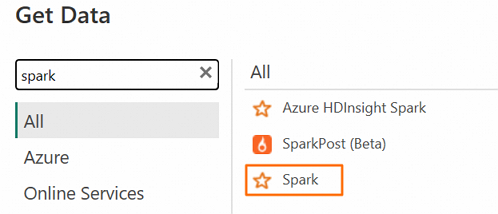
Open Power BI Desktop. On the Home tab, click Get Data From Other Sources.
In the Get Data dialog box, on the All tab, search for and select Spark, and then click Connect.
In the dialog box that appears, configure the connection information and click OK.
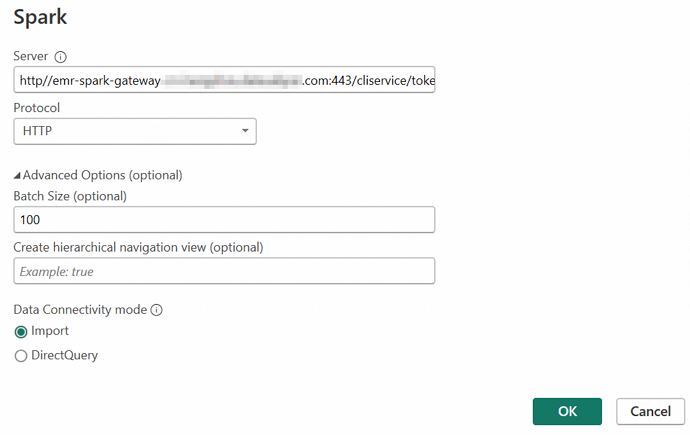 When you connect to the Spark Thrift Server, replace the following information as needed.
Parameter
Description
Server
Enter the server address in the format
http://<endpoint>:<port>/cliservice/token/<token>. Details:<endpoint>: The Public Endpoint or Internal Same-region Endpoint of the Spark Thrift Server session that you created.<port>: The port number. The port number is 443 when you access the server by using a public endpoint, and 80 when you access the server by using an internal same-region endpoint.<token>: The token from the Token Management tab.
Protocol
Select HTTP.
Data Connectivity Mode
Valid values:
Import: Copies data to Power BI.
DirectQuery: Dynamically requests data from the connected data source.
NoteDirectQuery is more suitable in the following scenarios:
The data source contains a large amount of data.
Near Real-Time data is required.
Advanced Options
For this example, you do not need to configure these options. Keep the default values. You can also configure these options for fine-grained control as needed.
In the dialog box that appears, enter the username and password, and then click Connect.
Parameter
Description
Username
The token name from the Token Management tab.
Password
The token from the Token Management tab.
In the Navigator dialog box, select the table to import and click Load.
Use Power BI for visual analytics
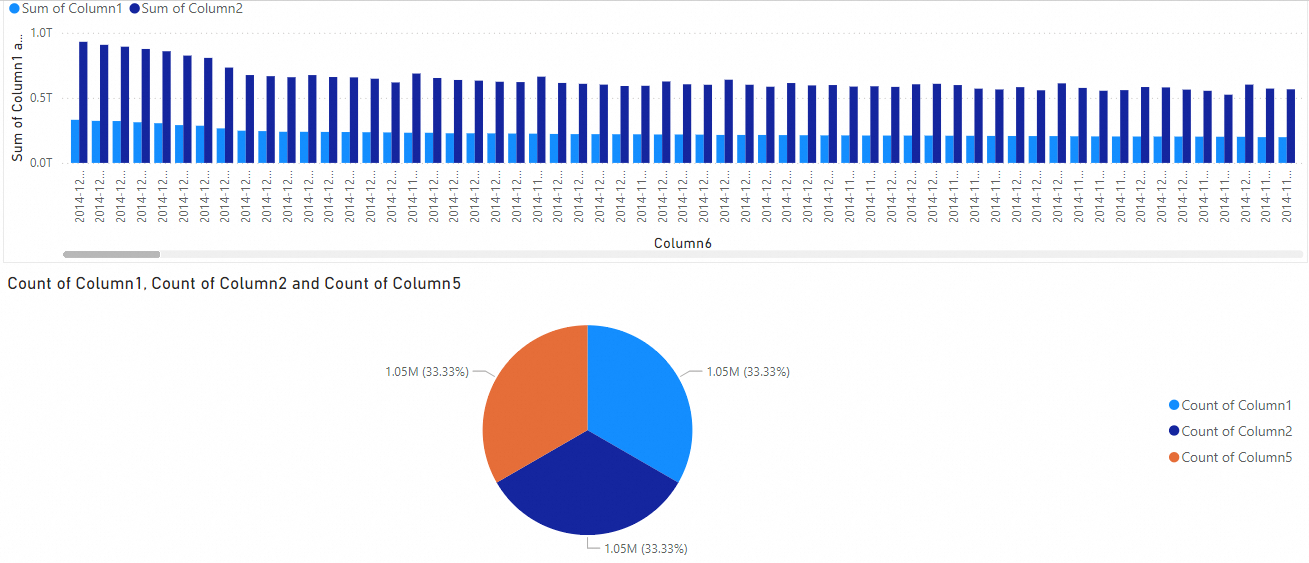
On the View tab of the report, in the Visualizations pane, select a chart.
In the Data pane, select the table columns that you want to visualize. The visualization for this example is shown in the following figure.
(Optional) Click the
 icon in the upper-left corner to save the report.
References
For more information about Power BI Desktop, see Get started with Power BI Desktop.