For time series data, data volumes increase over time. If you want to store large volumes of data, the storage costs will linearly increase. In this scenario, you can use the rollup mechanism of Elasticsearch to store data at a fraction of the cost. The following procedure demonstrates how to use the rollup mechanism to summarize Logstash traffic data.
Prerequisites
You have the manage or manage_rollup permission.
To use the rollup mechanism, you must have the manage or manage_rollup permission. For more information, see Security privileges.
You have created an Alibaba Cloud Elasticsearch instance.
For more information, see Create an Alibaba Cloud Elasticsearch cluster. This topic uses an Alibaba Cloud Elasticsearch V7.4 instance of the Standard Edition as an example.
NoteThe rollup commands listed in this topic are of Elasticsearch V7.4. For more information about commands of Elasticsearch V6.x, see rollup job descriptions.
Background information
Requirements:
Elasticsearch provides hourly summaries of the networkoutTraffic and networkinTraffic fields at intervals of 15 minutes. The networkoutTraffic and networkinTraffic fields correspond to a specific instance ID.
Elasticsearch uses charts presented on the Kibana console to visualize the data of the networkoutTraffic and networkinTraffic fields.
In this topic, the index that is prefixed by monitordata-logstash-sls-* is used as an example. * indicates the date in the format of YYYY-MM-DD. This type of index is generated on a daily basis. Mapping format of the index:
"monitordata-logstash-sls-2020-04-05" : {
    "mappings" : {
      "properties" : {
        "@timestamp" : {
          "type" : "date"
        },
        "__source__" : {
          "type" : "text",
          "fields" : {
            "keyword" : {
              "type" : "keyword",
              "ignore_above" : 256
            }
          }
        },
        "disk_type" : {
          "type" : "text",
          "fields" : {
            "keyword" : {
              "type" : "keyword",
              "ignore_above" : 256
            }
          }
        },
        "host" : {
          "type" : "keyword"
        },
        "instanceId" : {
          "type" : "keyword"
        },
        "metricName" : {
          "type" : "keyword"
        },
        "monitor_type" : {
          "type" : "keyword"
        },
        "networkinTraffic" : {
          "type" : "double"
        },
        "networkoutTraffic" : {
          "type" : "double"
        },
        "node_spec" : {
          "type" : "keyword"
        },
        "node_stats_node_master" : {
          "type" : "keyword"
        },
        "resource_uid" : {
          "type" : "keyword"
        }
      }
    }
  }
}You can run the commands provided in this topic in the Kibana console. For more information, see Log on to the Kibana console.
Procedure
Step 1: Create a rollup job
This step provides the instructions on how to run a job, when to index a document, and which queries are performed on rollup indexes. The following example uses the PUT _rollup/job command to define rollup jobs within an hour.
PUT _rollup/job/ls-monitordata-sls-1h-job1
{
    "index_pattern": "monitordata-logstash-sls-*",
    "rollup_index": "monitordata-logstash-rollup-1h-1",
    "cron": "0 */15 * * * ?",
    "page_size" :1000,
    "groups" : {
      "date_histogram": {
        "field": "@timestamp",
        "fixed_interval": "1h"
      },
      "terms": {
        "fields": ["instanceId"]
      }
    },
    "metrics": [
        {
            "field": "networkoutTraffic",
            "metrics": ["sum"]
        },
        {
            "field": "networkinTraffic",
            "metrics": ["sum"]
        }
    ]
}
Parameter | Required | Type | Description |
| Yes | string | The index or index pattern of the rollup job. Wildcards (*) are supported. |
| Yes | string | The index of the rollup summary. Wildcards are not supported, and a complete name is required. |
| Yes | string | The interval between rollup jobs. It is independent of the interval at which data is rolled up. |
| Yes | integer | The number of bucket results that are processed on each iteration of the rollup index. A larger value indicates faster processing and higher memory usage during the processing. |
| Yes | object | Allows you to define the grouping fields and aggregation methods for jobs. |
└ | Yes | object | Allows you to roll up the date field to a time-based bucket. |
└ | Yes | string | The date field you want to roll up. |
└ | Yes | time units | The interval at which data is rolled up. For example, if this parameter is set to 1h, the date field specified by the field parameter is rolled up on an hourly basis. This parameter specifies the minimum interval at which data is rolled up. |
| No | object | None. |
└ | Yes | string | The terms field set. Fields in this array can be of the keyword or numberic type, and arranged with no order required. |
| No | object | None. |
└ | Yes | string | The field of the metrics you want to collect. In the preceding code, this parameter is set to networkoutTraffic and networkinTraffic. |
└ | Yes | array | The operator you want to use for aggregation. If this parameter is set to sum, the sum of the networkinTraffic field is calculated. This parameter can be set to min, max, sum, average, or value count. |
└ indicates a child parameter.
For more information about these parameters, see Create rollup jobs API. Note the following points when you configure parameters:
If
index_patternis set to a wildcard pattern, make sure that the value of index_pattern is different from that ofrollup_index. Otherwise, an error is returned.The mapping of rollup_index is of the object type. Make sure that index_pattern is not set to the same value as rollup_index. Otherwise, an error is returned.
The rollup job supports only date histogram aggregation, histogram aggregation, and terms aggregation. For more information, see Rollup aggregation limitations.
Step 2: Start the rollup job and view the job information
Start the rollup job.
POST _rollup/job/ls-monitordata-sls-1h-job1/_startView the configuration, statistics, and status of the rollup job.
GET _rollup/job/ls-monitordata-sls-1h-job1/For more information, see Get rollup jobs API.
If the command is executed successfully, the following result is returned:
{
     ........
      "status" : {
        "job_state" : "indexing",
        "current_position" : {
          "@timestamp.date_histogram" : 1586775600000,
          "instanceId.terms" : "ls-cn-ddddez****"
        },
        "upgraded_doc_id" : true
      },
      "stats" : {
        "pages_processed" : 3,
        "documents_processed" : 11472500,
        "rollups_indexed" : 3000,
        "trigger_count" : 1,
        "index_time_in_ms" : 766,
        "index_total" : 3,
        "index_failures" : 0,
        "search_time_in_ms" : 68559,
        "search_total" : 3,
        "search_failures" : 0
      }
}
Step 3: Query the data of the rollup index
When the rollup job is executed, the structure of the rollup document is different from that of the raw data. The rollup query port rebuilds the Query DSL into a pattern that matches the rollup document, obtains the response, and restores the Query DSL to the pattern expected by the client that is used for the original query.
Use match_all to obtain all data of the rollup index.
GET monitordata-logstash-rollup-1h-1/_search
{
  "query": {
    "match_all": {}
  }
}
Only one rollup index can be specified for a query. Fuzzy match is not supported. Multiple indexes can be specified for a real-time data query.
The following queries are supported: term queries, terms queries, range queries, match all queries, and any compound queries. Compound queries are combinations of queries, including Boolean queries, boosting queries, and constant score queries. For more limits, see Rollup search limitations.
Use
_rollup_searchto obtain the sum of networkoutTraffic.GET /monitordata-logstash-rollup-1h-1/_rollup_search { "size": 0, "aggregations": { "sum_temperature": { "sum": { "field": "networkoutTraffic" } } } }_rollup_searchsupports subsets of common search operation features:query: the Query DSL parameter with specific limits. For more information, see Rollup search limitations and Rollup aggregation limitations.
aggregations: the aggregation parameter.
_rollup_searchdoes not support the following features:size: Set this parameter to 0 or do not specify this parameter. This is because rollup is used only for data aggregation and the query result cannot be returned.
Parameters such as highlighter, suggestors, post_filter, profile, and explain are not supported.
Step 4: Create a rollup index pattern
Log on to the Kibana console.
For more information, see Log on to the Kibana console.
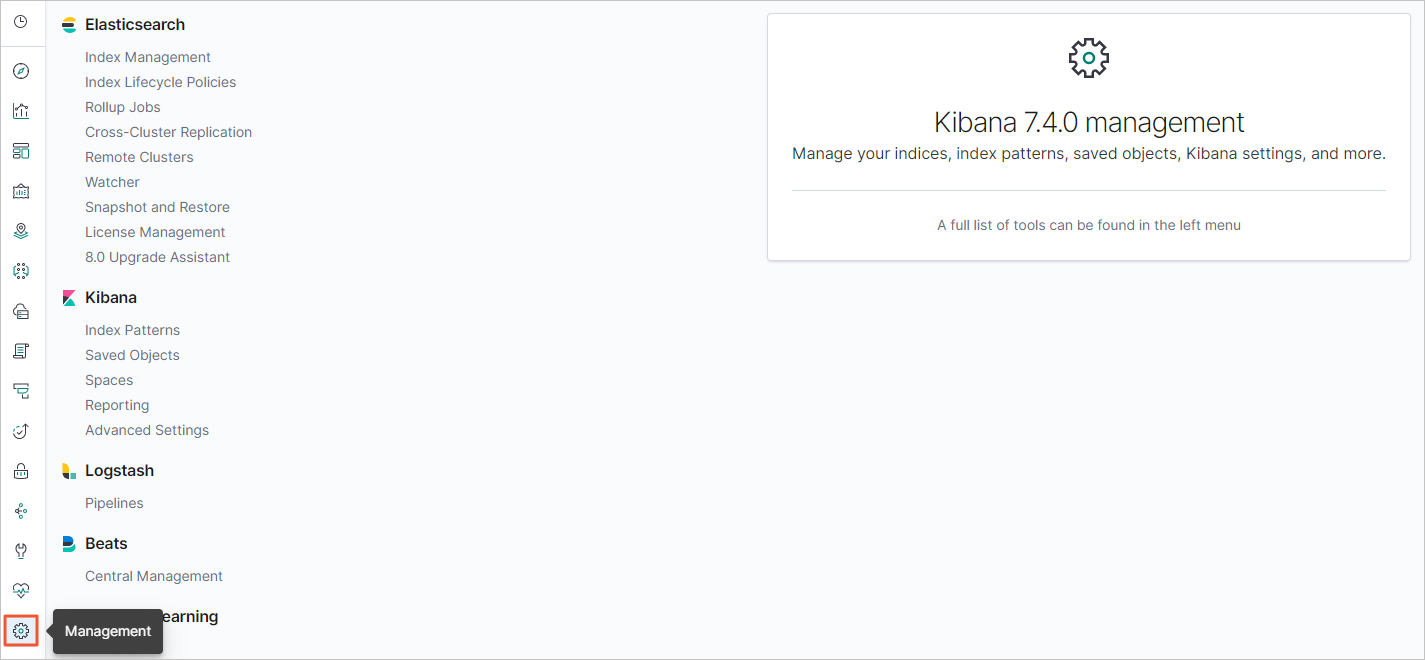
In the left-side navigation pane, click the Management icon.
In the Kibana area, click Index Patterns.
Optional:Close the About index patterns page.
NoteSkip this step if this is not the first time you created an index pattern.
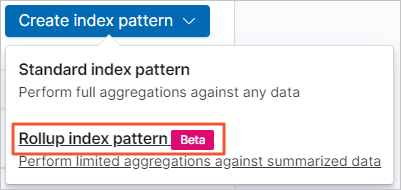
Choose .
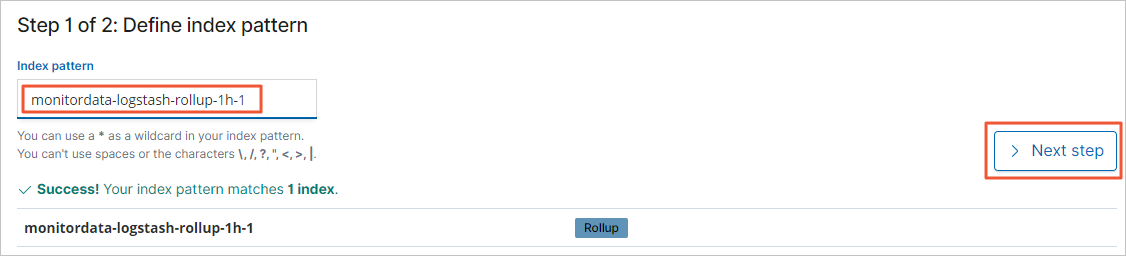
In the Index pattern field, enter an index pattern name such as monitordata-logstash-rollup-1h-1, and then click Next step.
From the Time Filter field name drop-down list, select @timestamp.
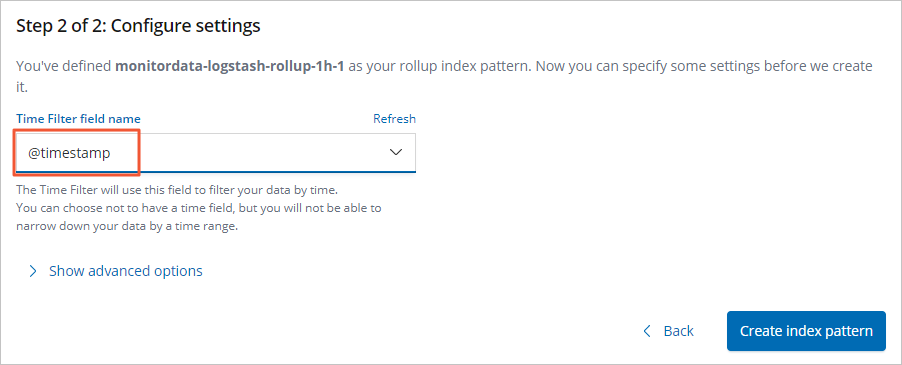
Click Create index pattern.
Step 5: Create a chart for traffic monitoring in the Kibana console
The following procedure demonstrates how to create networkinTraffic and networkoutTraffic charts for the rollup index in the Kibana console.
Log on to the Kibana console.
For more information, see Log on to the Kibana console.
Create a line chart.
In the left-side navigation pane, click the Visualize icon.
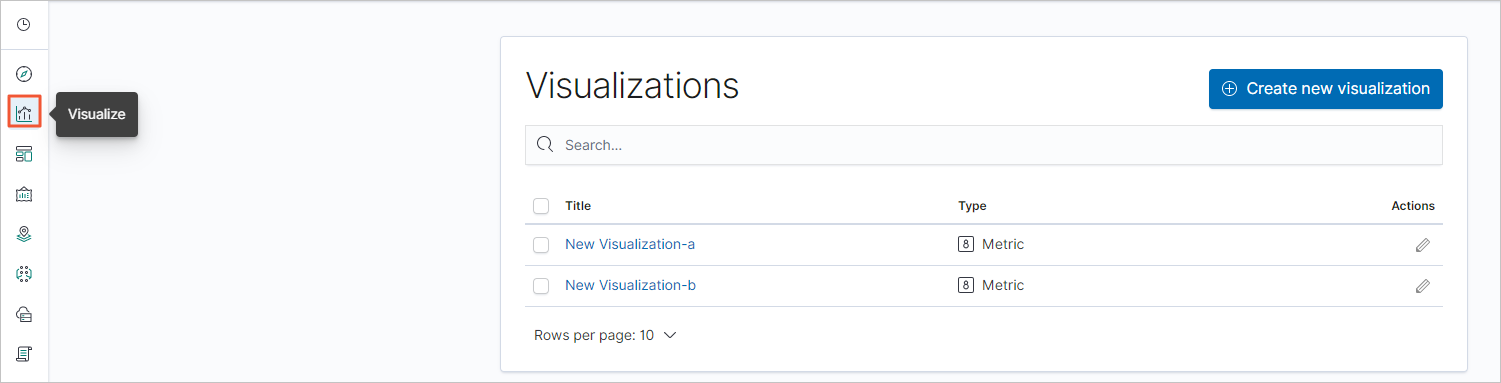
Click Create new visualization.
In the New Visualization dialog box that appears, click Line.
In the index pattern list, click the created rollup index pattern.
Specify parameters in Metrics and Buckets.
In the Metrics section, click
 .
.Specify Y-axis parameters.
Parameter
Description
Aggregation
Set the parameter value to Sum.
Field
Set the parameter value to networkinTraffic or networkoutTraffic.
Custom label
Enter a custom Y-axis label.
In the Buckets section, choose .
Specify X-axis parameters.
Parameter
Description
Aggregation
Set the parameter value to
date_histogramdefined forgroupin Step 1: Create a rollup job.Field
Set the parameter value to @timestamp.
Minimum interval
The default value is the aggregation time granularity defined in the rollup job. The value must be an integer multiple of the rollup interval, such as 2h or 3h.
Click the
 icon.
icon.
In the top navigation bar, click Save.
Create a gauge chart in the same way.
Step 6: Create a traffic monitoring dashboard in the Kibana console
In the Kibana console, click the Dashboard icon in the left-side navigation pane.
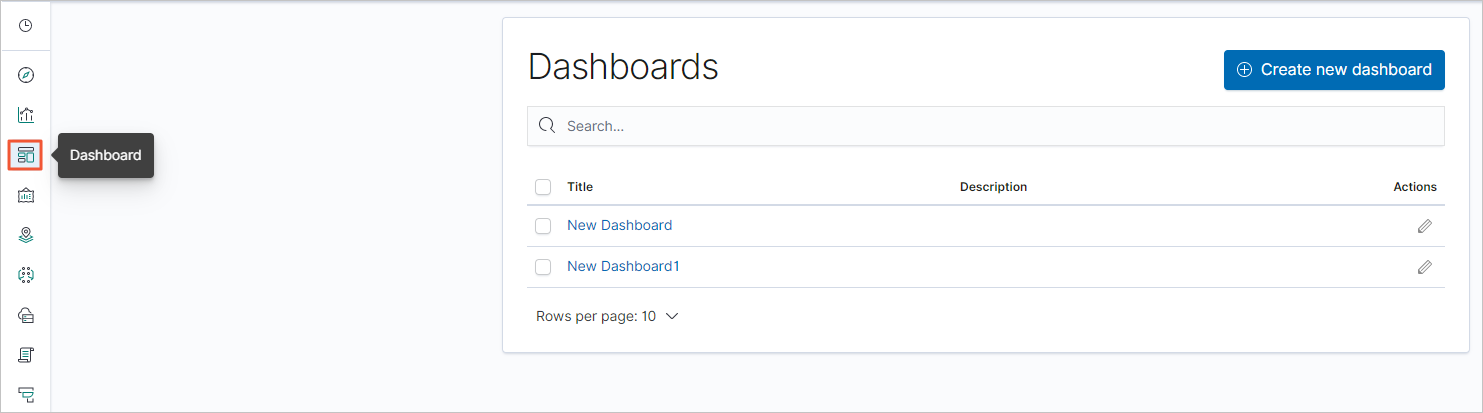
Click Create new dashboard.
In the top navigation bar, click Add.
On the Add panels page, click the chart configured in Step 5.
Close the Add panels page. In the top navigation bar, click Save.
Modify the dashboard name and click Confirm Save.
After the dashboard configuration is saved, you can view the dashboard.
Click + Add filter, select a filter item, configure the filter conditions, and click Save.