Elastic Stack provides the integrated monitoring feature. This feature allows you to use Kibana to analyze and display the logs, metrics, and application performance monitoring (APM) data of a Container Service for Kubernetes (ACK) cluster in a centralized manner. If you deploy your applications in the pods of an ACK cluster, you can view the logs generated by the pods, event metrics of the hosts and network, and APM data in the Kibana console. This facilitates troubleshooting. This topic describes how to implement integrated monitoring for an ACK cluster.
Prerequisites
An Alibaba Cloud Elasticsearch cluster is created, a whitelist is configured for the cluster, and the Auto Indexing feature is enabled for the cluster. In this example, An Alibaba Cloud Elasticsearch V6.8 cluster is created.
For more information, see Create an Alibaba Cloud Elasticsearch cluster, Configure a public or private IP address whitelist for an Elasticsearch cluster, and Configure the YML file.
An ACK cluster is created, and pods are created in the cluster. In this example, the ACK cluster version 1.18.8-aliyun.1 is used, and each Elastic Compute Service (ECS) instance used for the cluster has 2 vCPUs and 8 GiB of memory.
For more information, see Create an ACK managed cluster.
The kubectl client is configured and can be used to access the ACK cluster.
For more information, see Obtain the kubeconfig file of a cluster and use kubectl to connect to the cluster.
Background information
This topic describes how to use Elastic Stack to implement integrated monitoring for an ACK cluster. For more information, see the following sections:
For more information about the features of Metricbeat, Filebeat, and Elastic APM, see Infrastructure monitoring, Log monitoring, and Elastic APM.
Use Metricbeat to collect metrics
The following controllers can be used to deploy Metricbeat to the ACK cluster:
DaemonSet: The DaemonSet controller ensures that each node in the cluster runs one pod. This enables Metricbeat to collect host metrics, system metrics, Docker statistics, and the metrics of all the services that are run on the ACK cluster.
Deployment: You can use the Deployment controller to deploy a single Metricbeat shipper. The shipper is used to retrieve the unique metrics of the ACK cluster, such as metrics for Kubernetes events and the kube-state-metrics service.
In this example, both the DaemonSet and Deployment controllers are used to deploy Metricbeat to the ACK cluster. You can also use only the DaemonSet or Deployment controller to deploy Metricbeat.
Metricbeat depends on the monitoring feature provided by the kube-state-metrics service. Before you deploy Metricbeat, you must make sure that kube-state-metrics is deployed. By default, kube-state-metrics is deployed in the arms-prom namespace of a container in an ACK cluster.
Use the kubectl client to access the ACK cluster and download the Metricbeat configuration file.
curl -L -O https://raw.githubusercontent.com/elastic/beats/6.8/deploy/kubernetes/metricbeat-kubernetes.yamlModify the Metricbeat configuration file.
ImportantThe official Metricbeat configuration file uses the extensions/v1beta1 API version for DaemonSets and Deployments. This API version is deprecated in ACK V1.18 and later. You must modify the Metricbeat configuration file to use the apps/v1 API version for Kubernetes, DaemonSets, Deployments, and ReplicaSets in ACK V1.18 and later.
Modify the configurations in kind: Deployment and kind: DaemonSet.
Modify environment variables. The following code provides an example:
env: - name: ELASTICSEARCH_HOST value: es-cn-nif23p3mo0065****.elasticsearch.aliyuncs.com - name: ELASTICSEARCH_PORT value: "9200" - name: ELASTICSEARCH_USERNAME value: elastic - name: ELASTICSEARCH_PASSWORD value: **** - name: KIBANA_HOST value: es-cn-nif23p3mo0065****-kibana.internal.elasticsearch.aliyuncs.com - name: KIBANA_PORT value: "5601"NoteBy default, Kibana variables are not defined in the downloaded Metricbeat configuration file. You can use the env parameter to pass the variables.
Parameter
Description
ELASTICSEARCH_HOST
The internal endpoint of your Elasticsearch cluster.
ELASTICSEARCH_PORT
The private port of your Elasticsearch cluster.
ELASTICSEARCH_USERNAME
The username of your Elasticsearch cluster. The default value of this parameter is elastic.
ELASTICSEARCH_PASSWORD
The password that corresponds to the elastic username.
KIBANA_HOST
The internal endpoint of Kibana.
KIBANA_PORT
The private port of Kibana.
Add the spec.selector configurations. The following code provides an example:
## kind: DaemonSet
spec:
  selector:
    matchLabels:
       k8s-app: metricbeat
  template:
    metadata:
      labels:
        k8s-app: metricbeat

## kind: Deployment
spec:
  selector:
    matchLabels:
       k8s-app: metricbeat
  template:
    metadata:
      labels:
        k8s-app: metricbeat
Configure the Kibana output information in name: metricbeat-daemonset-config and name: metricbeat-deployment-config to use the environment variables that are configured in the configuration file.
output.elasticsearch:
      hosts: ['${ELASTICSEARCH_HOST:elasticsearch}:${ELASTICSEARCH_PORT:9200}']
      username: ${ELASTICSEARCH_USERNAME}
      password: ${ELASTICSEARCH_PASSWORD}
setup.kibana:
      host: "https://${KIBANA_HOST}:${KIBANA_PORT}"
setup.dashboards.enabled: true
Modify configurations related to metricbeat-daemonset-modules. Define the system metrics monitored by the System module and the metrics that can be obtained by the Kubernetes module. The System module monitors the following metrics: CPU, load, memory, and network.
NoteFor more information about the configurations and metrics of modules in Metricbeat, see System module and Kubernetes module.
apiVersion: v1
kind: ConfigMap
metadata:
  name: metricbeat-daemonset-modules
  namespace: kube-system
  labels:
    k8s-app: metricbeat
data:
  system.yml: |-
    - module: system
      period: 10s
      metricsets:
        - cpu
        - load
        - memory
        - network
        - process
        - process_summary
        - core
        - diskio
        - socket
      processes: ['.*']
      process.include_top_n:
        by_cpu: 5      # include top 5 processes by CPU
        by_memory: 5   # include top 5 processes by memory

    - module: system
      period: 1m
      metricsets:
        - filesystem
        - fsstat
      processors:
      - drop_event.when.regexp:
          system.filesystem.mount_point: '^/(sys|cgroup|proc|dev|etc|host|lib)($|/)'
  kubernetes.yml: |-
    - module: kubernetes
      metricsets:
        - node
        - system
        - pod
        - container
        - volume
      period: 10s
      host: ${NODE_NAME}
      hosts: ["localhost:10255"]
Modify configurations related to metricbeat-deployment-modules to obtain the metrics for kube-state-metrics and Kubernetes events.
ImportantThe Metricbeat service is deployed in the kube-system namespace. The kube-state-metrics service is deployed in the arms-prom namespace by default. The two services belong to different namespaces. Therefore, specify the hosts parameter in the format of kube-state-metrics.<namespace>:8080. If the Metricbeat and kube-state-metrics services are deployed in the same namespace, set the hosts parameter to kube-state-metrics:8080.
apiVersion: v1
kind: ConfigMap
metadata:
  name: metricbeat-deployment-modules
  namespace: kube-system
  labels:
    k8s-app: metricbeat
data:
  # This module requires `kube-state-metrics` up and running under `kube-system` namespace
  kubernetes.yml: |-
    - module: kubernetes
      metricsets:
        - state_node
        - state_deployment
        - state_replicaset
        - state_pod
        - state_container
      period: 10s
      host: ${NODE_NAME}
      hosts: ["kube-state-metrics.arms-prom:8080"]
    # Uncomment this to get k8s events:
    - module: kubernetes
      metricsets:
        - event
Create a role and assign the role to Metricbeat to implement role-based access control (RBAC). This ensures that Metricbeat can obtain the resource information of the ACK cluster.
apiVersion: rbac.authorization.k8s.io/v1beta1
kind: ClusterRoleBinding
metadata:
  name: metricbeat
subjects:
- kind: ServiceAccount
  name: metricbeat
  namespace: kube-system
roleRef:
  kind: ClusterRole
  name: metricbeat
  apiGroup: rbac.authorization.k8s.io
---
apiVersion: rbac.authorization.k8s.io/v1beta1
kind: ClusterRole
metadata:
  name: metricbeat
  labels:
    k8s-app: metricbeat
rules:
- apiGroups: [""]
  resources:
  - nodes
  - namespaces
  - events
  - pods
  verbs: ["get", "list", "watch"]
- apiGroups: ["extensions"]
  resources:
  - replicasets
  verbs: ["get", "list", "watch"]
- apiGroups: ["apps"]
  resources:
  - statefulsets
  - deployments
  verbs: ["get", "list", "watch"]
- apiGroups:
  - ""
  resources:
  - nodes/stats
  verbs:
  - get
---
apiVersion: v1
kind: ServiceAccount
metadata:
  name: metricbeat
  namespace: kube-system
  labels:
    k8s-app: metricbeat
---
Deploy Metricbeat in the ACK cluster and view the resources of the cluster.
Use the kubectl client to run the following commands:
kubectl apply -f metricbeat-kubernetes.yaml kubectl get pods -n kube-systemImportantYou must make sure that the resources in the pods are running. Otherwise, data may not be displayed in the Kibana console.
View the monitored data in the Kibana console.
Log on to the Kibana console of your Elasticsearch cluster.
For more information, see Log on to the Kibana console.
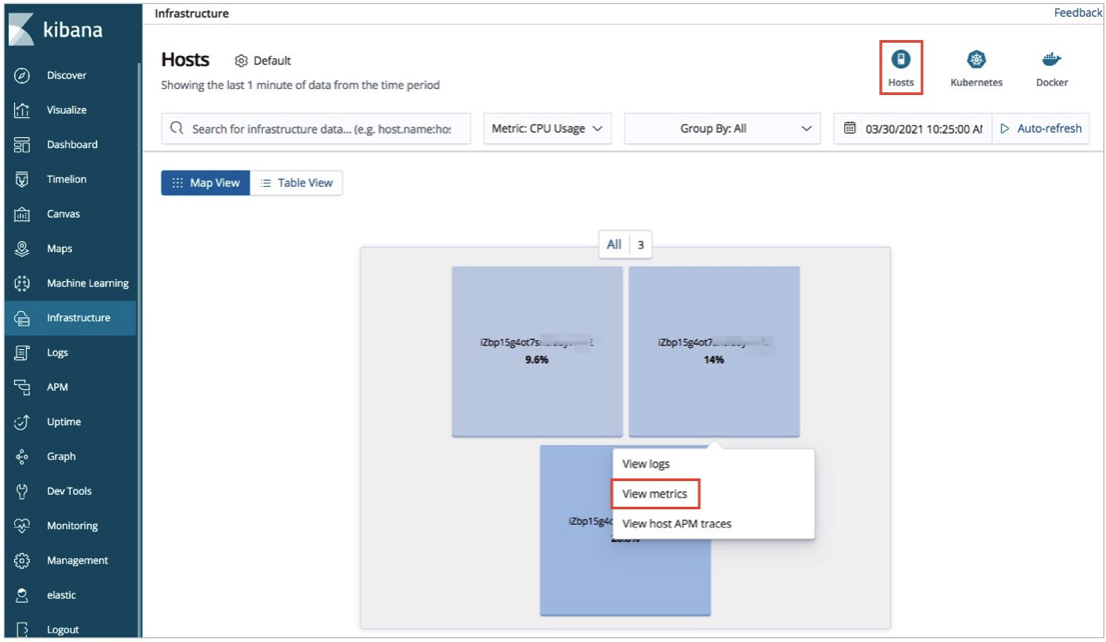
In the left-side navigation pane, click Infrastructure.
View the statistics on the metrics of the hosts and pods in the ACK cluster.
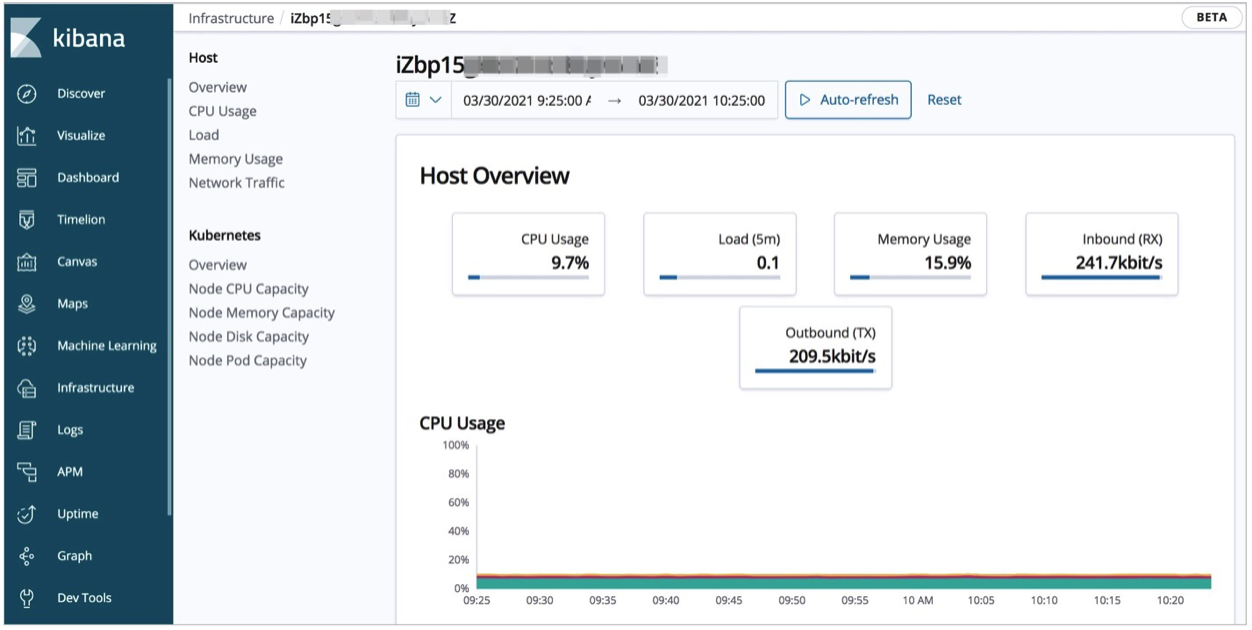
View the statistics on the metrics of the hosts: On the Infrastructure page, click Hosts in the upper-right corner. On the Map View tab, click a host and select View metrics. Then, you can view the statistics on the CPU, load, and memory metrics.
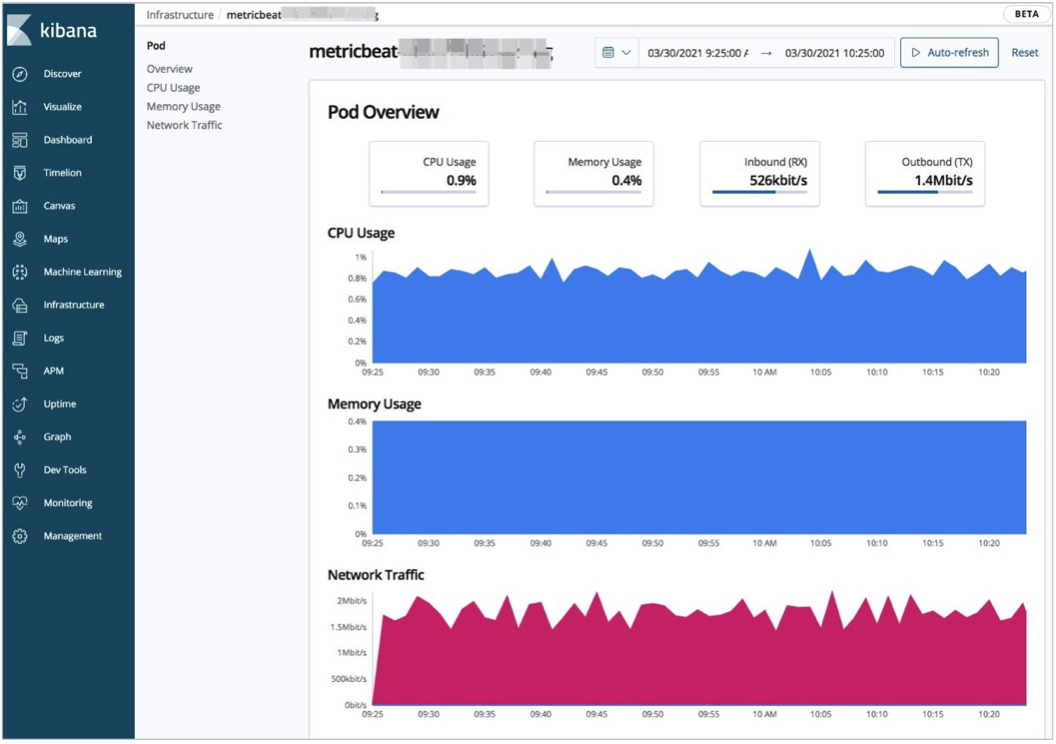
View the statistics on the metrics of the pods in the ACK cluster: On the Infrastructure page, click Kubernetes in the upper-right corner. On the Map View tab, click a pod and select View metrics. Then, you can view the statistics on the CPU, memory, and network metrics.
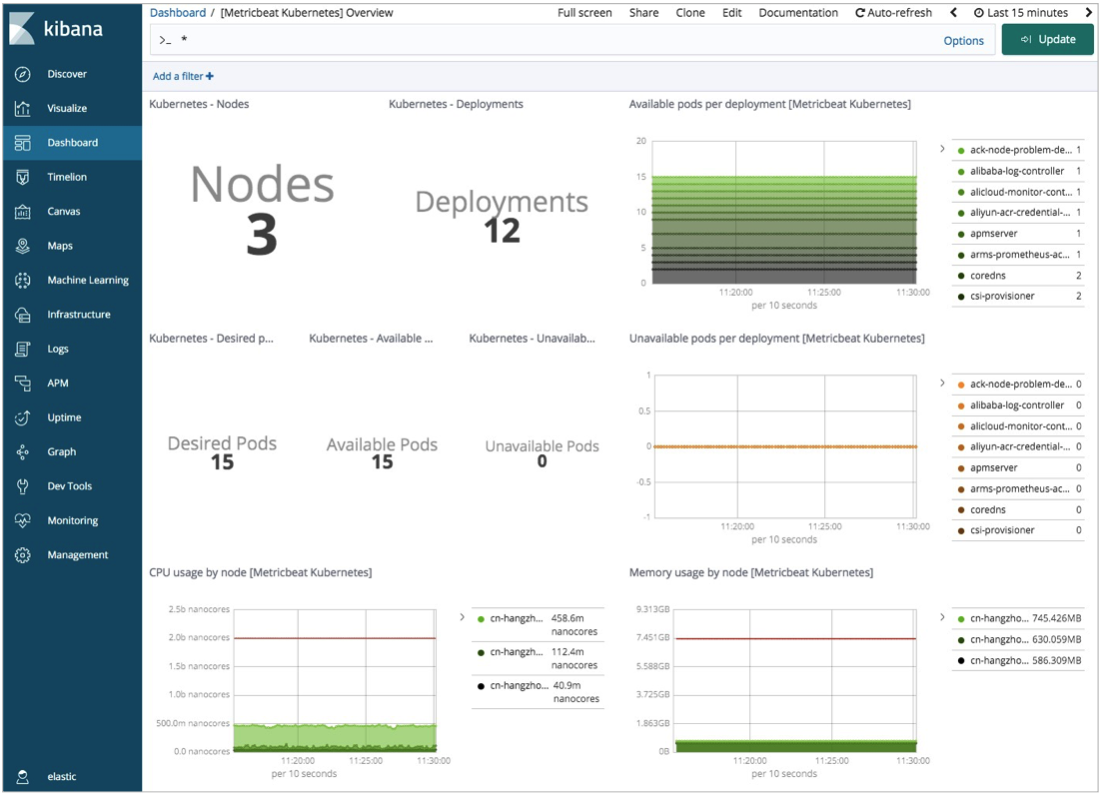
View the overall statistics on the resources of the ACK cluster.
Click Dashboard in the left-side navigation pane. On the Dashboards page, click [Metricbeat Kubernetes] Overview. Then, you can view the overall statistics on the resources of the ACK cluster.
Use Filebeat to collect logs
In this example, the DaemonSet controller is used to deploy Filebeat. The DaemonSet controller ensures that each node of the ACK cluster runs a pod to collect data. The resources in the Filebeat configuration file are deployed in the kube-system namespace. If you want to change the namespace in which the resources are deployed, you can modify the configuration file.
Download the Filebeat configuration file.
Use the kubectl client to access the ACK cluster and download the Filebeat configuration file.
curl -L -O https://raw.githubusercontent.com/elastic/beats/6.8/deploy/kubernetes/filebeat-kubernetes.yamlModify the Filebeat configuration file.
Modify the configurations in kind: DaemonSet.
env:
- name: ELASTICSEARCH_HOST
  value: es-cn-nif23p3mo0065****.elasticsearch.aliyuncs.com
- name: ELASTICSEARCH_PORT
  value: "9200"
- name: ELASTICSEARCH_USERNAME
  value: elastic
- name: ELASTICSEARCH_PASSWORD
  value: ****
- name: KIBANA_HOST
  value: es-cn-nif23p3mo0065****-kibana.internal.elasticsearch.aliyuncs.com
- name: KIBANA_PORT
  value: "5601"
- name: NODE_NAME
  valueFrom:
     fieldRef:
        fieldPath: spec.nodeName
Parameter
Description
ELASTICSEARCH_HOST
The internal endpoint of your Elasticsearch cluster.
ELASTICSEARCH_PORT
The private port of your Elasticsearch cluster.
ELASTICSEARCH_USERNAME
The username of your Elasticsearch cluster. The default value of this parameter is elastic.
ELASTICSEARCH_PASSWORD
The password that corresponds to the elastic username.
KIBANA_HOST
The internal endpoint of Kibana.
KIBANA_PORT
The private port of Kibana.
NODE_NAME
The hosts in the ACK cluster.
Change the ConfigMap configurations in name: filebeat-config and configure the Kibana output information to use the environment variables configured in the configuration file.
output.elasticsearch:
      hosts: ['${ELASTICSEARCH_HOST:elasticsearch}:${ELASTICSEARCH_PORT:9200}']
      username: ${ELASTICSEARCH_USERNAME}
      password: ${ELASTICSEARCH_PASSWORD}
setup.kibana:
      host: "https://${KIBANA_HOST}:${KIBANA_PORT}"
Configure Filebeat to collect logs from the containers in the ACK cluster.
apiVersion: v1
kind: ConfigMap
metadata:
  name: filebeat-inputs
  namespace: kube-system
  labels:
    k8s-app: filebeat
data:
  kubernetes.yml: |-
    - type: docker
      containers.ids:
      - "*"
      processors:
        - add_kubernetes_metadata:
            host: ${NODE_NAME}
            in_cluster: true
---
Deploy Filebeat in the ACK cluster and view the resources of the cluster.
Use the kubectl client to run the following commands:
kubectl apply -f filebeat-kubernetes.yaml kubectl get pods -n kube-systemImportantYou must make sure that the resources in the pods are running. Otherwise, data may not be displayed in the Kibana console.
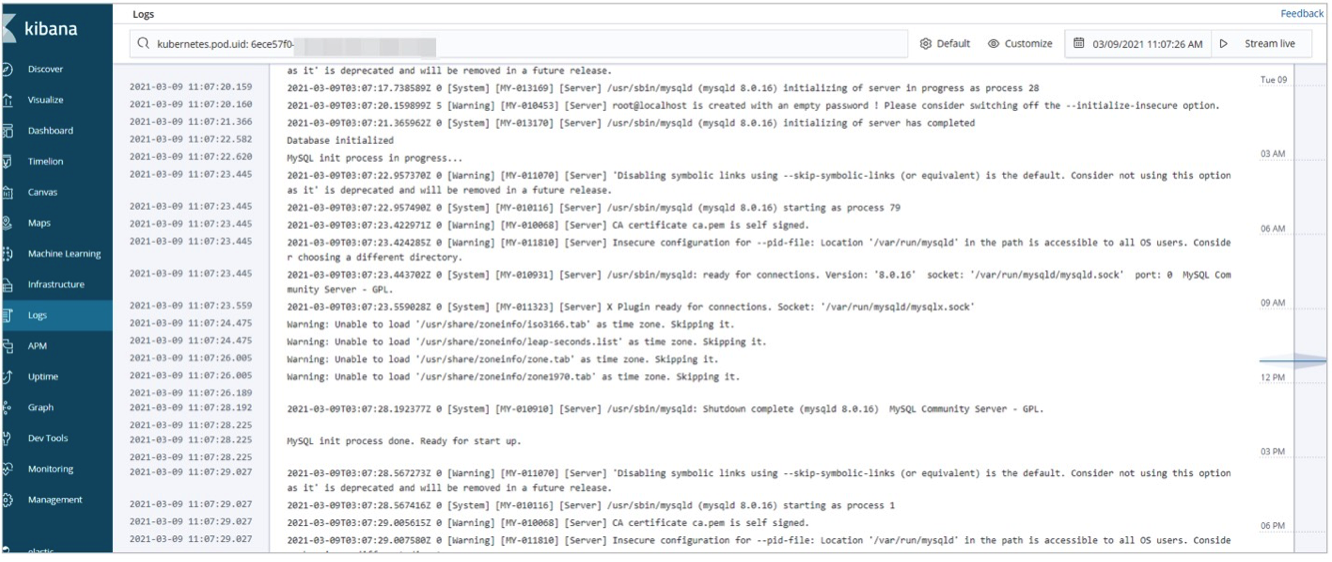
View real-time logs in the Kibana console.
Log on to the Kibana console of your Elasticsearch cluster.
For more information, see Log on to the Kibana console.
View the logs of the hosts and pods in the ACK cluster.
View the logs of the hosts: On the Infrastructure page, click Hosts in the upper-right corner. On the Map View tab, click a host and select View logs. Then, you can view the real-time logs of the host.
View the logs of the pods in the ACK cluster: On the Infrastructure page, click Kubernetes in the upper-right corner. On the Map View tab, click a pod and select View logs. Then, you can view the real-time logs of the pod.
Use Elastic APM to monitor the performance of applications
Elastic APM is an application performance monitoring system built on Elastic Stack. Elastic APM allows you to monitor software services and applications in real time. To implement monitoring and facilitate troubleshooting, Elastic APM collects detailed performance information about response time for requests, database queries, calls to caches, and external HTTP requests. Elastic APM also automatically collects unhandled errors and exceptions. Errors are grouped based on the stacktrace. This helps you identify new errors and understand the number of times specific errors occur.
For more information about Elastic APM, see Elastic APM Overview.
Deploy APM Server to a container.
In this example, APM Server is deployed in the ACK cluster. You can use a ConfigMap controller to define the apm-server.yml file and start APM Server by initializing the pods. Then, you can use a Service object to implement service self-discovery and load balancing.
Configure the apm-server-yml file.
The file contains the following code:
--- apiVersion: v1 kind: ConfigMap metadata: name: apm-deployment-config namespace: kube-system labels: k8s-app: apmserver data: apm-server.yml: |- apm-server.host: "0.0.0.0:8200" output.elasticsearch: hosts: ['${ELASTICSEARCH_HOST:elasticsearch}:${ELASTICSEARCH_PORT:9200}'] username: ${ELASTICSEARCH_USERNAME} password: ${ELASTICSEARCH_PASSWORD} setup.kibana: host: "https://${KIBANA_HOST}:${KIBANA_PORT}" --- apiVersion: apps/v1 kind: Deployment metadata: name: apmserver namespace: kube-system labels: k8s-app: apmserver spec: selector: matchLabels: k8s-app: apmserver template: metadata: labels: k8s-app: apmserver spec: serviceAccountName: apmserver hostNetwork: true dnsPolicy: ClusterFirstWithHostNet containers: - name: apmserver image: docker.elastic.co/apm/apm-server:6.8.14 args: [ "-c", "/etc/apm-server.yml", "-e", ] env: - name: ELASTICSEARCH_HOST value: es-cn-oew20i5h90006****.elasticsearch.aliyuncs.com - name: ELASTICSEARCH_PORT value: "9200" - name: ELASTICSEARCH_USERNAME value: elastic - name: ELASTICSEARCH_PASSWORD value: **** - name: KIBANA_HOST value: es-cn-oew20i5h90006****-kibana.internal.elasticsearch.aliyuncs.com - name: KIBANA_PORT value: "5601" - name: NODE_NAME valueFrom: fieldRef: fieldPath: spec.nodeName securityContext: runAsUser: 0 resources: limits: memory: 50Mi requests: cpu: 20m memory: 30Mi volumeMounts: - name: config mountPath: /etc/apm-server.yml readOnly: true subPath: apm-server.yml volumes: - name: config configMap: defaultMode: 0600 name: apm-deployment-config --- apiVersion: v1 kind: Service metadata: name: apmserver namespace: kube-system labels: k8s-app: apmserver spec: clusterIP: None ports: - name: http-metrics port: 8200 targetPort: 8200 selector: k8s-app: apmserver --- apiVersion: v1 kind: ServiceAccount metadata: name: apmserver namespace: kube-system labels: k8s-app: apmserver ---ImportantWhen you use the Deployment controller to deploy APM Server, the docker.elastic.co/apm/apm-server:6.8.14 image is used to deploy pods. The version of the image must be consistent with that of the Elasticsearch cluster.
Port 8200 is exposed to the ACK cluster by using the Service object. This ensures that APM agents can communicate with APM Server.
Parameter
Description
ELASTICSEARCH_HOST
The internal endpoint of your Elasticsearch cluster.
ELASTICSEARCH_PORT
The private port of your Elasticsearch cluster.
ELASTICSEARCH_USERNAME
The username of your Elasticsearch cluster. The default value of this parameter is elastic.
ELASTICSEARCH_PASSWORD
The password that corresponds to the elastic username.
KIBANA_HOST
The internal endpoint of Kibana.
KIBANA_PORT
The private port of Kibana.
NODE_NAME
The hosts in the ACK cluster.
Deploy APM Server to a container and view the status of APM Server.
Use the kubectl client to run the following commands:
kubectl apply -f apm-server.yml kubectl get pods -n kube-systemImportantYou must make sure that the resources in the pods are running. Otherwise, data may not be displayed in the Kibana console.
Configure APM agents.
In this example, Spring Boot is used to create a simple Spring application and compress the application into a JAR package. Then, the JAR package and the latest Java agent that is downloaded from Maven Central Repository are uploaded to APM Server. For more information, see Spring Boot and Maven Central.
Log on to a node of the ACK cluster and create a Dockerfile named myapply in the working directory.
The Dockerfile must contain the following information:
FROM frolvlad/alpine-oraclejdk8
MAINTAINER peterwanghao.com
VOLUME /tmp
ADD spring-boot-0.0.1-SNAPSHOT.jar spring-boot-0.0.1-SNAPSHOT.jar
ADD elastic-apm-agent-1.21.0.jar elastic-apm-agent-1.21.0.jar
EXPOSE 8080
ENTRYPOINT ["java","-javaagent:/elastic-apm-agent-1.21.0.jar","-Delastic.apm.service_name=my-application","-Delastic.apm.server_url=http://apmserver:8200","-Delastic.apm.application_packages=com.example","-jar","/spring-boot-0.0.1-SNAPSHOT.jar"]
The parameters and Java commands that are used to start the pods are defined in ENTRYPOINT. The following table describes these parameters.
Parameter
Description
-javaagent
The JAR package of the APM agents.
-Delastic.apm.service_name
The name of the Service object. The name can contain letters, digits, hyphens (-), underscores (_), and spaces.
-Delastic.apm.server_url
The URL of APM Server. http://apmserver:8200 is specified in the apm-server.yml file.
-Delastic.apm.application_packages
The basic software package of the application.
-jar
The JAR package of the application.
Use the
docker buildcommand and the Dockerfile myapply to build an image.Run the following command in the current path:
docker build -t myapply .Load the built image to other containers.
Configure the deployment file for the pods. The file is named my-application.yaml.
The file contains the following code:
--- apiVersion: v1 kind: Pod metadata: name: my-apply namespace: kube-system labels: app: my-apply spec: containers: - name: my-apply image: myapply:latest ports: - containerPort: 8080 imagePullPolicy: Never --- apiVersion: v1 kind: Service metadata: name: my-apply namespace: kube-system labels: app: my-apply spec: type: NodePort ports: - name: http-metrics port: 8080 nodePort: 30000 selector: app: my-apply ---Noteimage specifies the built image.
Use the kubectl client to run the following command to deploy the pods:
kubectl apply -f my-application.yamlUse a curl command to access the host over port 30000 after all resources in the pods are running.
Run the following curl command:
curl http://10.7.XX.XX:30000Note10.7.XX.XX specifies the IP address of the node in the ACK cluster.
If the access to the host is successful, APM agents are deployed.
View the monitoring data obtained by Elastic APM in the Kibana console.
Log on to the Kibana console of your Elasticsearch cluster.
For more information, see Log on to the Kibana console.
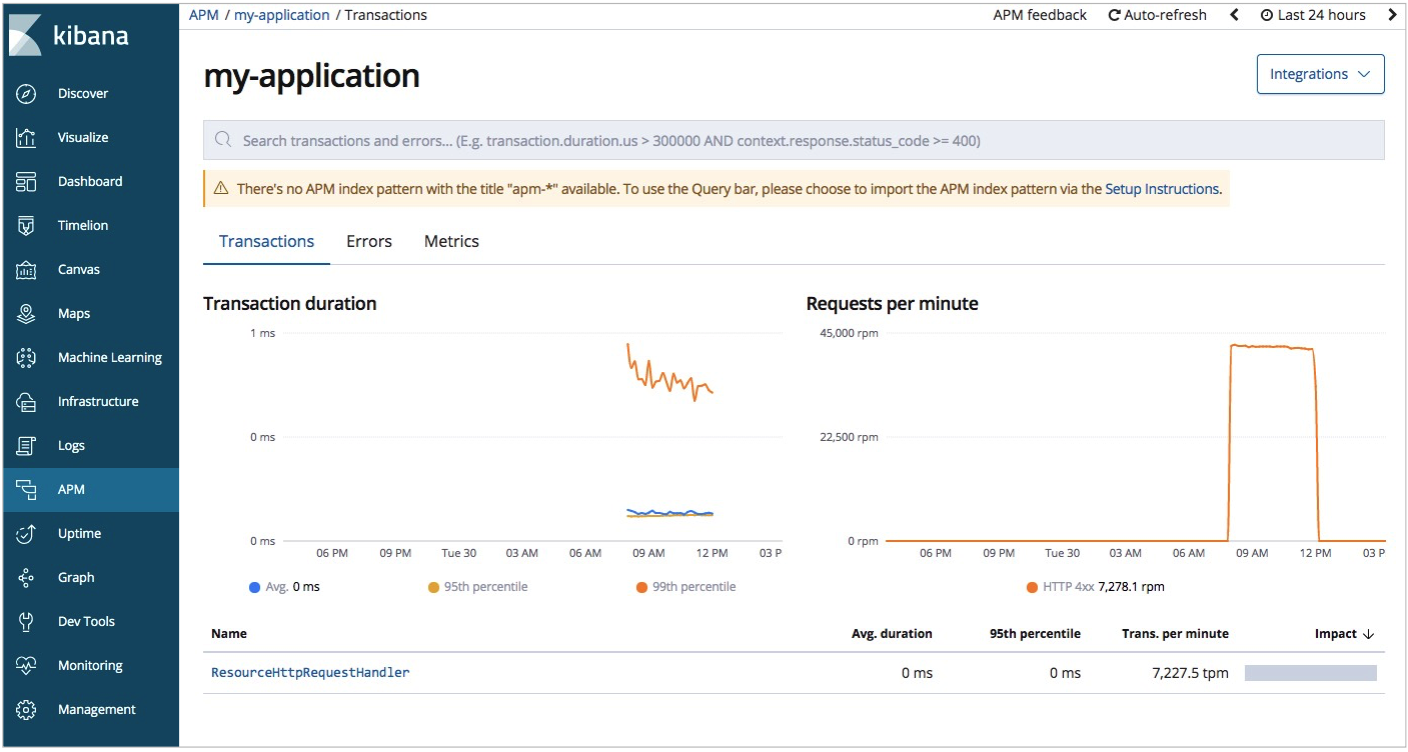
Click APM in the left-side navigation pane.
Find the application whose performance is monitored and click the application name. Then, you can view the overall performance statistics of the application. In this example, my-application is used.
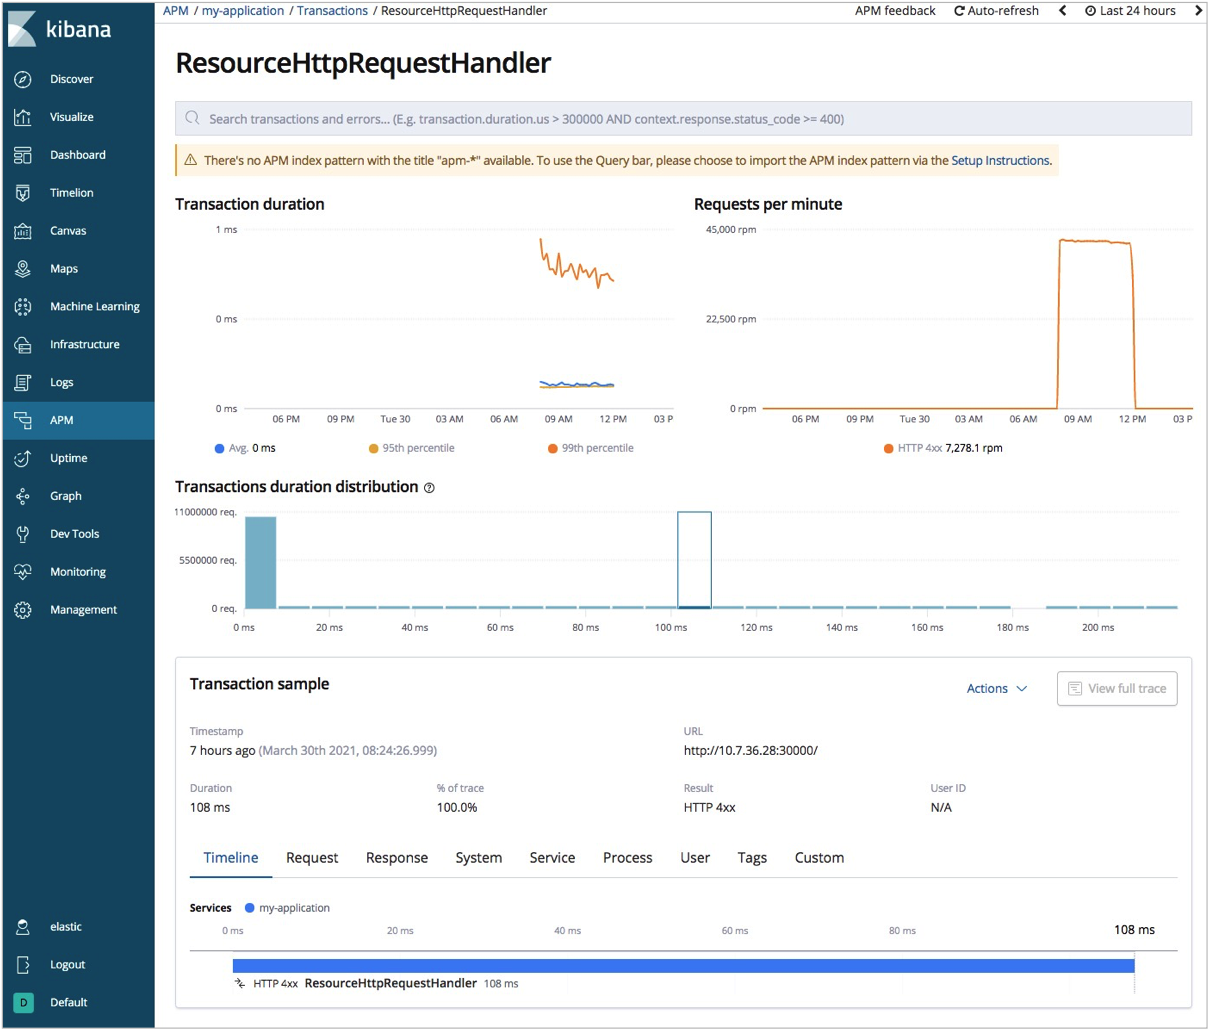
Click the interface that is requested. Then, you can view the detailed request information.
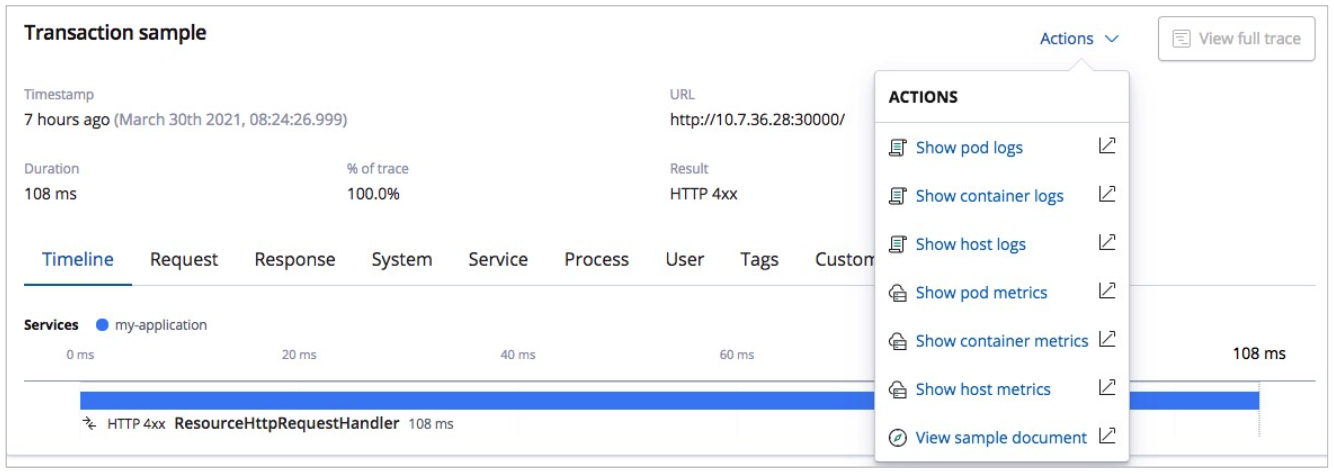
View the statistics on the logs and metrics of the hosts and pods.
Click Actions and select Show pod logs or Show pod metrics. Then, you can view the statistics on the logs or metrics.
FAQ
Problem description: The resources.requests parameter is set to a large value in the configuration file of the ACK cluster. As a result, pods fail to be started.
Solution: Change the value of the resource.requests parameter. The resources.requests parameter must be specified in the configuration files of Metricbeat, Filebeat, and Elastic APM. We recommend that you set this parameter to an appropriate value based on the specifications of the ACK cluster.
Problem description: Errors keep occurring when I deploy Metricbeat, Filebeat, and Elastic APM. The error message is similar to
no matches for kind "DaemonSet" in version "extensions/v1beat1".Solution: Use the apps/v1 API version. This is because that the official configuration file uses the extensions/v1beta1 API version for DaemonSets and Deployments. However, in ACK V1.18 and later, the extensions/v1beta1 API version is deprecated for DaemonSets, Deployments, and ReplicaSets.