Problem description
After enabling Edge Security Acceleration (ESA), the website loads slowly.
Troubleshooting approach
Before troubleshooting, understand how ESA acceleration works. See What is ESA. This helps identify possible causes. In short, ESA adds a layer of cache nodes to the existing network and publishes your web server resources to the node closest to the user. When a client requests a resource, it accesses the nearest ESA node directly and retrieves the cached resource, reducing origin fetches and improving load speed. Possible causes for slow access include the following:
Local client-side network issues, such as insufficient downstream bandwidth or incorrect DNS configuration.
Poor network quality or high latency between the client and the ESA node.
Large resource size causing long download times.
ESA experiences poor network conditions when fetching content from the origin.
The origin server itself responds slowly.
Gather symptoms and relevant information to narrow down the root cause. This step is critical.
First, determine whether the slow access affects all users globally, only specific users, or users in a particular region or from a specific ISP. Alibaba Cloud offers products like Application Real-Time Monitoring Service (ARMS) and Cloud Monitor . Use these to deploy probes in specific regions or ISPs for more accurate diagnostics:
If only a few users experience slow access, the issue likely stems from their local network.
Check if affected users cluster geographically or by ISP—for example, many mobile users in one city report issues while China Unicom and China Telecom users in the same city do not. This suggests an ISP-specific issue in that region. Use diagnostic tools with probes located in that area.
If all users globally experience slow access, the issue likely lies with the origin server response time or configuration—not with ESA nodes or global networks, as it’s highly unlikely all ESA nodes or all regional networks fail simultaneously. Examples include incorrect acceleration region selection, dynamic or non-cacheable requests, or a slow origin server.
Confirm whether the slow or abnormal request is served from the ESA cache:
If a request hits the ESA cache, then there is no ESA origin fetch, so ESA directly returns the cached data from the point of presence (POP) to the client, and this situation is unrelated to the origin server.
If the request misses the cache, investigate whether the slowdown occurs on the path from the client to ESA or at the origin server response stage.
Performance metrics
When using ESA acceleration, in addition to general data observation metrics, there are also more specific metrics for different scenarios. Monitoring these metrics not only helps you experience the effects of ESA acceleration but also lets you monitor how your own business uses ESA, helping you make better adjustments and decisions. For more information, see performance metrics.
Information gathering
A complete HTTP request follows this sequence: DNS resolution > TCP connection > SSL handshake (for HTTPS) > client sends request > server responds. Understanding this flow helps analyze issues deeply. Gather the following client-side information:
Collect client network information and ESA node IPs
Use the ping command to test the accelerated site. Verify that DNS resolves correctly to ESA and check network connectivity and latency between the client and the ESA node. If ping fails, perform link diagnostics. See Link diagnostics methods.
Gather client IP and LocalDNS
ESA schedules nodes based on the client’s LocalDNS. Ensure the client uses the correct LocalDNS for its location and ISP. Visit Alibaba Kunlun User Diagnostic Tool to obtain the client IP and DNS.
Identify slow-loading URLs
Open browser developer tools, go to the Network tab, enter the URL, and review all HTTP requests. Click the Time column to sort by duration and identify slow resources. Find slow URLs under your accelerated domain in the Domain column.
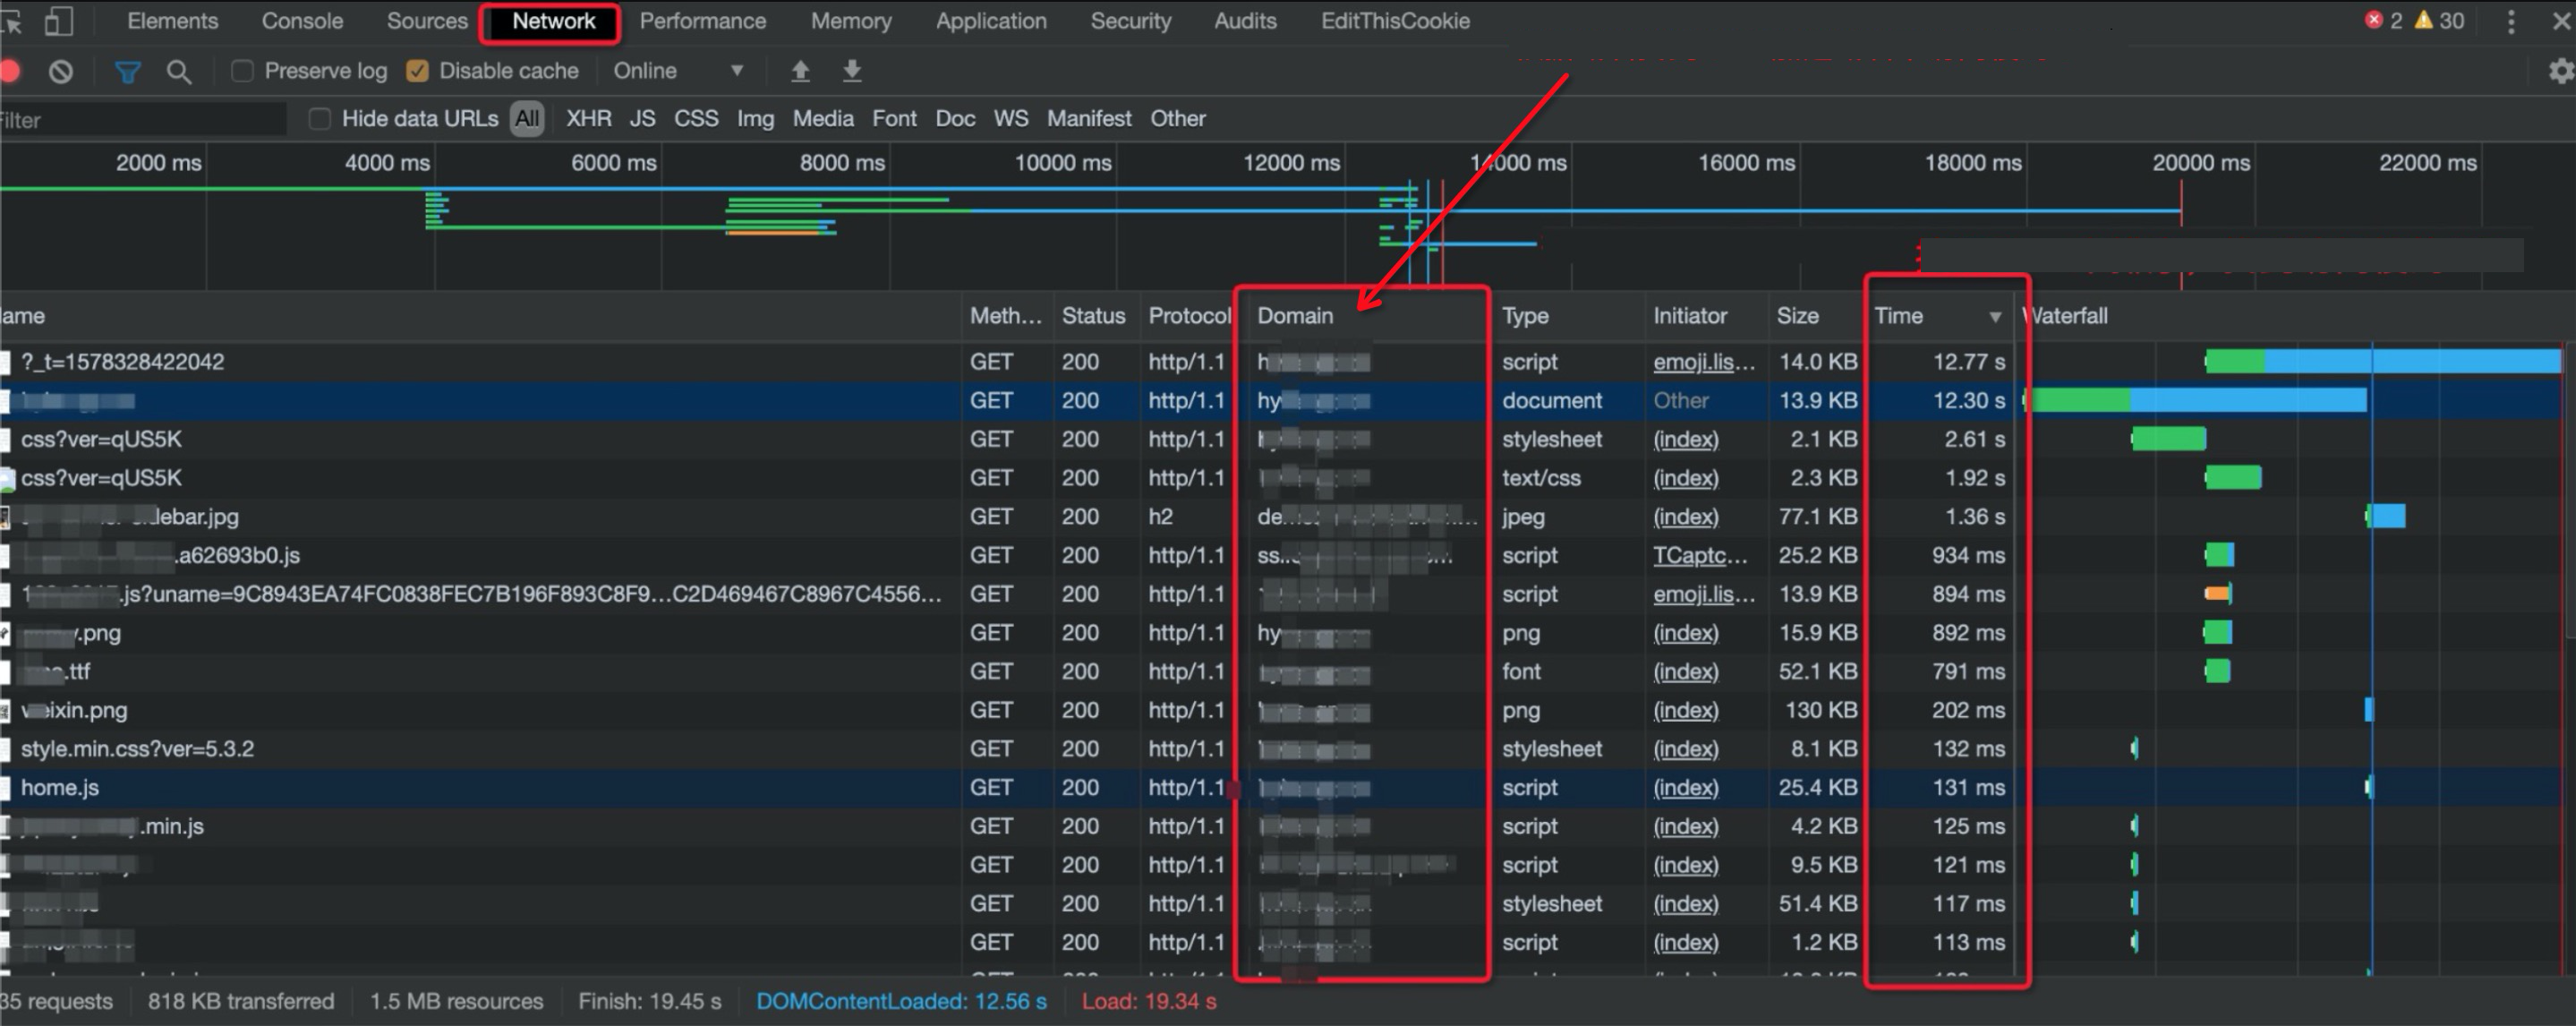
Typically, a website loads many resources, and some URLs might not be ESA-accelerated. In this case, non-ESA resources load slowly, while ESA-accelerated resources load quickly. However, it is these non-ESA-accelerated resources that load slowly and degrade the overall responsiveness of the website. Therefore, sort by Time to determine exactly which URLs load slowly.
Gather HTTP request and response headers
Click the slow request’s Name in the Network tab, then view General, Response Headers, and Request Headers under the Headers tab. These headers reveal whether the request is static and whether it hit the cache.
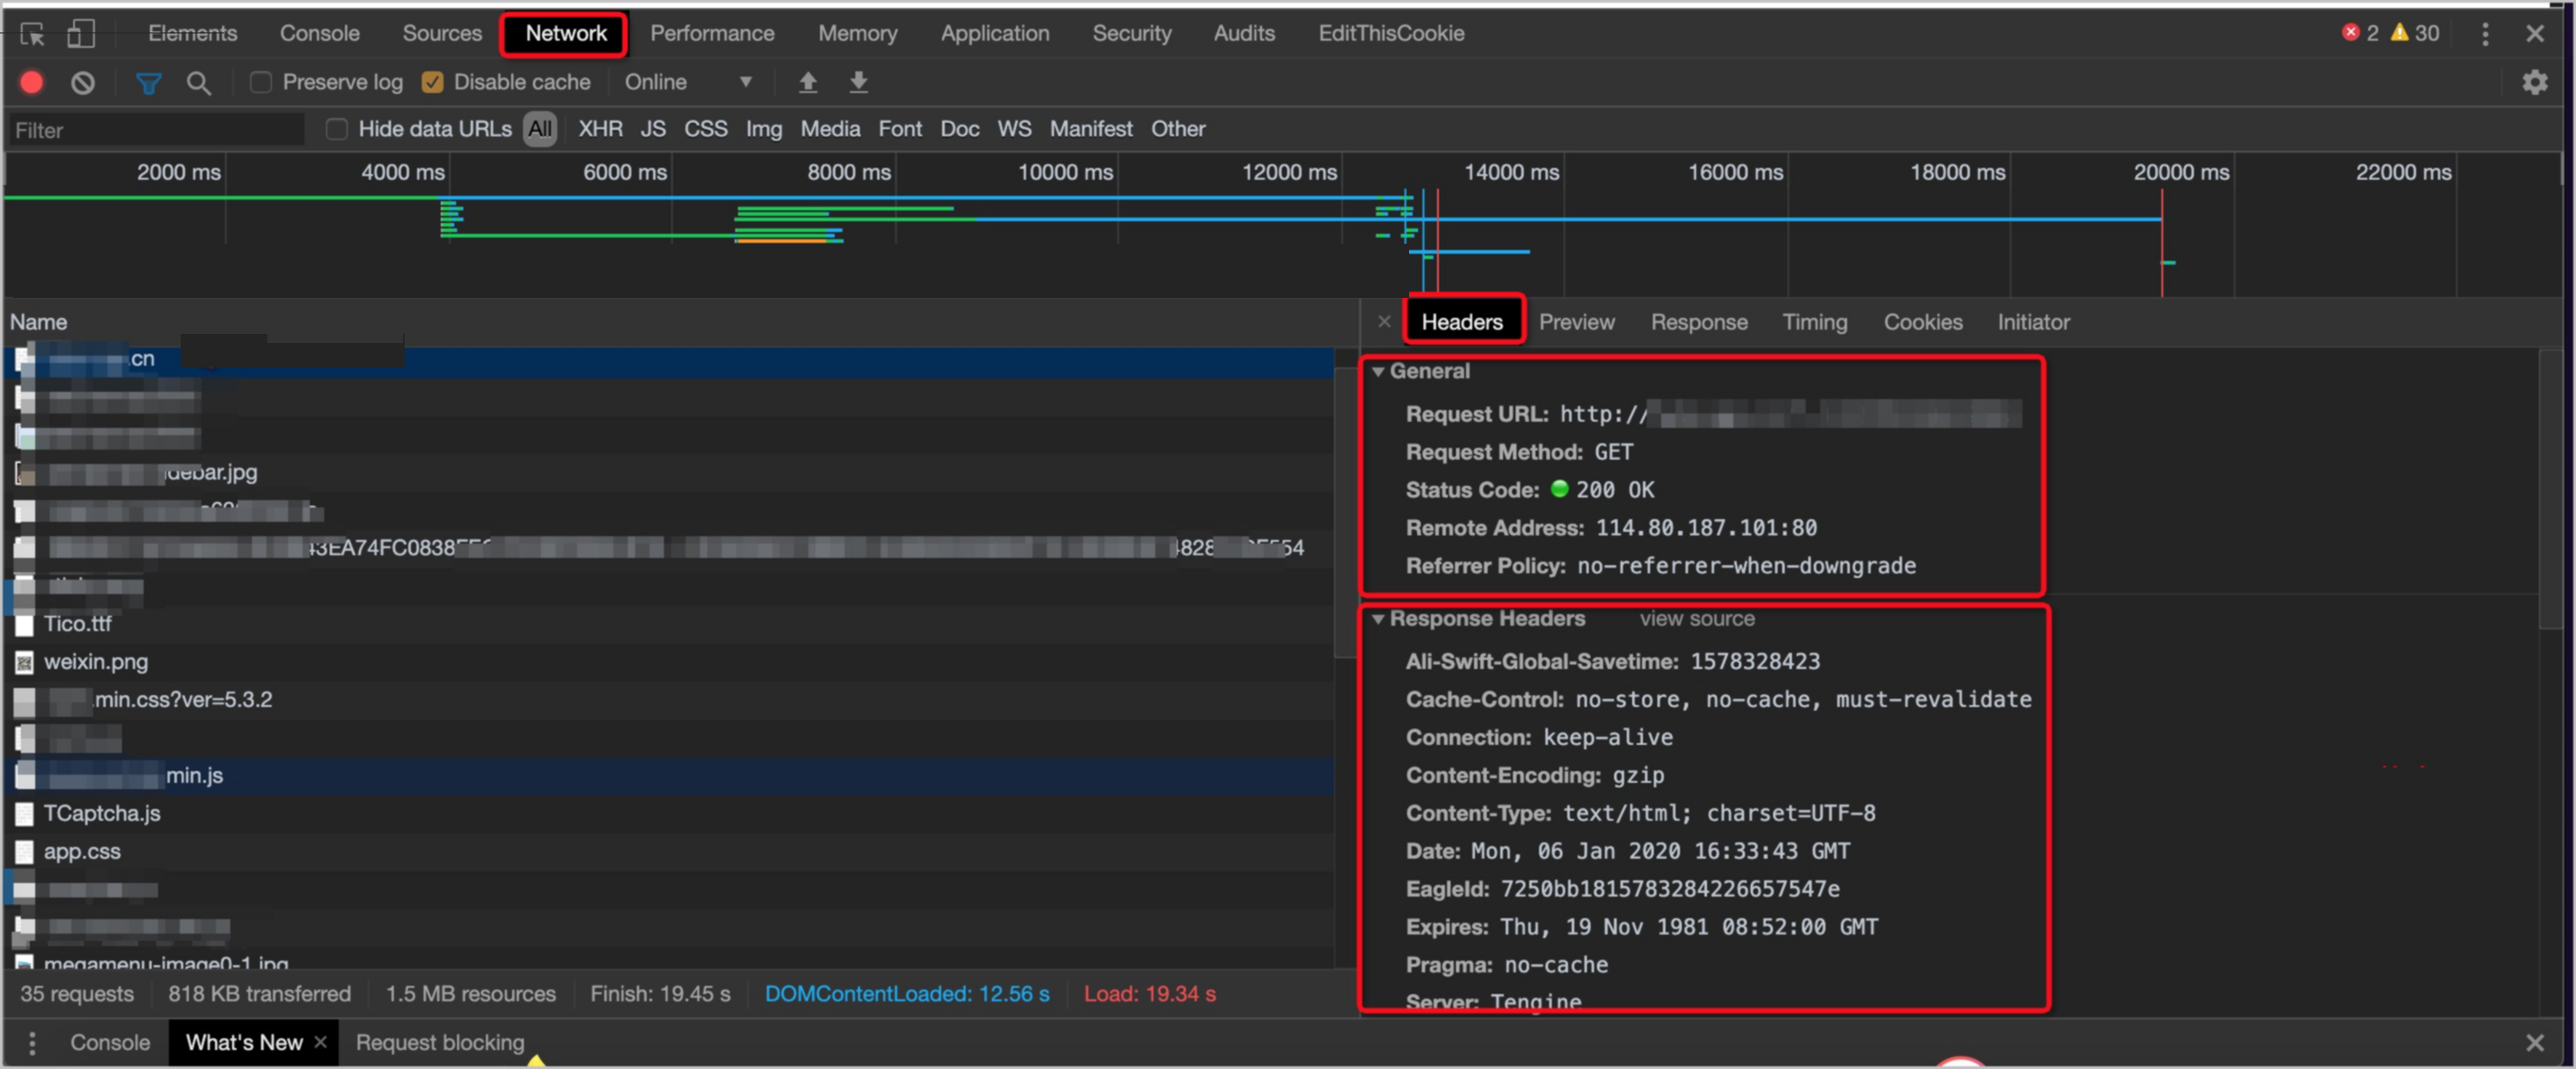
If slowness occurs on mobile 4G/5G, packet capture on the phone may be difficult. Instead, enable a mobile hotspot and connect a PC to gather data from the PC.
Gather HTTP request Timing data
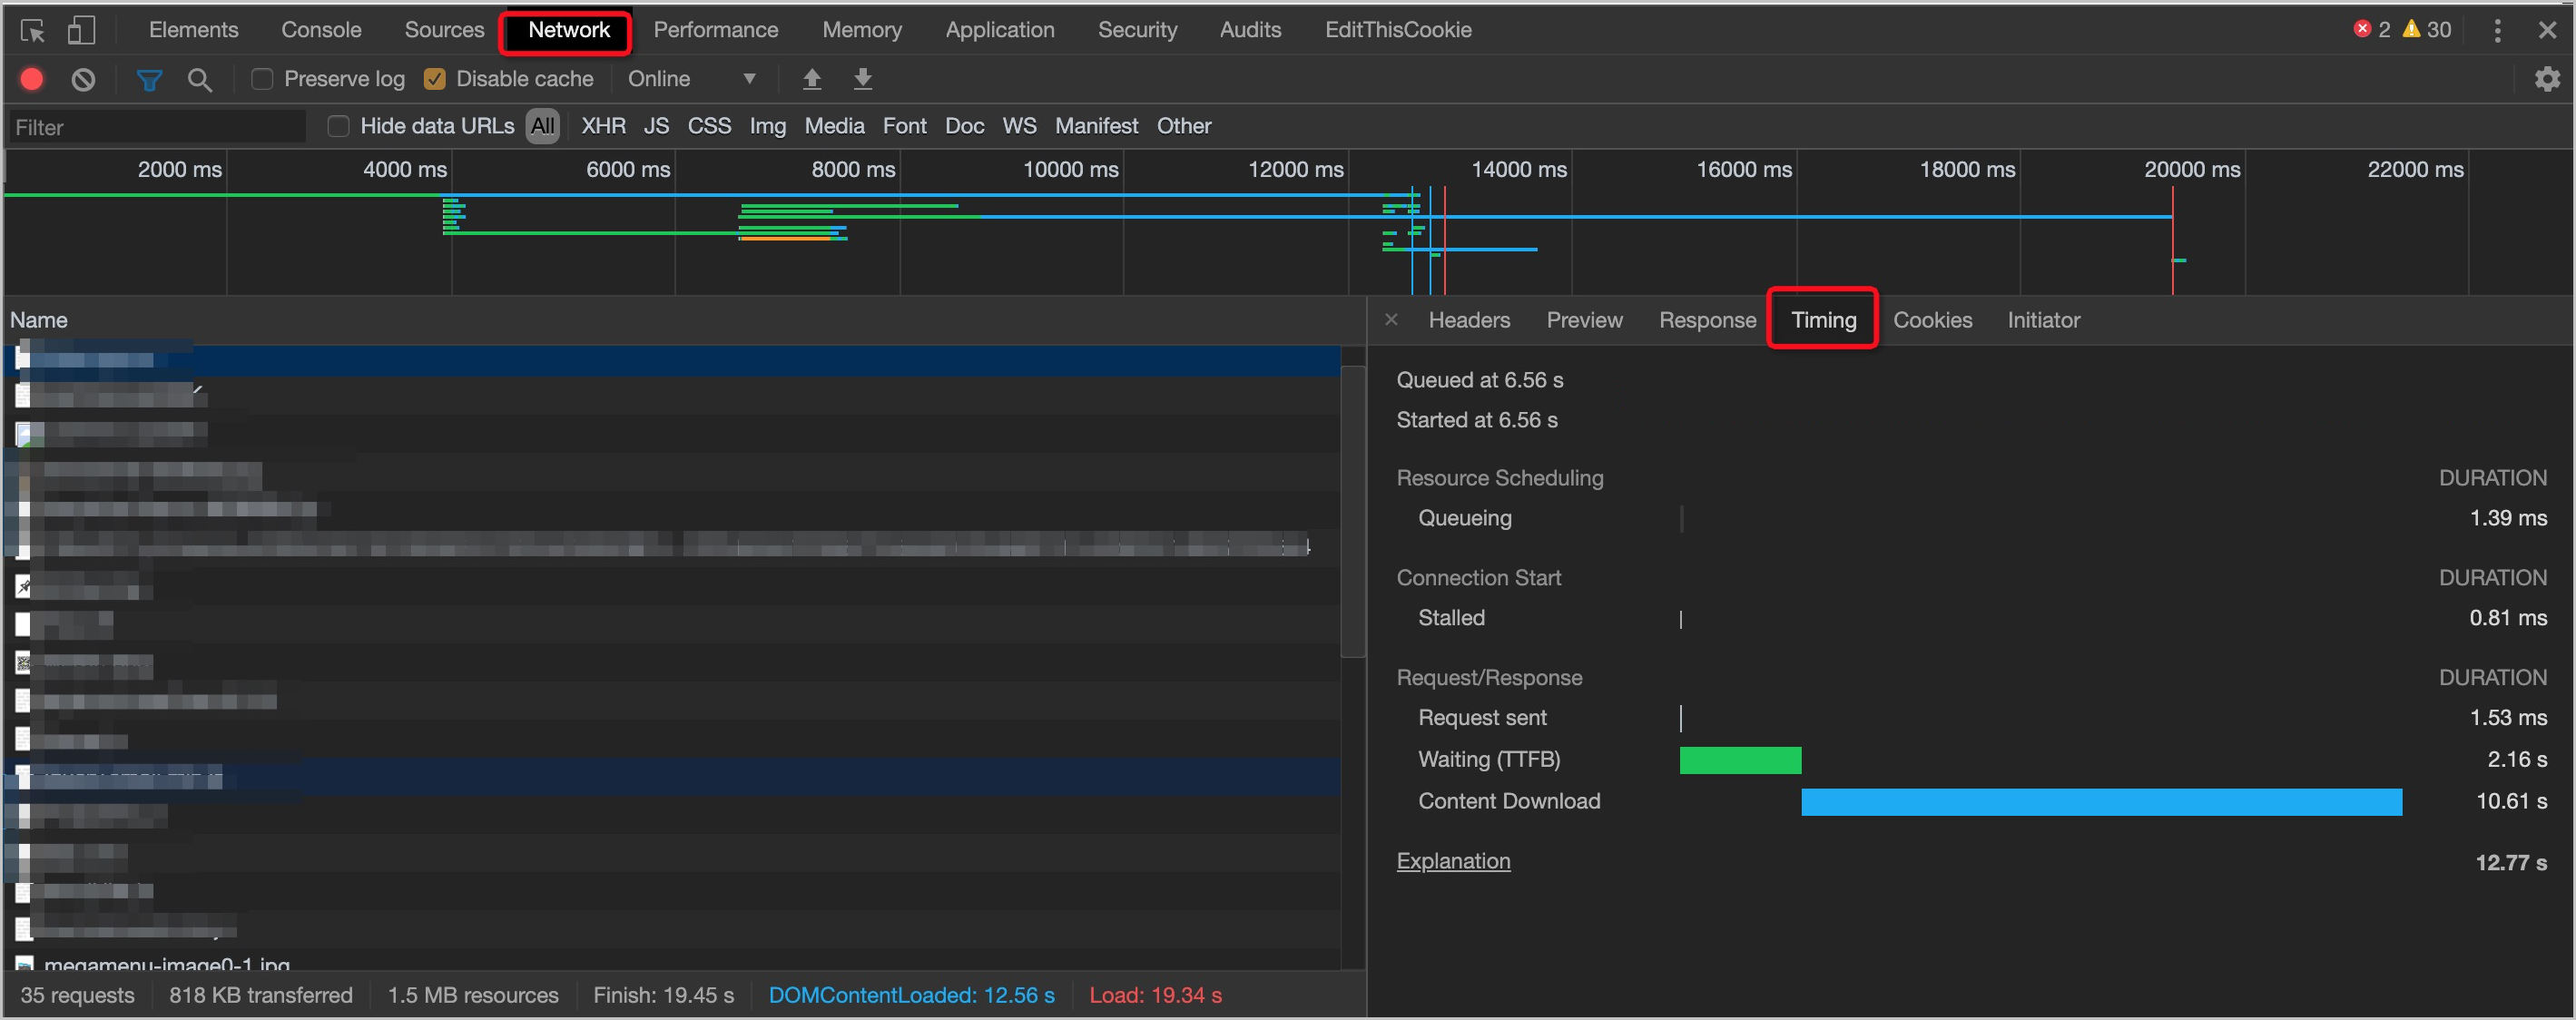
The Timing tab shows time spent in each phase of the request lifecycle.
General troubleshooting steps for client-side access issues
If you encounter client-side access issues such as pages not loading, connection resets, or browser-specific errors, try the following steps before escalating:
Browser cache and compatibility: Clear the browser cache, log out and back in, switch to private/incognito mode, or try a different browser (such as Microsoft Edge, Firefox, or your phone's built-in browser) to rule out local cache or extension interference (such as ad blockers or proxy plugins). If only a specific browser fails to load the site while other browsers work normally, check that browser's security settings (for example, enhanced security mode in Microsoft Edge) and temporarily turn it off to retest. Also confirm that the local hosts file (
C:\Windows\System32\drivers\etc\hostson Windows,/etc/hostson Linux and macOS) has no stale entry binding the accelerated domain to the origin server or another IP address, because such an entry bypasses the POP and breaks access only on that client.Local network environment: Switch networks (for example, switch from Wi-Fi to a mobile hotspot), restart your router, or temporarily disable your firewall or antivirus software.
Flush the local DNS cache: A stale local DNS cache can cause connection timeouts or resolution errors, and the browser may report
ERR_CONNECTION_TIMED_OUTornet::ERR_CONNECTION_CLOSED. To clear the DNS cache, runipconfig /flushdnsin Command Prompt on Windows, or runsudo dscacheutil -flushcachein Terminal on macOS, then retest access.Force refresh: On Windows, press Ctrl+F5; on Mac, press Cmd+Shift+R to bypass the local cache.
Packet capture analysis: If the above steps do not resolve the issue, use tools such as Wireshark or Fiddler for packet capture, or check the browser's Network panel for error codes (such as
ERR_NETWORK_CONFIG_TIMEOUT,net::ERR_CONNECTION_RESET,ERR_CONNECTION_TIMED_OUT, ornet::ERR_CONNECTION_CLOSED).Cross-border network note: If cross-border access is involved (for example, Chinese mainland users accessing overseas ESA nodes), confirm whether global acceleration is enabled.
Solutions for common scenarios
After understanding the acceleration principles and HTTP request process of ESA, you can perform preliminary analysis by combining the observed problem symptoms with the client-side information you have gathered to usually identify or locate some issues. The following section describes some typical problem cases.
Case 1: Poor network quality from client to ESA point of presence (POP)
The client uses the ping command to test the accessed site and finds high network latency, or even packet loss. In this case, you need to collect the client's IP address, the client's DNS server address, ping command screenshots, and My Traceroute (MTR) screenshots. Because ESA scheduling nodes make scheduling decisions based on the client's DNS server address, you can determine whether scheduling is abnormal by analyzing the client's IP address, DNS server address, and ESA node. The ping and MTR screenshots show network latency and help identify the specific network link node where the delay occurs. This section presents two case studies.
Incorrect acceleration region setting
Users in the Chinese mainland resolve to overseas nodes, or overseas users resolve to the Chinese mainland. Examples:
In such cases, set the acceleration region to Global.
ESA’s acceleration region is set to Chinese Mainland, so the scheduling domain for this domain name includes only ESA nodes in the Chinese mainland. When users outside China access this domain name, they are all scheduled to ESA nodes in the Chinese mainland.
If the acceleration region is set to Global (Excluding the Chinese Mainland), the scheduling domain for this domain name includes only ESA nodes outside the Chinese mainland, and users from the Chinese mainland will be routed to overseas ESA nodes.
Incorrect client DNS configuration
Clients must use DNS servers matching their local ISP and region:
A user in Singapore using DNS from the US routes to an US ESA node, increasing latency due to long-distance routing.
VPN or proxy network environment
When using a VPN or proxy network, the client's LocalDNS may report an overseas or non-physical-location address. This causes ESA to schedule requests to nodes far from the user's actual location—for example, routing Chinese mainland users to overseas nodes—resulting in a longer network path and slower access. To troubleshoot:
Check whether the acceleration region is set to Global so that all users are routed to the nearest available node.
Visit the Alibaba Kunlun User Diagnostic Tool to verify your LocalDNS and confirm whether the DNS geographic attribution is correct while the VPN is active.
If VPN use is not essential, temporarily disable the VPN and retest access speed to determine whether it is the root cause.
If the acceleration region and DNS settings are correct and ESA scheduling is properly assigned, but network quality is still poor, you must collect traceroute and mtr information for further diagnosis.
Case 2: Low cache hit ratio or frequent origin fetches
ESA caches static resources at the ESA node closest to the client in static resource acceleration scenarios. When you access these resources, you obtain them directly from the cache, avoiding origin fetch over a long link. If the ESA cache hit ratio is low, it causes high pressure on the origin server and poor static resource access performance. Therefore, the ESA cache hit ratio directly affects user experience, and maintaining a high cache hit ratio has become a core objective for ESA. You can select corresponding optimization strategies based on the specific reasons causing low ESA cache hit ratio to optimize the ESA cache hit ratio. For more information, see Improving ESA Cache Hit Ratio. You can determine whether a cache hit occurred by checking the X-Cache field in the Response Header returned by ESA.
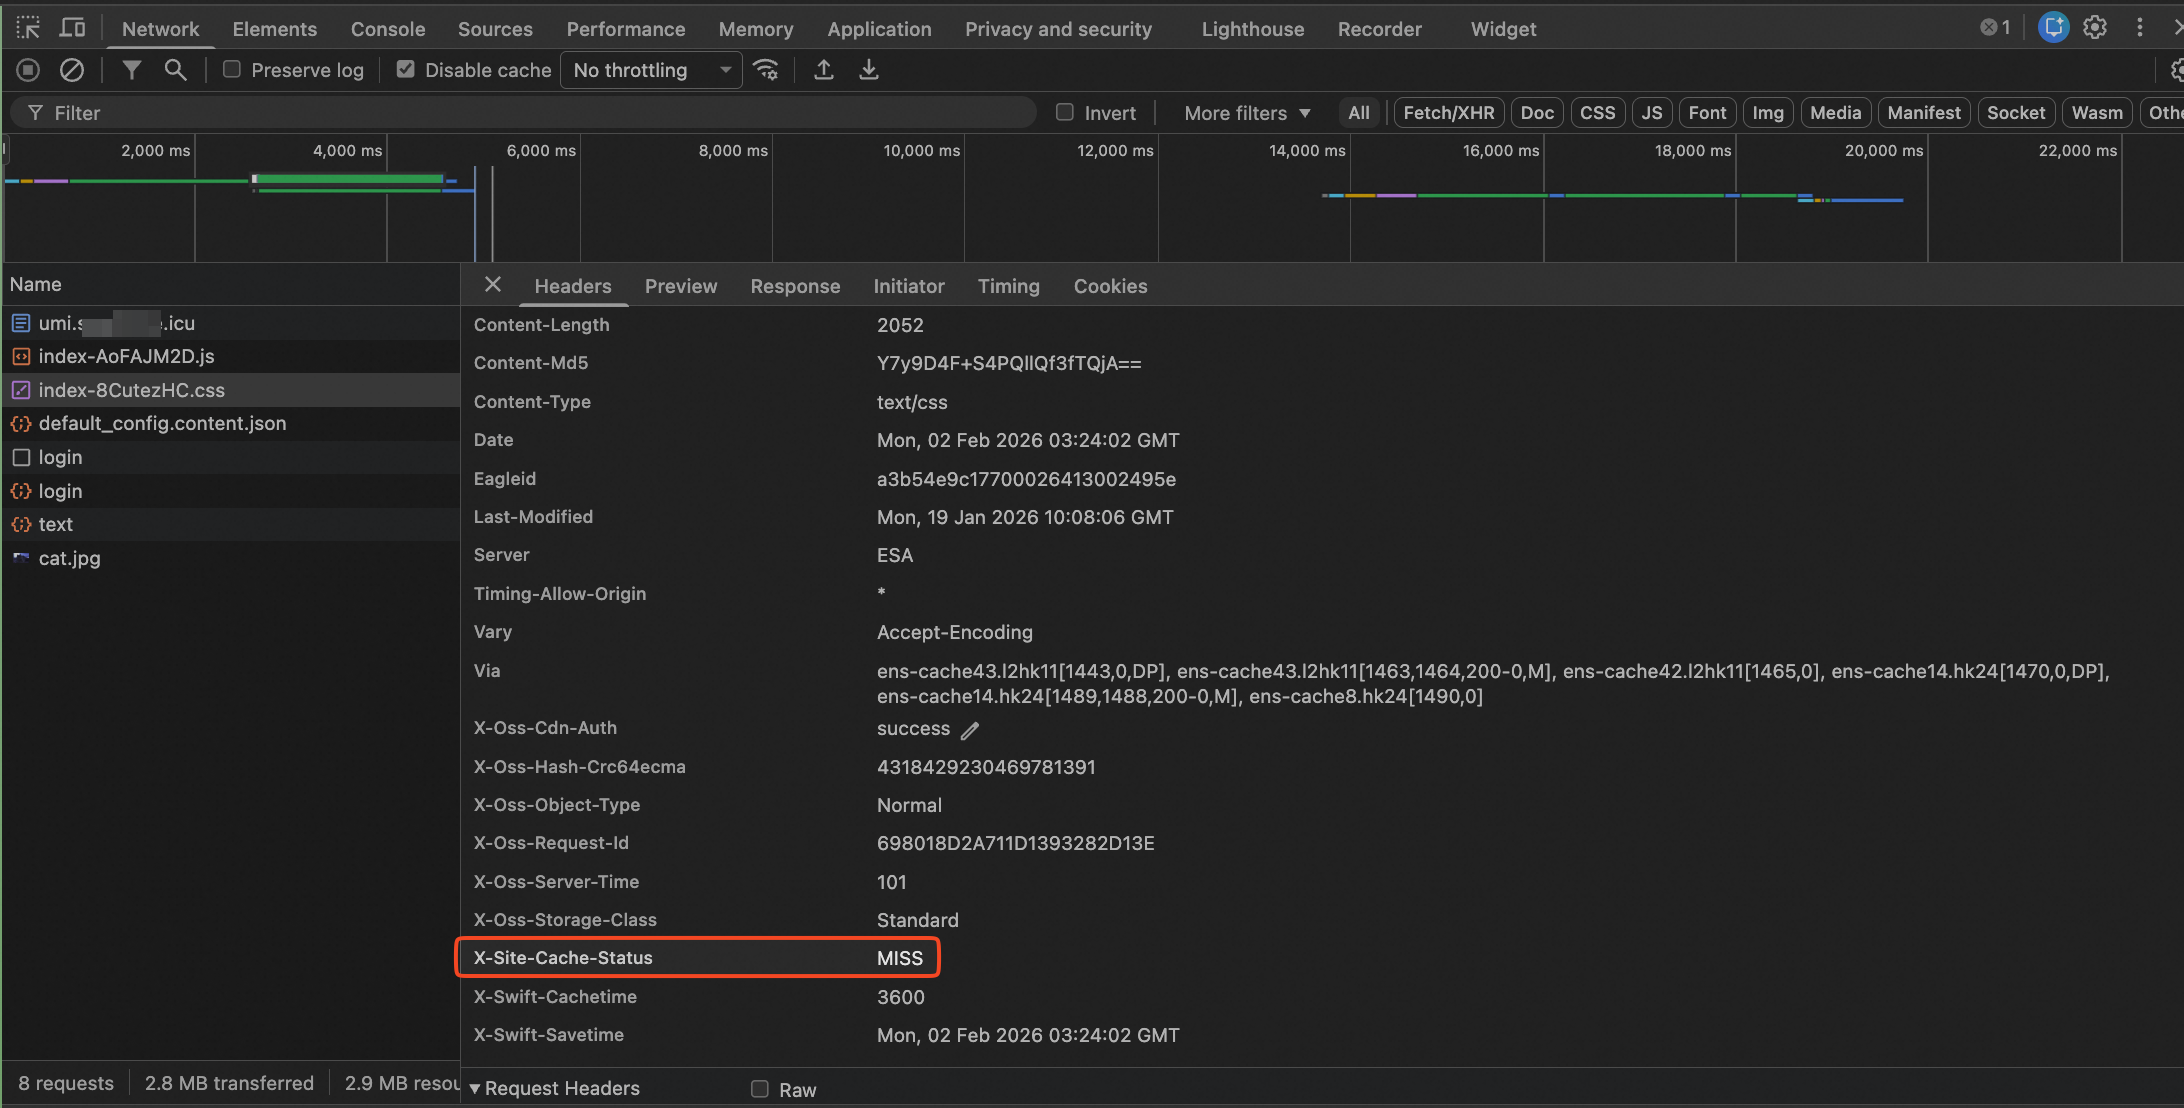
X-Site-Cache-Status : MISSindicates that the request did not hit the cache and requires an origin fetch.X-Site-Cache-Status: HITindicates that the request hit the ESA cache and will directly read cached data.X-Swift-CacheTimefield value indicates the allowed cache duration on ESA nodes, that is, how long the file can be cached on ESA nodes. If the value is0, the request cannot be cached.
Symptoms and optimizations for low cache hit ratio or frequent origin fetches:
The first time you access content, it will be slower than accessing the origin server directly because the ESA node has no cache and must first fetch data from the origin — this is expected behavior for a first request; subsequent requests hit the cache and become noticeably faster. In this case, we recommend that you use the prefetch URL feature. For more information, see Purge and Prefetch Resources, which describes how to proactively prefetch content from the origin to the ESA node so your first visit can directly hit the cache, improving loading speed.
The resource receives little traffic, and the file lacks sufficient popularity, so ESA receives few requests and cannot effectively hit the cache. Because ESA nodes are shared resources among all users of ESA, the cache rules configured in ESA define the maximum cache duration for the resource on ESA. If your connected site has low traffic, the resource may be purged early from the cache on ESA nodes—meaning the cache uses an eviction policy based on the popularity attribute. Popularity refers to how frequently a file is accessed on a node; if a file does not have enough popularity, it will be removed early.
The cache configuration is not optimal, and the cache duration is too short, causing ESA nodes to frequently perform origin fetches, as shown in the following scenario:
When ESA has no cache rules configured, static files that do not return the ETag and Last-Modified response headers cannot be cached on ESA nodes. To optimize this, configure these two response headers on the origin, or consider configuring cache rules on the ESA side. For more information, see Configure caching.
When no cache rules are configured for ESA, ESA uses the default cache policy. For more information, see Alibaba Cloud default cache rules and priorities. The cache duration is very short, with a maximum of 3600 seconds, which can lead to frequent cache expiration and origin fetches. We recommend that you configure an appropriate cache duration on the ESA side as needed.
When the origin server configures certain
Cache-Controlresponse headers that prevent caching, ESA will not cache the resource even if you have configured cache rules, because these response headers take precedence over ESA cache rules. If the origin server includes any of the following directives:s-maxage=0,max-age=0,no-cache,no-store,private, orPragma: no-cache, ESA will be unable to cache the resource. You need to modify these response headers on the origin server side to cacheable values such aspublic. For more information, see Configure Nginx HTTP cache policies and Configure Apache cache policies.
URLs with variable parameters
URLs for accessing resources contain parameters that are constantly changing. When you use different URLs to access ESA, ESA treats each as a new request (even though these different URLs actually access the same file, which is already cached at the POP), and will still fetch the requested content from the origin. In this case, we recommend enabling the parameter filtering feature. For more information, see Ignore Parameters.
Large file Range origin fetch
For large files, enable Range origin fetch to optimize partial content retrieval. See Configure range origin fetch.
First-request latency and the origin upgrade decision: For static resources, once a resource is cached, it is served directly by the POP, so upgrading the origin server is usually unnecessary; if first-request latency matters to you, use the prefetch URL feature described above rather than scaling the origin. For dynamic requests, ESA does not cache the response — it only accelerates the network path, and every request still goes to the origin. If dynamic requests stay slow with a high time to first byte (TTFB), the bottleneck is normally origin server bandwidth or processing capacity rather than the acceleration path; for how to observe TTFB, see Case 4: Slow origin server response in this topic. Base your decision on actual traffic: when dynamic requests make up a large share of traffic and the origin is already close to its limits, upgrade the origin server's specifications or bandwidth first, because an acceleration product alone cannot remove an origin-side performance bottleneck.
Case 3: Slow dynamic requests
ESA accelerates dynamic requests using Alibaba Cloud’s smart routing and transport optimizations to reach your origin server quickly. Causes include the following:
Origin server performance bottlenecks—such as limited bandwidth, CPU saturation, or slow application logic. Optimize or scale out the origin if needed.
Web services deployed outside the Chinese mainland serving global users via an acceleration region set to Global (Excluding the Chinese Mainland) result in poor experience for Chinese mainland users. Enable Mainland China network access optimization to address cross-border latency.
Global services with mixed static/dynamic content show limited acceleration. Enable Smart Routing. ESA performs real-time network probing across Alibaba Cloud’s global edge nodes, selects the optimal route, and uses high-performance protocol stacks to reduce global latency and failure rates, improving user experience and business continuity.
Case 4: Slow origin server response
If you perform risky operations like modifying instances or data, ensure adequate disaster recovery and fault tolerance to protect data security.
Before modifying configurations or data for instances (including but not limited to ECS or RDS), create snapshots or enable RDS log backup.
If you’ve shared login credentials or other security information on Alibaba Cloud, change them immediately.
Slow requests that bypass caching or are dynamic require origin fetches. If the origin responds slowly, the overall response is slow. Test by binding the origin domain directly in your local hosts file or measuring origin response time from the origin server. Causes include the following:
Origin server performance bottlenecks—such as saturated bandwidth or CPU, or slow application logic. Optimize or scale out the origin.
The origin server has poor network connectivity, or involves cross-border links—for example, when users request ESA nodes in the Chinese mainland while the origin server is located outside the Chinese mainland. Because the link that ESA uses to fetch content from the origin server also traverses the public Internet, cross-border links can indeed be affected. This is because such links involve different ISPs, overseas carriers, and must pass through international Internet egress points. These factors are beyond the control of both the ESA side and the origin server side, leaving little room for ESA to optimize performance on its own. We recommend deploying dual origin servers (one overseas and one within the Chinese mainland) and adjusting your architecture to achieve optimization.
Use these methods to verify if the origin is the root cause:
Use browser developer tools Network panel to check origin response time. Open developer tools, go to Network, select the slow request, and click Timing. Focus on Waiting for server response (TTFB—Time To First Byte), which measures time from request send to first byte received. High TTFB (e.g., several seconds) indicates slow origin processing.
Compare the response speed by directly connecting to the origin server. In your local hosts file, map the domain name to the origin IP address (bypassing ESA), access the origin server directly, and record the response time. Compare this response time with the response time when accessing through ESA. If the response time when directly connecting to the origin server is also long, this indicates that the origin server itself has a performance bottleneck and requires optimization on the origin server side; if the response time is normal when directly connecting to the origin server but slow when accessing through ESA, investigate whether the origin fetch path has network issues.
Case 5: Slow homepage loading
When a client accesses the website http://www.example.com/, the browser requests the homepage. After the request succeeds, the server returns HTML code to the browser, which then requests additional resources referenced in the HTML code, such as images, JS, and CSS. If the homepage is a dynamic resource or a non-cacheable resource, ESA triggers an origin fetch for every homepage request. If the origin server responds slowly, this ultimately causes slow homepage loading, and the request remains in the Pending state in the Network panel for an extended period. For details on whether the request hits the cache, see Case 2: Low cache hit ratio or frequent origin fetches.
In this scenario, the homepage request stays Pending until data arrives, then static resources load quickly.
The HTML returned for the root path (/) usually references many sub-resources, so after the homepage HTML arrives, the browser may issue tens to hundreds of concurrent sub-requests for images, JS, CSS, and other resources. Under high-concurrency probing or peak traffic, these requests hit the origin server at once; if the origin cannot process them fast enough, it may return 5xx errors — 500 when the origin itself fails to process a request, or a timeout (see the 524 discussion in the FAQ of this topic) when the origin is too slow to respond. To avoid this, do not run high-pressure probes directly against the root path. To verify POP connectivity and acceleration, probe a specific static resource (such as an image or a JS file) instead — such a resource can be served from the POP cache, so the result better reflects the acceleration path itself without amplifying load on the origin.
The root path (/) follows the origin’s cache policy by default. If the origin does not set a cache header, or sets no-cache, the homepage is not cached and every request triggers an origin fetch. To let the homepage use static caching instead, configure a cache rule for the root path in the ESA console:
Log on to the ESA console, go to site management, and select the target site.
In the left-side navigation pane, choose Rules > Cache Rules, then click Create Rule.
Enter a rule name, such as
root-path-cache-rule.Select Custom Rule, set the match field to URI Path, the operator to Equals Any of the Following Values, and the value to
/.In the actions section, find Edge Cache TTL, select Ignore origin cache policy and use custom cache TTL, and set a cache duration (we recommend that you set it based on how often the homepage file is updated, for example, 3600 seconds).
Click OK to save the rule.
When creating the rule, you can set its position to First, or, if the rule already exists, move it to position 1 in the cache rule list. Rules run in Sequence order, and a smaller Sequence number runs first, so placing the root-path rule first prevents a broader, later-added rule from overriding it. If you also want to cache other static resources for longer, create a broader rule and place it after the root-path rule. The custom cache TTL unit supports seconds, minutes, hours, days, months, and years, so choose it based on how often the resource is updated — for example, select days with a value of 1 for the homepage so that updates go live quickly, and a longer duration such as months for other static resources.
If the homepage changes frequently and you do not want to cache it for a long period, you can skip setting a long TTL and instead manually purge that URL from the POP cache after each release.
After this configuration, requests to the root path / are served from the static cache and no longer trigger an origin fetch every time.
Case 6: Large resource files
If your site loads large resources, enable performance optimization features. See Configure resource compression to reduce file size and improve acceleration efficiency and page readability. Supported formats for intelligent compression include the following: text/xml, text/plain, text/css, application/javascript, application/x-javascript, application/rss+xml, text/javascript, image/tiff, image/svg+xml, application/json, and application/xml.
Case 7: Slow access for users in a specific region or ISP
In some scenarios, clients have common problems. For example, during a specific period of time, many China Mobile users in a specific city reported slow or abnormal access, while China Unicom and China Telecom users experienced normal access. This type of issue is very likely related to the local ISP network or the ESA node that serves requests from that region. The typical troubleshooting method is to collect ping information on the user side to first confirm the network latency between the client and the ESA node.
Additionally, based on the IP address of the ESA POP that the user request reaches, you can attach to this ESA POP for testing. The testing method is similar to attaching to the origin server for testing—just replace the IP address with the IP address of the ESA POP. Before you perform the node attachment test, you can first verify whether the node itself has a slow response. If the response is slow, check whether the request hits the cache and whether the loaded resources are too large, and analyze the issue further based on the preceding cases. If you cannot identify the issue, submit a ticket to contact Alibaba Cloud.
Case 8: Slow upload speed
ESA only supports download acceleration (i.e., from the server to the client) and does not support upload acceleration. After you use ESA, it is normal for your upload speed not to improve or even decrease, as ESA does not offer dedicated upload acceleration plans.
Upload speed depends on:
Client upstream bandwidth: Upload speed is capped by client upstream bandwidth and is unrelated to ESA.
Acceleration region coverage: If the acceleration region excludes the client’s location (e.g., overseas region selected but client uploads from Chinese mainland), upload traffic takes a longer cross-region path, potentially reducing speed.
If upload speed is much lower than expected, troubleshoot as follows:
Verify sufficient client upstream bandwidth using a speed test tool.
Confirm the acceleration region covers the client’s location. Chinese mainland clients need Chinese mainland included; overseas clients need their region included. Incorrect settings cause upload traffic to detour, increasing latency.
Rule out local network jitter or congestion by testing at different times or using wired connections.
If you encounter upload errors or failures (such as connection timeouts, connection establishment failures, or intermittent upload errors), note the following:
ESA is designed for download-direction (server-to-client) acceleration. Upload traffic traversing multiple ESA node links may cause timeouts or connection establishment failures. For large file uploads or uploads requiring high stability, bypass ESA and upload directly to the origin server.
If you must upload through ESA and encounter intermittent failures or errors, check origin server stability and logs to determine whether the issue is caused by a slow origin server response.
FAQ
Q: Why does my diagnostic tool or homepage still time out or show errors even after configuring ESA caching?
A:
ESA primarily accelerates static resources. For dynamic requests—such as homepages and login interfaces—where the origin server is configured to disallow caching, ESA fetches directly from the origin without serving cached content.
If the origin server encounters performance bottlenecks (insufficient bandwidth, CPU, or memory) under high-concurrency diagnostic testing or real-world traffic, it can cause response timeouts or 524 errors.
Different speed test tools use different probe nodes, network environments, and evaluation criteria. Results may vary when caching is not enabled. Use actual business experience as the primary reference rather than relying solely on tool results.
Check your origin server monitoring data and optimize server performance as needed.
Q: Is a response time of approximately 100ms for small files (such as a 500KB image) through ESA normal?
A: Yes, this is within the expected range. ESA acceleration effectiveness is influenced by multiple factors, including file size, ESA node distance, and cache hit status. For small files with cache hits and normal network conditions, a response time of around 100ms meets expectations.
Q: Why is my ECS origin server's bandwidth usage still high after pointing my domain's DNS to ESA?
A:
Confirm whether the IP ranges consuming bandwidth belong to your current account's business traffic. If not, block specific IPs using ECS security groups.
If abnormal connections persist after blocking, create a snapshot backup first, then restart the web service during off-peak hours to disconnect any established abnormal connections.
Verify your ESA caching configuration and origin fetch status. A low cache hit ratio or a high volume of dynamic requests fetching from the origin results in sustained origin server bandwidth consumption.
Check whether cross-account ESA instance configuration issues exist.
Q: After enabling acceleration, requests return 502 errors or an unexpected server header (such as openresty). How do I troubleshoot this?
A:
Turn off local proxies: disable any local VPN, browser proxy extension, or system proxy. A proxy changes the path a request actually takes, and the 502 error may be returned by the proxy rather than by the ESA node. Retest after turning off the proxy.
Confirm where the response comes from: if the server identifier in the response header is not that of an ESA node (for example, if openresty appears), the response may come from a local cache, a proxy server, or middleware in front of the origin server rather than from ESA. Retest in private/incognito mode or after clearing the browser cache, and recheck the response headers in the Network panel of the browser developer tools.
Test against the origin server directly: if the issue persists, bind the domain to the origin server IP in the local hosts file to bypass ESA. If the direct request also returns a 502 error, the error comes from the origin server or a component in front of it, and you need to investigate on the origin server side.
Q: An accelerated domain fails or times out after being resolved through HTTPDNS. How do I troubleshoot this?
A:
Capture packets to check the resolution result: capture traffic on the client to confirm whether the IP address returned by HTTPDNS is an ESA node IP address, and at which stage the request fails (DNS resolution, TCP connection, SSL handshake, or waiting for the server response). For how to collect this information, see Information gathering in this topic.
Verify DNS and integration settings: confirm the domain’s DNS configuration is correct and that HTTPDNS is integrated as described in its own documentation. If access works when you bypass HTTPDNS and use normal DNS resolution instead, the problem lies in the HTTPDNS resolution result or the way it is integrated, rather than in ESA itself.
Check for network-path restrictions: some regions and some ISP networks may apply network-level access restrictions, which appear as failures for the same domain on one ISP network while other networks work normally. Compare results across regions and ISP networks to confirm this; if you confirm an ISP-side restriction, contact that ISP.
If you still cannot identify the cause, submit a ticket to Alibaba Cloud with the packet capture, the client IP address, the LocalDNS, and the time the failure occurred.
Q: JSON data returned by an API is truncated or incomplete after enabling acceleration. How do I handle this?
A:
Verify against the origin server directly: bypass ESA by binding the domain to the origin server IP in the local hosts file, send exactly the same request to the origin server, and compare the response. If the direct response is also incomplete, the problem is on the origin server side.
Check the origin server configuration: review the response body size limits and buffer settings of the origin web server (such as Nginx, Apache, or IIS), and check whether the application code paginates responses, truncates by length, or aborts on timeout.
Check compression: if compression is enabled on both the origin server and the acceleration side, some clients may fail to decode the response correctly. Disable compression on one side and retest to see whether the issue is compression-related.
If the origin server returns complete data but the accelerated request does not, submit a ticket with the full request URL, the request and response headers, the client IP address, and a timestamp when the issue occurred.
Performance metrics
Through performance metrics, observe website acceleration before and after using ESA, evaluate the effectiveness of ESA acceleration, and help you make better-informed business adjustments and decisions. The metrics mainly include the following:
General metrics
Use these general performance metrics (among others) to observe changes after enabling ESA.
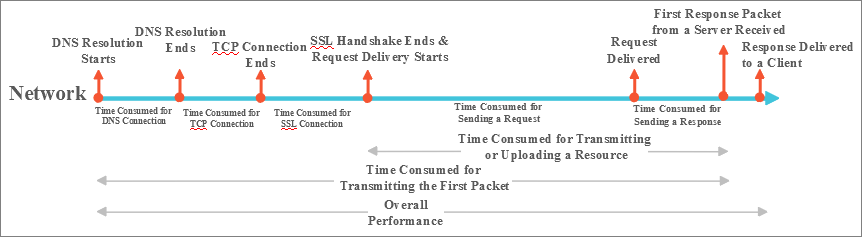
Data upload path
Data download path
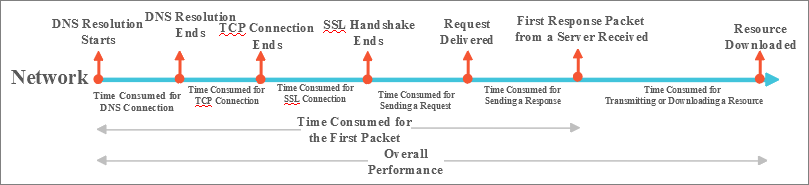
Typically, after using ESA, network latency, packet loss rate, and back-to-origin rate all decrease, while cache hit ratio increases. However, because business scenarios and business types differ, even if you select an ESA service with the same configuration, the actual acceleration effect will vary. Therefore, this topic provides only qualitative metrics for observation.
The Back-to-origin rate and cache hit ratio mentioned in the table refer to the metrics after using ESA, and if you do not use ESA, back-to-origin requests account for 100% and the cache hit ratio is 0%.
Metric | Description |
DNS time | Time from browser request initiation to obtaining the final host IP address. |
TCP time | Time to establish a TCP connection between client and target server. |
SSL time | Time to establish a secure sockets layer (SSL) connection between client and web server. |
Send time | Time from completing SSL handshake to finishing request transmission. |
Connection time | Connection time is abbreviated as connection establishment time. If ESA nodes use the HTTP protocol to accelerate customer services, connection time includes "DNS time + TCP time"; if ESA nodes use the HTTPS protocol to accelerate customer services, connection time includes "DNS time + TCP time + SSL time". The length of the connection time reflects the richness of node resource coverage and the scheduling capability of the ESA service. |
Response time | Time for the web server to process the request and generate a response after receiving the HTTP request. |
Download time | Total time from receiving the first data packet to completing the download. |
Time to first byte (TTFB) | Time to first packet refers to the time between when the client starts sending a request and when it receives the first HTTP protocol data packet from the server. This metric reflects the overall performance of ESA service nodes. In upload and download paths, TTFB includes DNS resolution time, TCP time, SSL time, send time, and response time. Note Newly purchased domain names usually have longer resolution times, which are unrelated to the cache time of ESA. |
Overall performance | Total time to complete an entire file upload or download. |
Packet loss rate | Ratio of lost packets to total sent packets during network transmission. |
Origin fetch rate | Two types: origin fetch request ratio and origin fetch traffic ratio:
|
Cache hit ratio | ESA cache hit ratio includes byte hit ratio and request hit ratio. ESA cache hit ratio generally refers to byte hit ratio. The higher the cache hit ratio, the better the performance.
|
Key metrics for accelerating small files and images
Small files and images include webpage resources like HTML, JS, JPG, and CSS. Latency determines performance—lower is better. Affected by:
Time to first byte (most critical)
Connection time
Transfer time (download time)
Key metrics for accelerating large file downloads
Large file downloads involve single files over 20 MB. Key metrics:
Download speed
Total download time
Key metrics for video-on-demand acceleration
Video-on-demand covers audio/video files like FLV, MP4, WMV, and MKV. Key metrics:
Time to first frame: Time from opening video to seeing the first frame. Affected by DNS resolution, connection time, and TTFB. Shorter is better.
Rebuffering rate: Percentage of users experiencing playback stuttering per 100 users. Lower is better.