Application metrics such as JVM garbage collection frequency, response latency, and error rates can signal performance degradation before it affects users. EDAS integrates with Application Real-Time Monitoring Service (ARMS) to evaluate these metrics against thresholds you define. When a metric breaches a threshold, ARMS sends notifications to your specified contacts or DingTalk groups so your team can respond before issues escalate.
How it works
ARMS periodically evaluates each alert rule by querying the application metrics you specify.
If a metric meets the alert condition -- for example, JVM full GC count increases by 100% compared to the previous hour -- an alert fires.
ARMS routes the notification through the notification policy you configured, delivering it to the designated contacts or groups.
Prerequisites
Before you begin, make sure that:
Application Monitoring is connected to EDAS. For details, see Application Monitoring overview
Create an alert rule
Log on to the EDAS console.
In the left-side navigation pane, choose Application Management > Applications.
In the top navigation bar of the Applications page, select a region, select a microservices namespace from the Microservices Namespace drop-down list, and select ECS Clusters from the Cluster Type drop-down list.
Click the name of the target application.
In the left-side navigation pane, choose Alert Management > Alert Rule.
On the Application Monitoring Alert Rules page, click Create Application Monitoring Alert Rule.
Configure the parameters described in the following table, then click Save.
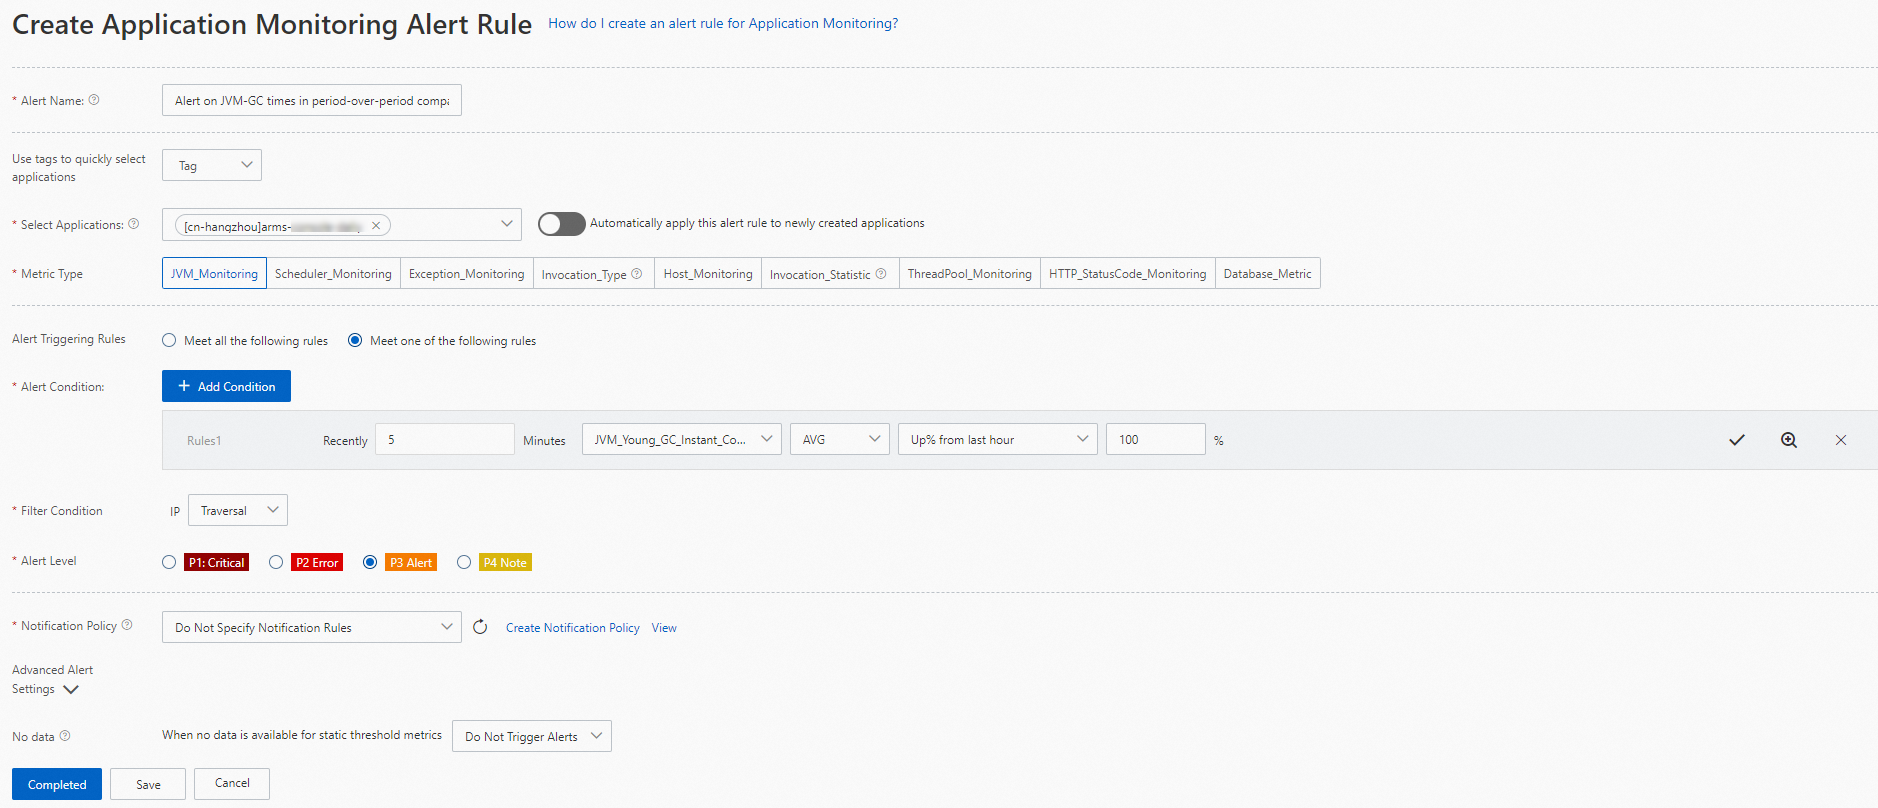
Alert rule parameters
| Parameter | Description |
|---|---|
| Alert Name | A descriptive name for the alert rule. Example: Alert on JVM-GC occurrences in period-over-period comparison. |
| Select Applications | One or more applications to monitor with this rule. |
| Metric Type | The metric category to evaluate. The available options for Alert Condition and Filter Condition change based on this selection. For the full list of supported metrics, see Alert rule metrics. |
| Alert Triggering Rules | How multiple conditions are evaluated: Meet all the following rules (all conditions must be true) or Meet One of the Following Rules (any single condition triggers the alert). |
| Alert Condition | The threshold expression that triggers an alert. Click +Add Condition to define an expression -- for example, "average JVM full GC count in the last 5 minutes increases by 100% compared to the previous hour." Click the confirm icon to save the expression. To add more conditions, click +Add Condition again. |
| Filter Condition | Controls how metric dimensions are scoped. See Filter condition options for details. |
| Alert Level | Severity level: P4 (lowest), P3, P2, or P1 (highest). |
| Notification Policy | Determines how alert notifications are delivered. Without a notification rule, ARMS sends notifications only when the dispatch rule in the notification policy matches. With a notification rule, ARMS sends notifications through the method defined in the policy. Select an existing policy or create one. For details, see Create and manage a notification policy. To review selected policies, click View all notification policies. |
| No data (under Advanced Alert Settings) | Defines behavior when metric data is missing or anomalous. See No-data handling options for details. |
Filter condition options
Filter conditions control how metric dimensions are scoped when evaluating alert rules.
| Option | Behavior |
|---|---|
| Traversal | Evaluates each value of the specified metric dimension individually. Each dimension value that breaches the threshold generates a separate alert. |
| No | Aggregates (sums) all values of the specified metric dimension into a single value for evaluation. |
| = | Includes only the specified dimension values in the alert evaluation. |
| != | Excludes dimension values that match the specified value. |
| Contain | Includes only dimension values that contain the specified string. |
| Do Not Contain | Excludes dimension values that contain the specified string. |
| Match Regular Expression | Includes only dimension values that match the specified regular expression. |
Manage alert condition expressions
After you add an alert condition, use the icons on the right side of the expression to manage it:
Click the edit icon to modify the expression.
Click the zoom icon to view the metric trend chart based on the current condition.
Click the delete icon to remove the expression.
No-data handling options
The No data parameter under Advanced Alert Settings defines how the system handles data anomalies such as missing data, abnormal composite metrics, and abnormal period-over-period comparison results.
| Scenario | Behavior |
|---|---|
| No metric data available | The metric value is automatically set to 0 or 1, depending on the metric type. |
| Abnormal composite metrics | The metric value is automatically set to 0 or 1. |
| Abnormal period-over-period comparison results | The metric value is automatically set to 0 or 1, or the alert is suppressed. |
For more details about these behaviors, see Terminologies.
Manage alert rules
After you create an alert rule, it appears on the Application Monitoring Alert Rules page. From this page, you can search for, edit, enable, disable, copy, or delete alert rules.
Log on to the EDAS console.
In the left-side navigation pane, choose Application Management > Applications.
In the top navigation bar of the Applications page, select a region, select a microservices namespace from the Microservices Namespace drop-down list, and select ECS Clusters from the Cluster Type drop-down list. Then click the target application name.
In the left-side navigation pane, choose Alert Management > Alert Rule.
(Optional) Search for a specific rule: select Rule name from the drop-down list, enter a keyword, and click the search icon. Fuzzy search is supported.
In the alert rule list, find the target rule and click an action in the Actions column.
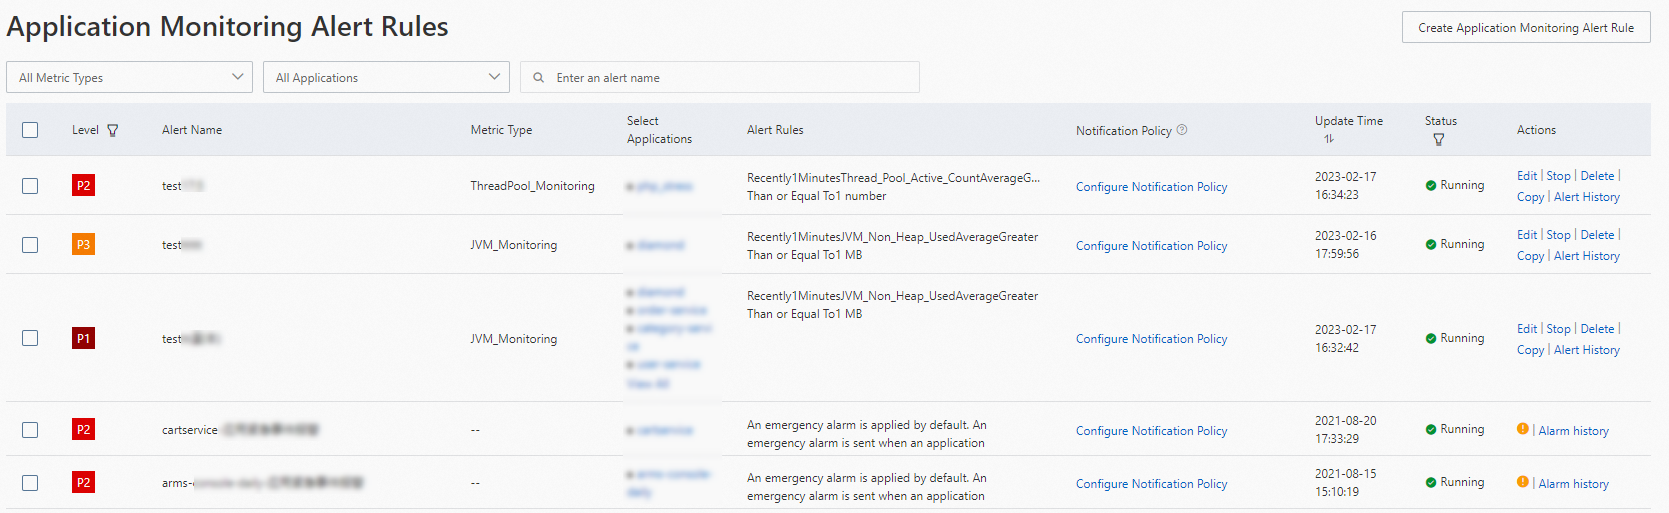
Available actions
| Action | Description |
|---|---|
| Edit | Modify the alert rule configuration. |
| Start | Enable a disabled alert rule. |
| Stop | Disable an active alert rule. Disabled rules do not trigger notifications. |
| Delete | Permanently remove the alert rule. |
| Copy | Duplicate the alert rule as a starting point for a new rule. |
| Alert History | View past alert events triggered by this rule. |