Capture and analyze raw network traffic with tcpdump (Linux) or Wireshark (Windows) to diagnose packet loss, latency, and connectivity issues.
Packet capture process
The following figure shows the packet capture process.

Notes on the preceding process:
|
No. |
Step |
Description |
|
1 |
Identify issue symptoms |
Use tools such as ping and traceroute to determine whether the following issues exist:
|
|
2 |
Choose a packet capture tool |
Choose a packet capture tool based on your operating system:
|
|
3 |
Install and configure the packet capture tool |
Configure filter conditions before capturing to improve efficiency. |
|
4 |
Capture network packets |
Clarify the following before capturing:
|
|
5 |
Analyze the captured data |
Analyze the captured data:
|
|
6 |
Resolve the issue and verify the results |
If the captured data is insufficient, use other tools for further troubleshooting:
|
Use the tcpdump tool in Linux instances
Most Linux distributions have tcpdump pre-installed. If not, install it with a package manager such as APT or YUM. See Use package management tools to manage software.
Description
tcpdump command:
tcpdump [ -AbdDefhHIJKlLnNOpqStuUvxX# ] [ -B buffer_size ]
               [ -c count ] [ --count ] [ -C file_size ]
               [ -E spi@ipaddr algo:secret,...  ]
               [ -F file ] [ -G rotate_seconds ] [ -i interface ]
               [ --immediate-mode ] [ -j tstamp_type ] [ -m module ]
               [ -M secret ] [ --number ] [ --print ] [ -Q in|out|inout ]
               [ -r file ] [ -s snaplen ] [ -T type ] [ --version ]
               [ -V file ] [ -w file ] [ -W filecount ] [ -y datalinktype ]
               [ -z postrotate-command ] [ -Z user ]
               [ --time-stamp-precision=tstamp_precision ]
               [ --micro ] [ --nano ]
               [ expression ]
Frequently used parameters:
|
Parameter |
Description |
|
-s |
The capture size. A value of 0 uses the system-defined capture size. |
|
-w |
Saves captured packets to a file instead of printing to the console. |
|
-i |
The network interface on which to listen. |
|
-vvv |
Prints detailed interaction data. |
|
expression |
The filter expression. Supports the following primitives:
|
See tcpdump man page for all parameters and usage.
Examples
The following examples show common tcpdump commands and their outputs.
-
Capture packets for a specific interface and port
Capture packets on the eth0 interface for port 22 and print to the console:
tcpdump -s 0 -i eth0 port 22During capture, packet data displays in real time. Press
Ctrl+Cto stop. A summary displays after capture stops.tcpdump: verbose output suppressed, use -v or -vv for full protocol decode listening on eth0, link-type EN10MB (Ethernet), capture size 65535 bytes 20:24:59.414951 IP 172.xx.xx.226.ssh > 42.xx.xx.107.43414: Flags [P.], seq 442372:442536, ack 53, win 141, length 164 20:24:59.415002 IP 172.xx.xx.226.ssh > 42.xx.xx.107.43414: Flags [P.], seq 442536:442700, ack 53, win 141, length 164 20:24:59.415052 IP 172.xx.xx.226.ssh > 42.xx.xx.107.43414: Flags [P.], seq 442700:442864, ack 53, win 141, length 164 20:24:59.415103 IP 172.xx.xx.226.ssh > 42.xx.xx.107.43414: Flags [P.], seq 442864:443028, ack 53, win 141, length 164 -
Capture packets with verbose output
Capture packets on the eth1 interface for port 22 with verbose output:
tcpdump -s 0 -i eth1 -vvv port 22During capture, packet data displays in real time. Press
Ctrl+Cto stop. A summary displays after capture stops.tcpdump: listening on eth1, link-type EN10MB (Ethernet), snapshot length 262144 bytes 15:45:54.817920 IP (tos 0x10, ttl 64, id 61958, offset 0, flags [DF], proto TCP (6), length 172) iZr1ulp9t4u4a8Z.ssh > 123.xxx.xxx.74.2057: Flags [P.], cksum 0x80cd (incorrect -> 0x2ee9), seq 890113592:890113724, ack 2345612678, win 592, length 132 15:45:54.894215 IP (tos 0x14, ttl 116, id 16850, offset 0, flags [DF], proto TCP (6), length 40) 123.139.88.74.2057 > iZr1ulp9t4u4a8Z.ssh: Flags [.], cksum 0x1e6a (correct), seq 1, ack 132, win 1021, length 0 15:45:54.913403 IP (tos 0x10, ttl 64, id 61959, offset 0, flags [DF], proto TCP (6), length 172) iZr1ulp9t4u4a8Z.ssh > 123.xxx.xxx.74.2057: Flags [P.], cksum 0x80cd (incorrect -> 0x1105), seq 132:264, ack 1, win 592, length 132 15:45:54.988025 IP (tos 0x10, ttl 64, id 61960, offset 0, flags [DF], proto TCP (6), length 236) iZr1ulp9t4u4a8Z.ssh > 123.xxx.xxx.74.2057: Flags [P.], cksum 0x810d (incorrect -> 0x98d1), seq 264:460, ack 1, win 592, length 196 -
Capture packets of a specific protocol for a specific IP
Capture ICMP packets on the eth0 interface for a specific destination IP:
tcpdump -s 0 -i eth0 -vvv dst 123.xxx.xxx.74 and icmpDuring capture, packet data displays in real time. Press
Ctrl+Cto stop. A summary displays after capture stops.tcpdump: listening on eth0, link-type EN10MB (Ethernet), snapshot length 262144 bytes 15:43:29.116058 IP (tos 0x14, ttl 64, id 26185, offset 0, flags [none], proto ICMP (1), length 60) iZr1ulp9t4u4a8Z > 123.xxx.xxx.74: ICMP echo reply, id 2048, seq 65, length 40 15:43:30.129600 IP (tos 0x14, ttl 64, id 27043, offset 0, flags [none], proto ICMP (1), length 60) iZr1ulp9t4u4a8Z > 123.xxx.xxx.74: ICMP echo reply, id 2048, seq 66, length 40 15:43:31.141576 IP (tos 0x14, ttl 64, id 27201, offset 0, flags [none], proto ICMP (1), length 60) iZr1ulp9t4u4a8Z > 123.xxx.xxx.74: ICMP echo reply, id 2048, seq 67, length 40 15:43:32.153912 IP (tos 0x14, ttl 64, id 27802, offset 0, flags [none], proto ICMP (1), length 60) iZr1ulp9t4u4a8Z > 123.xxx.xxx.74: ICMP echo reply, id 2048, seq 68, length 40 -
Capture packets and save to a file
Capture packets on all interfaces and save to a file:
tcpdump -i any -s 0 -w test.capSample output indicating capture is in progress:
tcpdump: data link type LINUX_SLL2
tcpdump: listening on any, link-type LINUX_SLL2 (Linux cooked v2), snapshot length 262144 bytes
Press
Ctrl+Cto stop. A summary displays after capture stops.^C97 packets captured 127 packets received by filter 0 packets dropped by kernel -
View a capture file
View the content of a tcpdump capture file:
tcpdump -r test.cap
Use the Wireshark tool in Windows instances
Wireshark provides a graphical interface for capturing and analyzing network packets on Windows instances.
Procedure
-
Install and start Wireshark.
Download the installation package from the Wireshark official website and install it.
-
Choose Capture> Options.
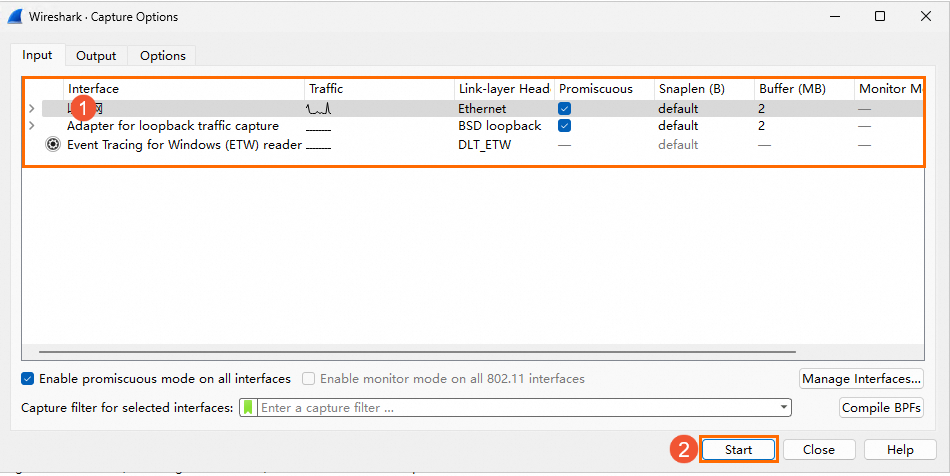
-
On the Wireshark Capture Options page, select a network interface based on the interface name or IP address, and click Start.
-
After sufficient packets are captured, choose Capture > Stop.
-
Choose File > Save to save the captured packets.
-
(Optional) To view a packet capture file, choose File > Open and select the file.
See the Wireshark official website for usage guides and data analysis methods.