Tab | Description |
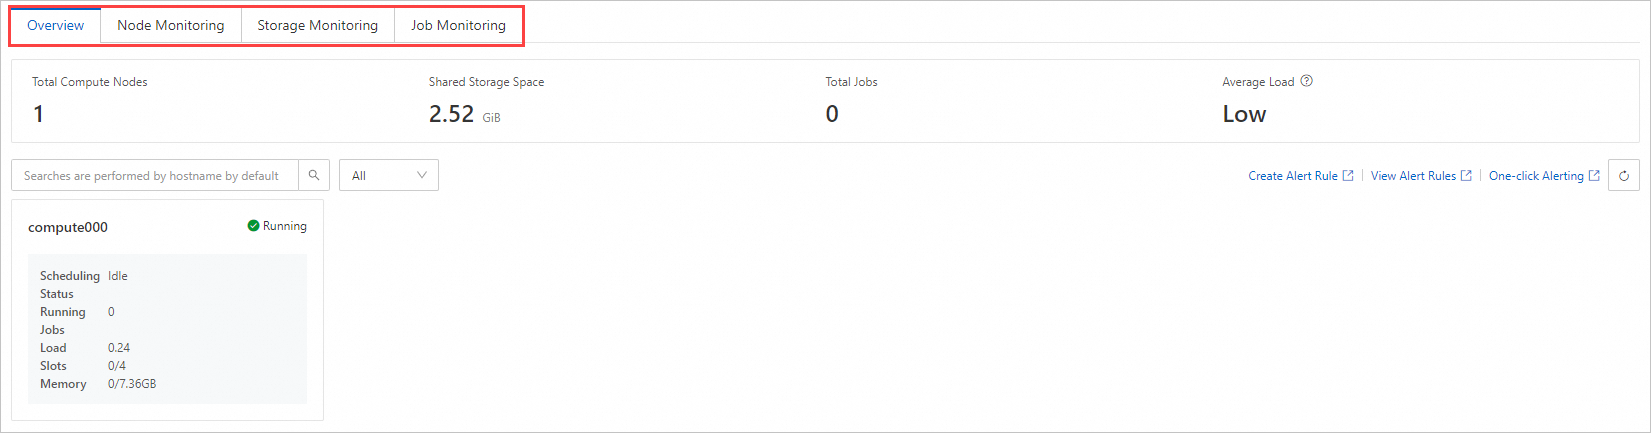
Overview | You can view the following statistics: Total Compute Nodes, Shared Storage Space, Total Jobs, and Average Load. You can also view the status and resource usage of all compute nodes. The following table describes the scheduling status of compute nodes. Idle: All cores in the node are idle. In this case, the computing capability of the node is at its maximum. The node can accept new tasks or jobs to give full play to its computing power. Running: Some cores in the node are occupied, but some cores are still available and can accept new jobs. Allocated: All cores in the node are occupied and cannot accept new jobs. If a new job needs to be submitted, it may be queued until a core is not occupied. Offline: The node no longer participates in computing or task processing and does not accept new jobs.
|
Node Monitoring | You can filter by cluster or queue to view the following six statistics: CPU Utilization The CPU utilization of compute nodes in the cluster. It indicates the total percentage of processing power occupied by programs within a specific period of time. High utilization (more than 80% or 90%) generally means efficient use of resources, but in the long run leads to lower cluster performance and longer response time. Low utilization (0% to 30%) may indicate that resources are underutilized, or that performance bottlenecks or job scheduling issues exist. Memory Usage The memory usage of compute nodes in the cluster. To ensure smooth execution of cluster jobs, you can regularly monitor memory usage to prevent job failures caused by buffer overflow. If necessary, you can resolve memory-related issues by increasing the memory capacity or optimizing the memory usage strategy. System Load The workloads of compute nodes. The information helps you evaluate the job carrying capacity of the cluster. You must monitor the ratio of the load to the number of nodes. An excessively high load indicates that resources are insufficient. You can reduce system load by adding nodes (scale-out) or optimizing the workflow. Disk Usage The usage of disk storage space. The information helps you ensure disk availability and prevent excessive disk usage. For example, if the disk usage reaches 100%, write operations cannot be performed. You can effectively cope with storage pressure by clearing redundant data or expanding storage capacity. This analysis helps you get a complete picture of disk usage and determine whether space cleanup or storage expansion is required. Disk Read and Write The disk read rate indicates the amount of data read per second. The disk write rate indicates the amount of data written per second. Unit: KB/s. The metrics help you effectively evaluate the cluster performance and ensure that the cluster processes computing tasks with high efficiency. Network Traffic The amount of data transferred between compute nodes over the virtual private network (VPC). Pay special attention to periods during which the network traffic is at its highest to detect exceptions in a timely manner. For example, insufficient network bandwidth leads to lower data transmission efficiency.
|
Storage Monitoring | You can view the storage monitoring information of different file systems in the cluster, including the following six statistics: Storage Space The storage usage of the Apsara File Storage NAS (NAS) file system attached to the cluster. The NAS file system can store computing output, temporary files, and application data. To prevent exceptions such as insufficient storage space, performance degradation, and data loss, we recommend that you take measures such as monitoring and alerting, regular data cleansing, and storage expansion. Files The total number of files in the NAS file system. The metric indirectly reflects the system health status and maintenance requirements, and helps you evaluate storage management efficiency. Note that an excessive number of files increases management complexity and affects retrieval efficiency and performance. If the number of files exceeds the preset threshold, you must pay close attention to it. We recommend that you regularly organize the storage content and clear unnecessary or redundant files to improve management efficiency and system performance. IOPS The average read and write IOPS of the file system within a specified period of time. Unit: requests/s. Latency The average read and write latency per millisecond of the file system within a specific period of time. Unit: milliseconds. Throughput The average read and write throughput (bytes per second) of the file system within a specific period of time. Unit: KiB. Metadata QPS The average number of times that the file system requests metadata per second within a specific period of time. Unit: requests/s.
For more information about the storage metrics of a file system, see Performance monitoring and FAQ about the performance of NAS file systems. |
Job Monitoring | You can filter by cluster, queue, project, or user to view the following six statistics: Jobs The number of jobs running in the cluster. It is an important metric for evaluating the cluster load. To prevent resource competition caused by an abnormally high number of jobs, make sure that the metric match with the available resources. To improve overall resource utilization efficiency, we recommend that you optimize job scheduling and eliminate unnecessary jobs. Total Cores Required by Enqueued Jobs The total number of CPU cores that are required to complete a specific task. If the total number of required CPU cores is higher than the number of available CPU cores, the waiting time of queued jobs may be long. To resolve such issues, you can increase the number of CPU cores for the cluster or adjust the priority of jobs to optimize resource allocation and improve efficiency. Job Wait Duration The average waiting time of queued jobs in the cluster. This metric reflects the situation of resource competition. A long waiting time affects the overall efficiency, especially in abnormal situations. If the waiting time increases significantly, you can run high-priority jobs first to optimize resource utilization. Total Cores Used by Running Jobs The total number of CPU cores that are occupied by running jobs. This metric helps monitor resource utilization. To prevent excessively high or low resource utilization, make sure that CPU cores are effectively used. To improve the overall efficiency, we recommend that you adjust job configurations and allocate resources reasonably. Job CPU Utilization The ratio of the number of CPU cores actually used by jobs divided by the number of CPU cores requested by jobs. If the job CPU utilization is low, an exception may exist in the system, for example, the CPU utilization is lower than the expected threshold. The exception may affect the overall performance of the system, resulting in a waste of resources. To improve system performance, we recommend that you analyze jobs and computing workloads in a timely manner. Job Memory Usage The ratio of the amount of memory actually used by jobs divided by the amount of memory requested by jobs. To prevent buffer overflow or insufficient memory caused by excessively high memory usage, pay attention to the memory usage of jobs. To maintain system stability, you can optimize memory configurations or upgrade node specifications.
|