This tutorial shows you how to run a GROMACS molecular dynamics (MD) simulation on an Elastic High Performance Computing (E-HPC) cluster — from cluster setup to job submission and result visualization.
| Step | Action | Result |
|---|---|---|
| 1 | Connect to the cluster | Access the cluster command line |
| 2 | Submit a job | Receive a job ID |
| 3 | View the job result | Visualize molecules in VMD |
| 4 | View computing performance | Analyze node and process metrics |
Background
GROMACS (GROningen MAchine for Chemical Simulations) is a software package for molecular dynamics simulation. It models Newtonian equations of motion for systems with millions of particles, making it suited for biochemical research involving proteins, lipids, and nucleic acids. GROMACS supports common MD algorithms and can use GPUs to accelerate computing-intensive tasks. For more information, see the GROMACS official website.
Sample datasets
Two datasets are available for this tutorial. This tutorial uses Example 2.
Example 1: Lysozyme in water — simulates a protein interacting with ions in a box of water. Download:
https://public-ehpc-package.oss-cn-hangzhou.aliyuncs.com/Lysozyme.tar.gzExample 2: Motion of water molecules — tracks the motion of water molecules in a specific space at a specified temperature. Download:
https://public-ehpc-package.oss-cn-hangzhou.aliyuncs.com/water_GMX50_bare.tar.gz
Prerequisites
Before you begin, ensure that you have:
An E-HPC cluster with the following configuration: For cluster creation instructions, see Create a cluster by using the wizard.
Setting Value Deploy mode Standard Nodes 2 management nodes, 1 compute node, 1 logon node Compute instance type GPU-accelerated (e.g., ecs.gn5-c8g1.2xlarge) Image CentOS 7.2 (public) Scheduler PBS VNC Enabled A cluster user with the following settings: This user logs on to the cluster, compiles software, and submits jobs. For instructions, see Create a user.
Setting Value Username gmx.testUser group sudo permission group The following software installed on the cluster. This tutorial was tested with these versions — other versions may behave differently. For installation instructions, see Install software.
Software Version Gromacs-gpu 2018.1 openmpi 3.0.0 cuda-toolkit 9.0 VMD (Visual Molecular Dynamics) 1.9.3
Step 1: Connect to the cluster
Connect using either the E-HPC client or the E-HPC console. After connecting, you are logged on to /home/gmx.test.
Option A: E-HPC client
The cluster scheduler must be PBS. Make sure the E-HPC client is installed and its environment is configured. For details, see Deploy an environment for an E-HPC client.
Start and log on to the E-HPC client.
In the left-side navigation pane, click Session Management.
In the upper-right corner of the Session Management page, click terminal to open the Terminal window.
Option B: E-HPC console
Log on to the E-HPC console.
In the upper-left corner of the top navigation bar, select a region.
In the left-side navigation pane, click Cluster.
On the Cluster page, find the cluster and click Connect.
In the Connect panel, enter the username and password, and click Connect via SSH.
Step 2: Submit a job
Download and decompress the sample dataset.
wget https://public-ehpc-package.oss-cn-hangzhou.aliyuncs.com/water_GMX50_bare.tar.gz
tar xzvf water_GMX50_bare.tar.gz
chown -R gmx.test water-cut1.0_GMX50_bare
chgrp -R users water-cut1.0_GMX50_bare
Create a job script named
gmx.pbs.vim gmx.pbsPaste the following content into the file:
#!/bin/sh
#PBS -j oe
#PBS -l select=1:ncpus=8:mpiprocs=4
#PBS -q workq

# Load module environment
export MODULEPATH=/opt/ehpcmodulefiles/
module load gromacs-gpu/2018.1
module load openmpi/3.0.0
module load cuda-toolkit/9.0
export OMP_NUM_THREADS=1

cd /home/gmx.test/water-cut1.0_GMX50_bare/0096

# Preprocess input files to generate a TPR binary input file
/opt/gromacs-gpu/2018.1/bin/gmx_mpi grompp -f pme.mdp -c conf.gro -p topol.top -o topol_pme.tpr

# Run the simulation: 4 MPI processes, 1 OpenMP thread each, 100,000 steps
mpirun -np 4 /opt/gromacs-gpu/2018.1/bin/gmx_mpi mdrun -ntomp 1 -nsteps 100000 -pin on -s topol_pme.tpr
Key parameters:
Parameter Value Purpose ncpus=88 vCPUs Matches the ecs.gn5-c8g1.2xlarge instance (8 vCPUs, 1 P100 GPU) mpiprocs=44 MPI processes Splits the simulation across 4 parallel processes -ntomp 11 OpenMP thread per MPI process Avoids over-subscribing CPU cores — 4 processes x 1 thread = 4 threads on 8 vCPUs -nsteps 100000100,000 iterations Controls simulation length; increase for longer or more accurate runs -pin onCPU affinity enabled Pins each thread to a fixed CPU core, reducing context-switching overhead Adjust
ncpus,mpiprocs, and-nstepsbased on your computing requirements.Submit the job.
qsub gmx.pbsThe output is the job ID, for example:
0.scheduler
Step 3: View the job result
Check the job status.
qstat -x 0.schedulerExpected output:
Job id            Name             User              Time Use S Queue
----------------  ---------------- ----------------  -------- - -----
0.scheduler       gmx.pbs          gmx.test          00:34:42 F workq
In the
Scolumn,Rmeans the job is running andFmeans it has finished. While the job is running, monitor the live output with:tail -f gmx.pbs.o0After the job finishes, view the full output with:
cat gmx.pbs.o0Visualize the result using VNC and VMD.
Enable VNC:
NoteMake sure the VNC ports are open in the security group for the cluster. The console automatically opens port 12016. If using the client, open the ports manually. Port 12017 supports one user at a time — open additional ports starting from 12017 for each additional user.
Using the client: In the left-side navigation pane, click Session Management. In the upper-right corner, click VNC to open VNC Viewer.
Using the console:
In the E-HPC console, click Cluster in the left-side navigation pane.
Select the cluster. Choose More > VNC.
Connect to the visualization service. For details, see Use VNC to manage a visualization service.
Open and load the result in VMD:
In the cloud desktop, choose Application > System Tools > Terminal.
Run
/opt/vmd/1.9.3/vmdto open VMD (Visual Molecular Dynamics).On the VMD Main page, choose File > New Molecule....
Click Browse... and select
conf.gro.NoteThe file path is
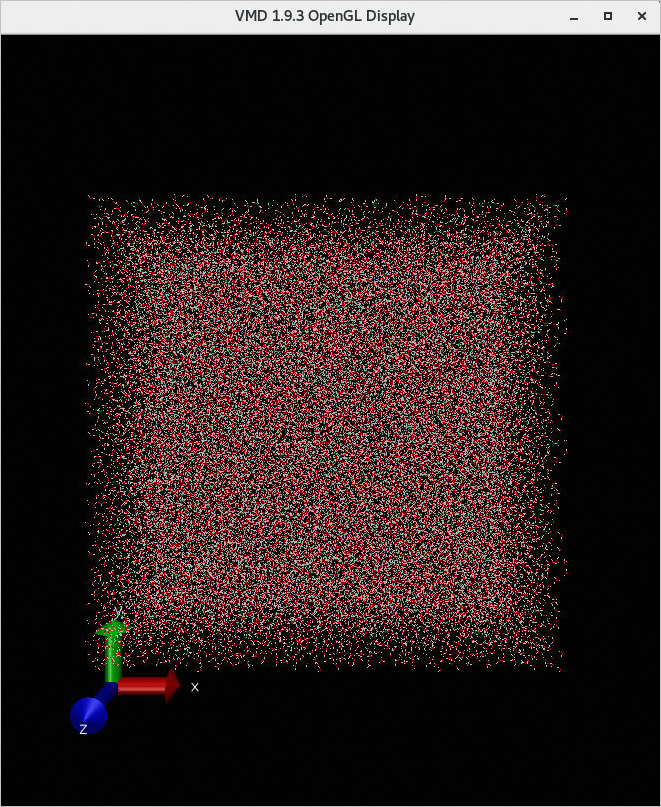
/home/gmx.test/water-cut1.0_GMX50_bare/0096/conf.gro.Click Load. The simulation result appears in the VMD 1.9.3 OpenGL Display window.
Step 4: View computing performance
Computing performance is only viewable in the E-HPC console.
Log on to the E-HPC console.
In the left-side navigation pane, choose Job and Performance Management > E-HPC Tune.
Find the cluster and click Node.
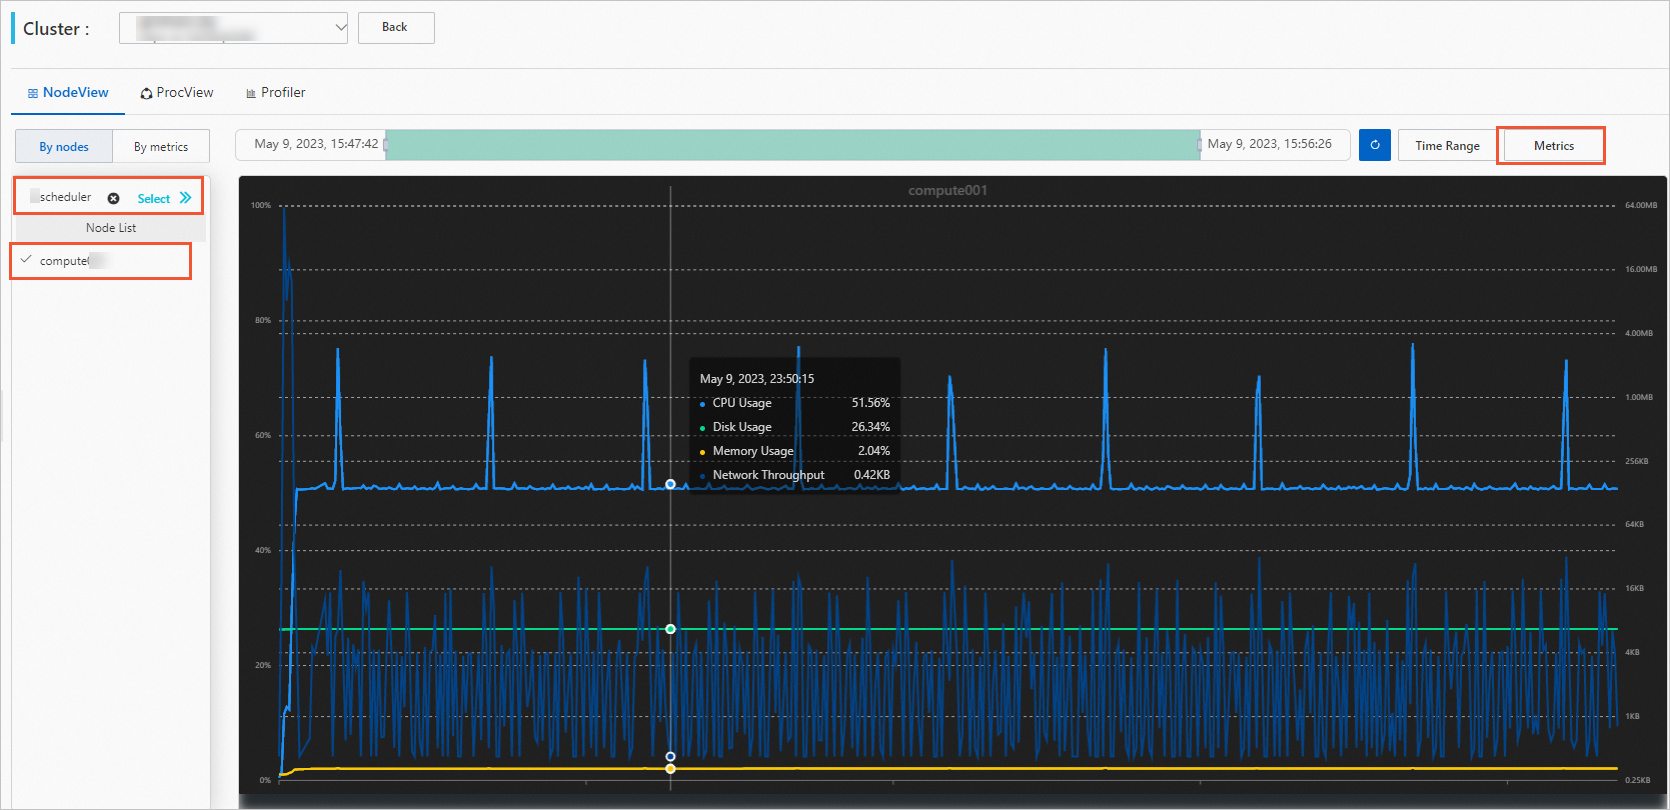
View node performance (NodeView tab):
Select a job and a compute node.
(Optional) Set a time period. When you select a job, the time period automatically matches the job's run window. Adjust it manually as needed.
Click Metrics and select the metrics to view.
Hover over the graph to see detailed data.
View process performance (ProcView tab):
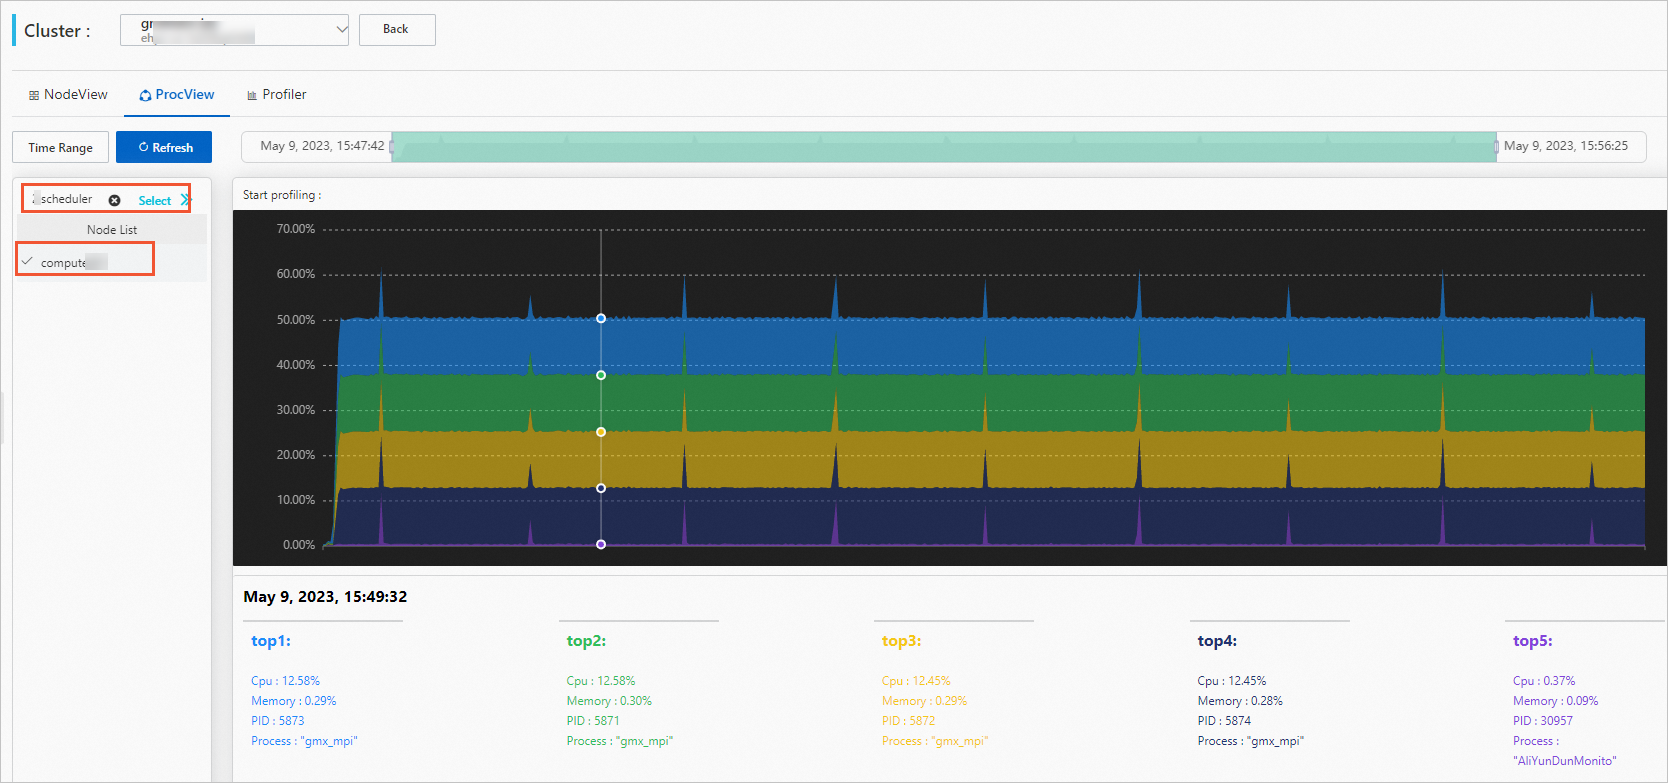
Click the ProcView tab.
Select a job and a compute node.
(Optional) Set a time period.
Hover over the graph to see detailed data.
Start a performance profiling task:
Click a point in time on the process performance graph, then click the process to profile.
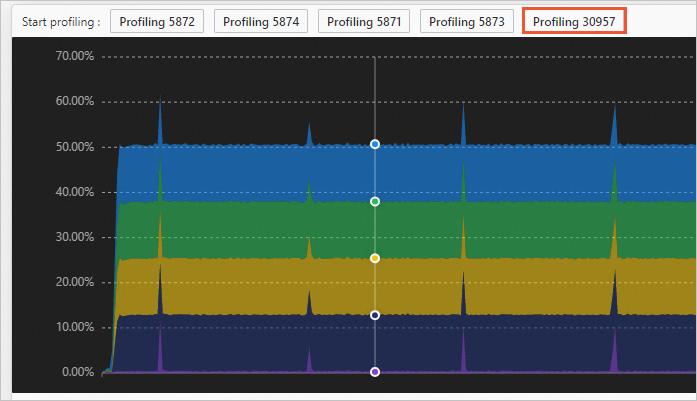
In the dialog box, set the profiling duration and frequency, and click OK to start real-time profiling.
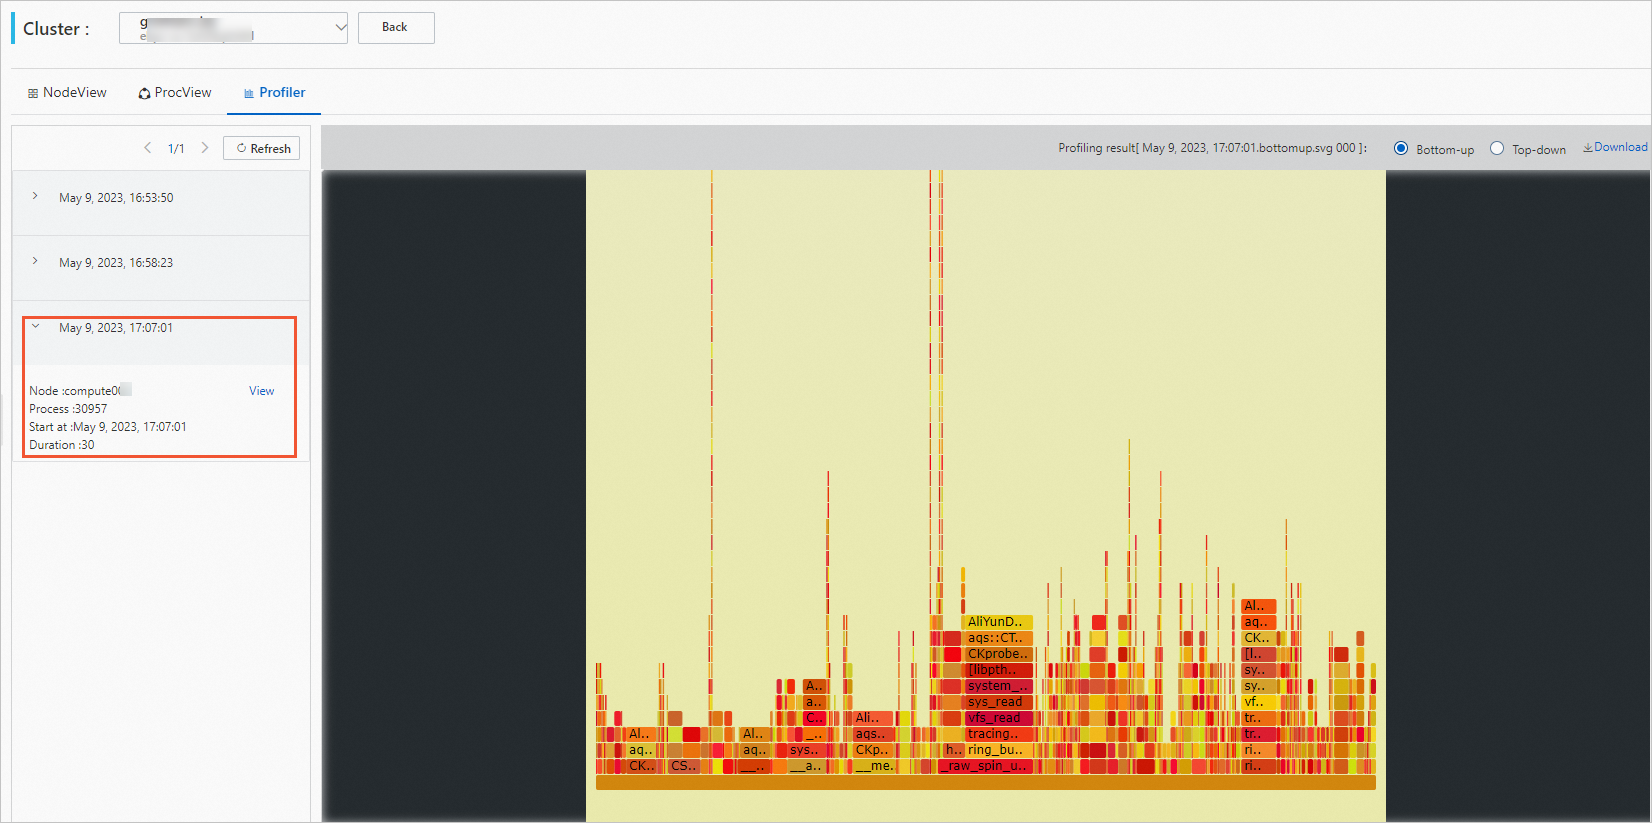
View profiling results (Profiler tab):
Click the Profiler tab.
Select a profiling task and click View.
Hover over the graph to see detailed data.