The resource monitoring feature collects data including network traffic, bandwidth, the number of requests, cache hit ratio, and HTTP status codes based on the region and Internet service provider (ISP) of client IP addresses. You can make informed business decisions and optimize Dynamic Content Delivery Network (DCDN) resource management based on the collected monitoring data.
Overview
Time granularity
You can query resource monitoring data by using the DCDN console or API. However, the maximum time range per query and the time period within which historical data is available are different. The following table describes the maximum time range per query, the time period within which historical data is available, and the data delay.
Use the console
Time granularity
Maximum time range per query
Historical data available
Data delay
5 minutes
3 days
30 days
15 minutes
1 hour
30 days
30 days
4 hours
1 day
30 days
30 days
04:00 on the next day
Use the API
Time granularity
Maximum time range per query
Historical data available
Data delay
5 minutes
3 days
93 days
15 minutes
1 hour
31 days
186 days
4 hours
1 day
366 days
366 days
04:00 on the next day
Differences between resource monitoring and real-time monitoring
Resource monitoring and real-time monitoring differ in time granularity, data delay, and time period within which historical data is available. For information about the time granularity supported by real-time monitoring, see Real-time monitoring.
Monitoring items and metrics
The following table describes the monitoring items. You can specify filter conditions, such as domain name, region, and Internet service provider (ISP), to filter monitoring data. You can also download the monitoring data to your local PC for viewing and analysis.
Data is collected and calculated by calling API operations. For more information, see the API references in the following table.
Monitoring item | Description | API operation |
Traffic and Bandwidth | Monitors the bandwidth and traffic of accelerated domain names. You can query monitoring data by region, ISP, and protocol. The HTTP and HTTPS protocols are supported. | |
Origin Fetch Statistics | Monitors the origin bandwidth and traffic of accelerated domain names. | |
Requests | Monitors the number of requests and QPS of accelerated domain names. You can query monitoring data by region, ISP, and protocol. The HTTP and HTTPS protocols are supported. Note
| |
Hit Rate | Monitors the byte hit ratios and request hit ratios of accelerated domain names. | |
HTTPCODE | Monitors the HTTP status codes, including 2xx, 3xx, 4xx, and 5xx, returned from POPs. |
Usage notes
The traffic usage of accelerated domain names that is queried by using the monitoring or resource usage feature available in the DCDN console or by calling API operations differs from that collected in logs. Typically, the traffic usage of accelerated domain names that is queried by using the monitoring or resource usage feature is 1.1 times that collected in logs. For more information, see Why is the traffic amount found by using the monitoring and usage analytics feature or the usage statistics feature different from the traffic amount that is logged?
In terms of resource monitoring, data is collected based on the region and ISP of client IP addresses. In terms of metering, fees are calculated based on the network traffic, bandwidth, and number of requests on DCDN points of presence (POPs) in each billable region. The resource monitoring data and the metering data may be slightly different due to different collection methods.
Procedure
Log on to the DCDN console.
In the left-side navigation pane, choose .
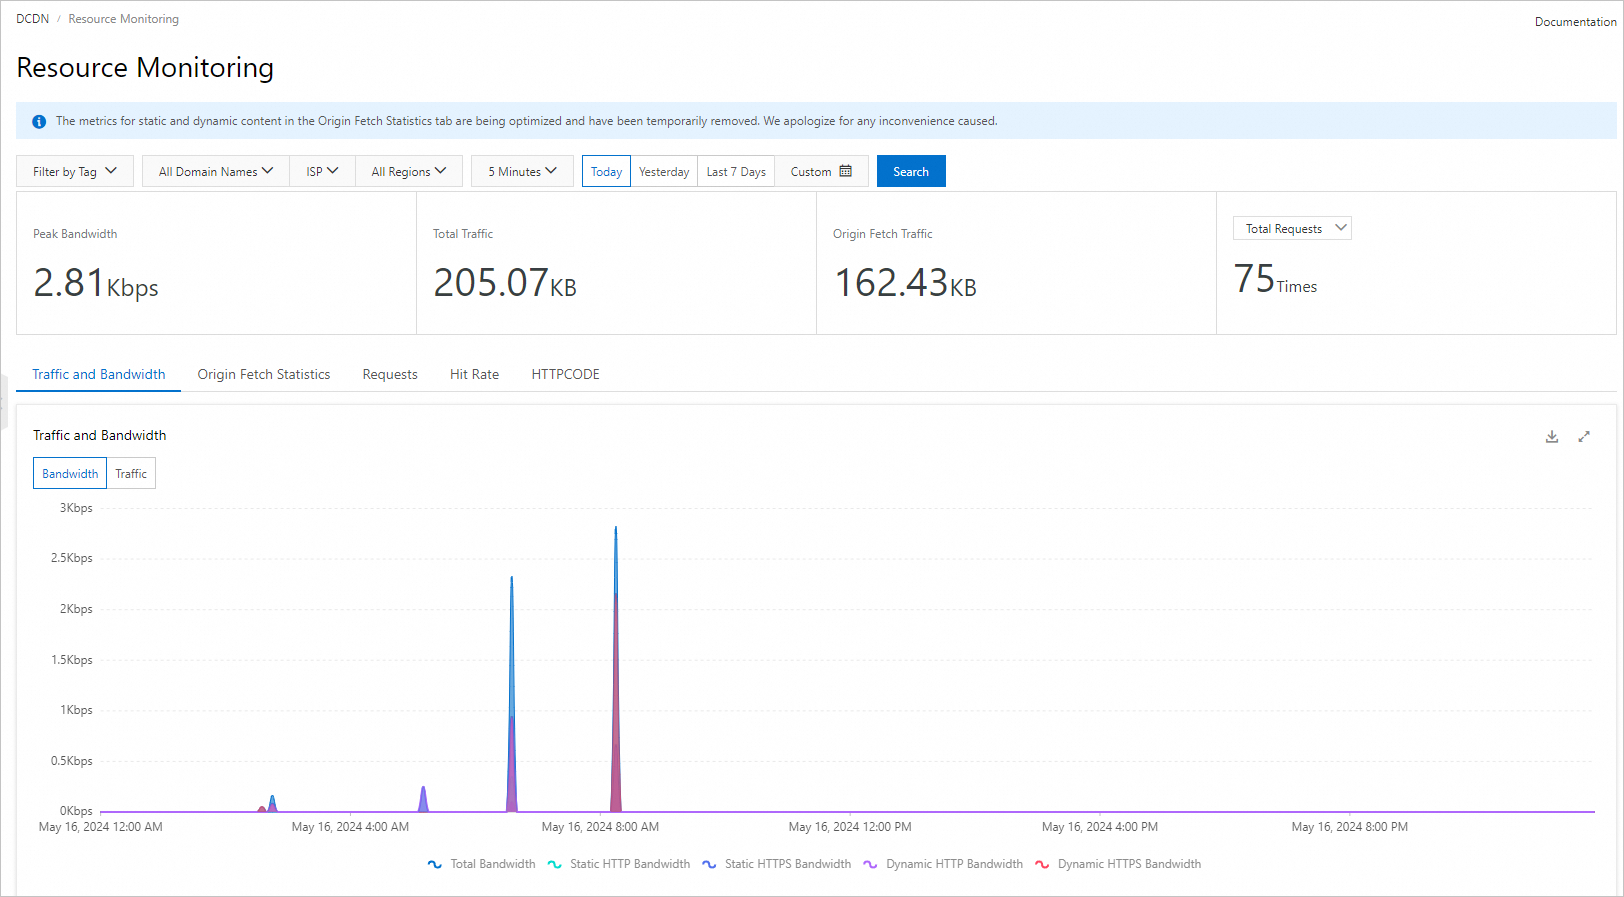
On the Resource Monitoring page, select the monitoring item that you want to query and filter conditions, and click Search.
The system displays monitoring data based on the specified item and filter conditions. Then, you can analyze data online or export the data to your local PC for analysis.