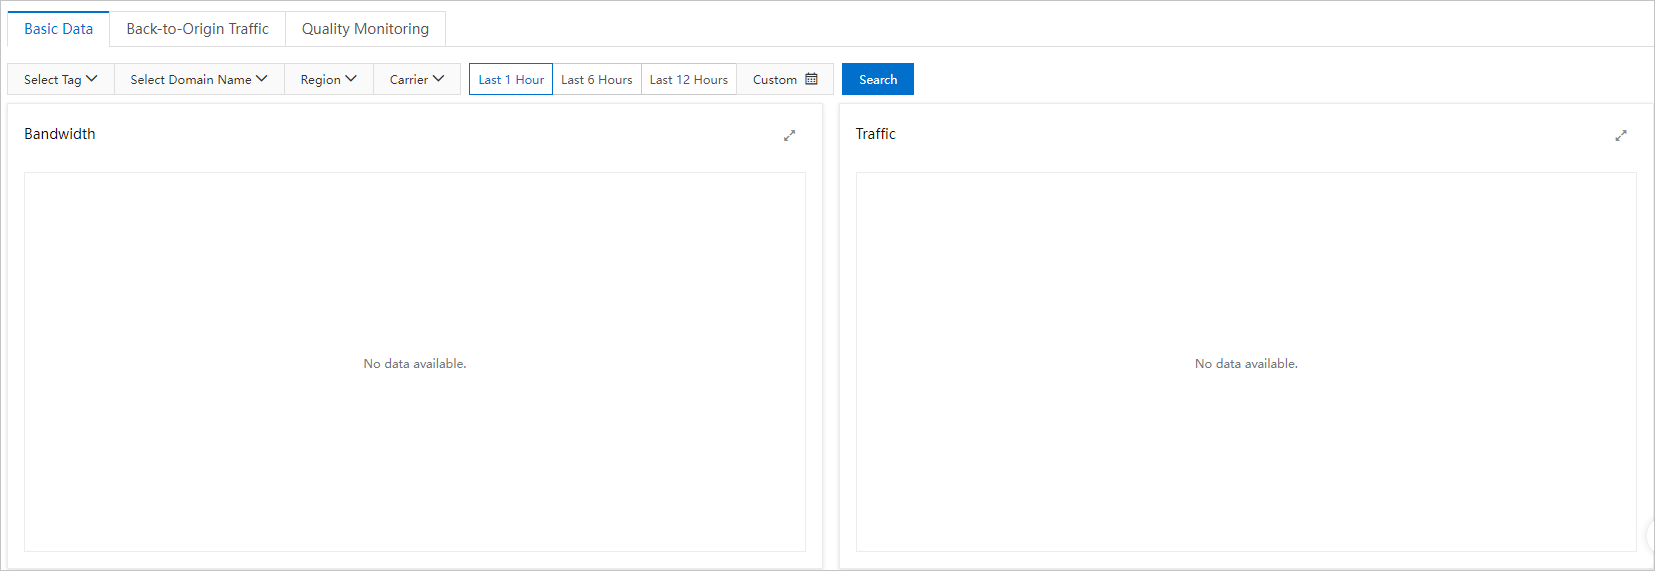
Real-time monitoring gives you 1-minute granularity data on CDN traffic, bandwidth, and origin fetch status — with a data latency as low as 5 minutes. Use it to detect traffic spikes, track cache efficiency, and identify HTTP errors as they happen.
Real-time monitoring provides data at 1-minute granularity on DCDN traffic, bandwidth, and back-to-origin status, with a data delay as low as 3 minutes. Use it to detect traffic spikes, track cache efficiency, and identify HTTP errors as they happen.
Real-time monitoring capabilities
Query capabilities and limits
The time granularity, the maximum time range per query, the historical data available, and the data delay differ between console queries and API queries, as described in the following tables. Use console queries for data within the last 7 days. To query data over a longer historical range or at the 1-hour time granularity, use API operations.
Query in the console:
| Time granularity | Maximum time range per query | Historical data available | Data delay |
| 1 minute | 1 hour | 7 days | 3 to 5 minutes |
| 5 minutes | 3 days | 7 days | 15 minutes |
Query through API operations:
| Time granularity | Maximum time range per query | Historical data available | Data delay |
| 1 minute | 1 hour | 7 days | 5 minutes |
| 5 minutes | 3 days | 93 days | 15 minutes |
| 1 hour | 31 days | 186 days | 4 hours |
Resource monitoring vs. real-time monitoring
Real-time monitoring and resource monitoring differ in time granularity, data delay, the range of historical data that you can query, and the way that data is collected and counted. The Resource monitoring overview covers the time granularity options that resource monitoring supports.
The two features also count different request types when they calculate the hit rate. Resource monitoring excludes dynamic requests and counts only static requests, whereas real-time monitoring counts all request types, including both static requests and dynamic requests. As a result, the hit rate reported by resource monitoring may be higher than the hit rate reported by real-time monitoring.
Resource monitoring collects data by client region and ISP. Billing is metered by traffic, bandwidth, and requests at DCDN nodes per billable region, so results may differ.
Monitoring items and metrics
Real-time monitoring provides the three monitoring items listed in the following table, covering metrics such as bandwidth and traffic.
The monitoring data is calculated and aggregated by the API operations listed in the following table.
| Monitoring item | Monitoring metrics | API reference |
| Basic Data | Bandwidth, traffic, requests, and QPS of accelerated domain names. | |
| Back-to-Origin Traffic | Origin bandwidth and back-to-origin traffic of accelerated domain names. | |
| Quality Monitoring | Request hit rate, byte hit rate, and 2xx, 3xx, 4xx, and 5xx status codes of accelerated domain names. |
Usage notes
Traffic data from the DCDN console or API may differ from log-based data. Monitoring traffic is typically about 1.1 times the log-calculated amount. For more information, see Why is the traffic amount found by using the monitoring and usage analytics feature or the usage statistics feature different from the traffic amount that is logged?
Procedure
Log on to the DCDN console.
In the left-side navigation pane, click Business Monitoring > Real-time Monitoring.
On the Real-time Monitoring page, select the monitoring items and metrics that you want to view, specify the domain names, regions, ISPs, and time range that you want to monitor, and then click Search. The maximum time range per query depends on the time granularity that you select. For more information, see Query capabilities and limits. Query results appear based on the monitoring items and query conditions that you select, and you can analyze them online.