The real-time monitoring feature in Dynamic Content Delivery Network (DCDN) collects data at an interval of 1 minute. You can query data transfer, bandwidth usage, and origin fetch statistics in the last 1 minute and earlier. You can query data in the last 7 days. The maximum time range per query is 24 hours. Real-time monitoring allows you to detect anomalies in network traffic and locate errors at the earliest opportunity.
Overview
Time granularity
You can query monitoring data by using the DCDN console or API. However, the time granularity, the maximum time range per query, and the period within which historical data is available are different. The following table describes the maximum time range per query, the period within which historical data is available, and the data delay.
Use the console
Time granularity
Maximum time range per query
Historical data available
Data delay
1 minute
1 hour
7 days
3 to 5 minutes
5 minutes
3 days
7 days
15 minutes
Use the API
Time granularity
Maximum time range per query
Historical data available
Data delay
1 minute
1 hour
7 days
5 minutes
5 minutes
3 days
93 days
15 minutes
1 hour
31 days
186 days
4 hours
Differences between resource monitoring and real-time monitoring
Real-time monitoring and resource monitoring differ in time granularity, data delay, and time period within which historical data is available. For information about the time granularity supported by resource monitoring, see Resource monitoring.
Monitoring items and metrics
The following table describes the monitoring items. You can query metrics such as bandwidth and traffic by specifying query conditions, such as domain name, region, Internet service provider (ISP), and time range.
Data is collected and calculated by calling API operations. For more information, see the API references in the following table.
Monitoring item | Description | API operation |
Basic Data | Monitors the bandwidth, traffic, number of requests, and queries per second (QPS) of accelerated domain names. | |
Back-to-Origin Traffic | Monitors the origin bandwidth and traffic of accelerated domain names. | |
Quality Monitoring | Monitors the request hit ratio, byte hit ratio, and HTTP status codes 2xx, 3xx, 4xx, and 5xx of accelerated domain names. |
Usage notes
The traffic usage of accelerated domain names that is queried by using the monitoring or resource usage feature available in the DCDN console or by calling API operations differs from that collected in logs. Typically, the traffic usage of accelerated domain names that is queried by using the monitoring or resource usage feature is 1.1 times that collected in logs. For more information, see Why is the traffic amount found by using the monitoring and usage analytics feature or the usage statistics feature different from the traffic amount that is logged?
In terms of resource monitoring, data is collected based on the region and ISP of client IP addresses. In terms of metering, fees are calculated based on the network traffic, bandwidth, and number of requests on DCDN points of presence (POPs) in each billable region. The resource monitoring data and the metering data may be slightly different due to different collection methods.
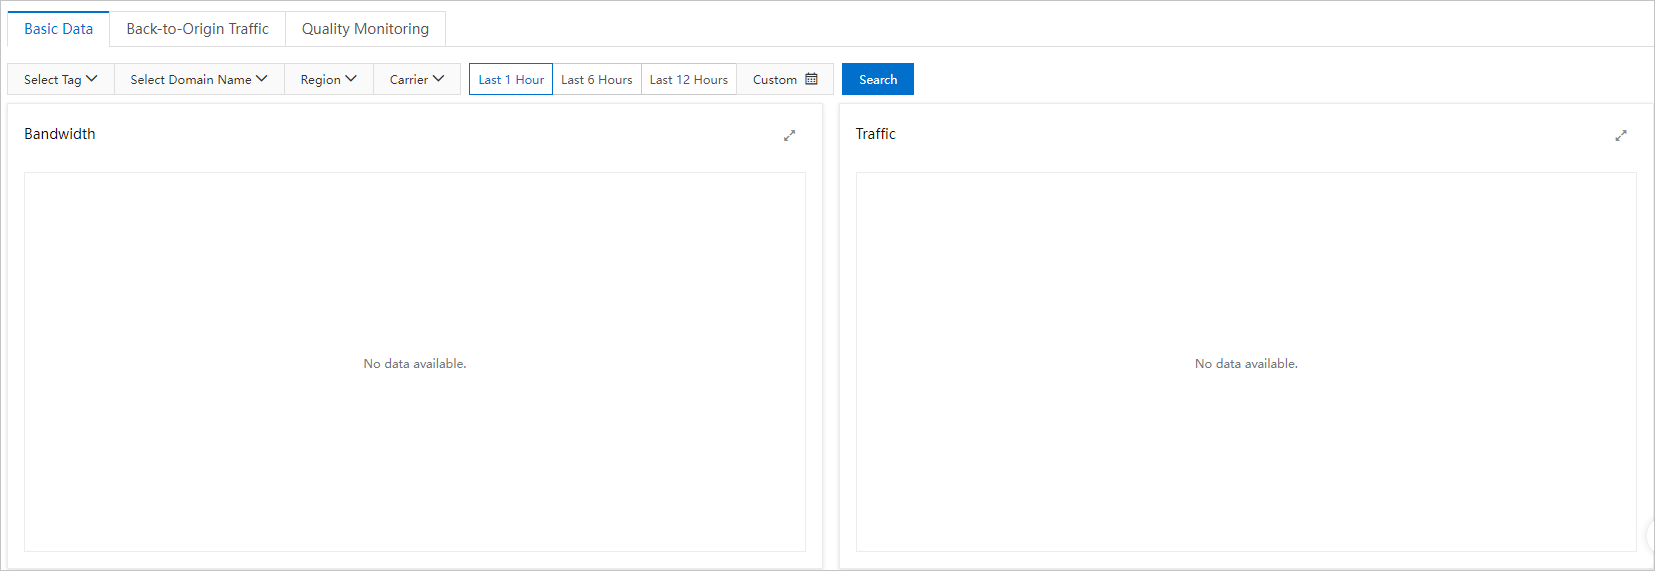
Procedure
Log on to the DCDN console.
In the left-side navigation pane, choose .
On the Real-time Monitoring page, select the monitoring item and metric that you want to query, and click Search.
The system displays the query results based on the monitoring item and filter conditions that you selected. You can analyze the query results online.