This topic describes the page loading speed detection and analysis features in browser monitoring of Application Real-Time Monitoring Service (ARMS).
After your application is connected to the ARMS browser monitoring feature, you can view the following performance data of the application on the Page Speed page:
You can manually report custom performance metrics, such as the first paint time (FPT) and time to interact. For more information, see SDK methods.
Procedure
Log on to the ARMS console. In the left-side navigation pane, choose .
On the Browser Monitoring page, select a region in the top navigation bar and click the name of the application that you want to manage.
In the left-side navigation pane, choose .
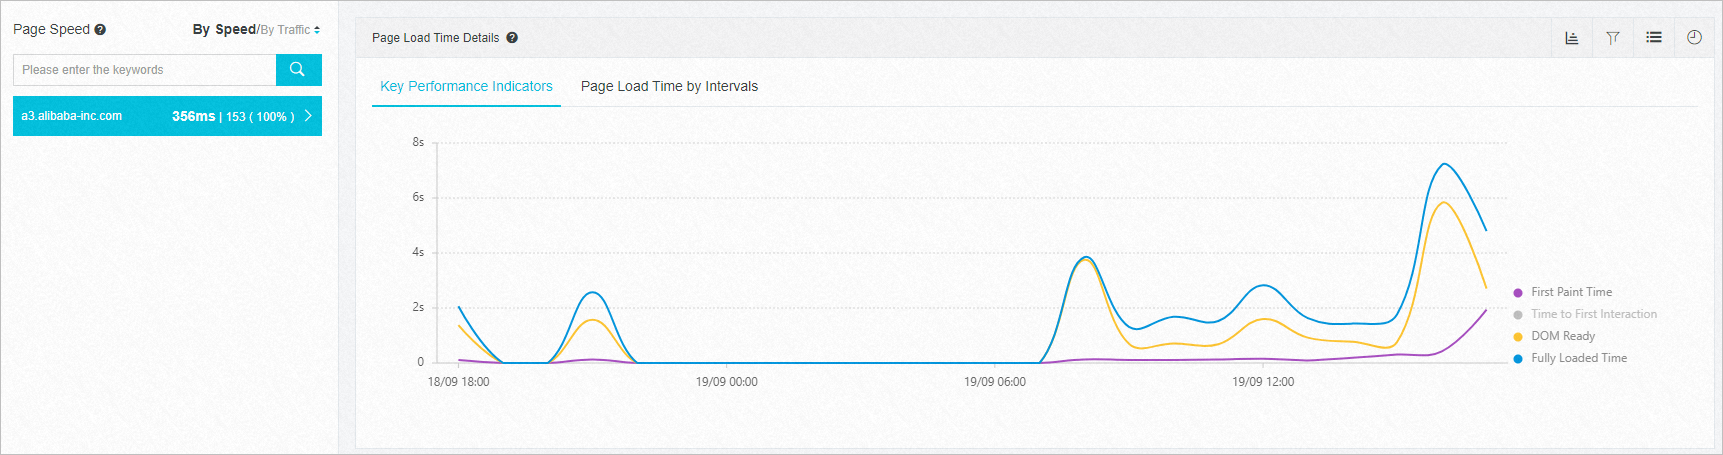
In the Page Speed section, you can rank the pages by FPT or page views (PVs), and change the display order by clicking the upward or downward arrow.
Details of the page loading time
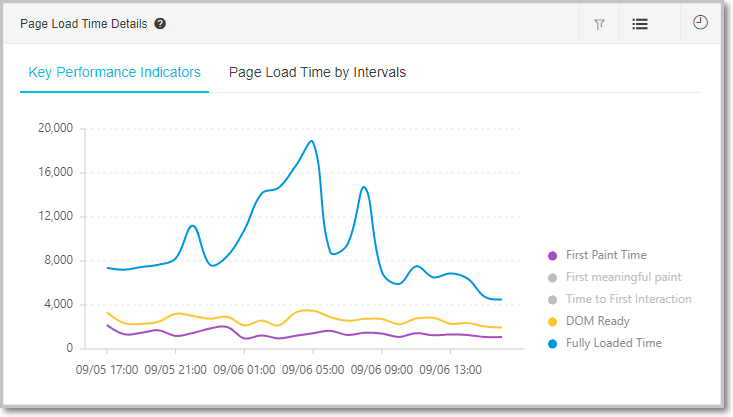
In the Page Load Time Details section, the curve chart displays the average values of the metrics within the specified time range. The average value reflects the average performance over a period of time. However, this value is sensitive to extreme values and large fluctuations. For example, if the overall page loading speed is low due to the weak network connection of an access request, the average response time is long. You can click the
 icon in the upper-right corner to remove extreme values. This way, the extreme values do not affect the overall performance trend.
 If the data in the curve chart increases sharply, you can use the Performance Sample Distribution and Slow Page Session Trace(TOP20) sections to identify the issue.
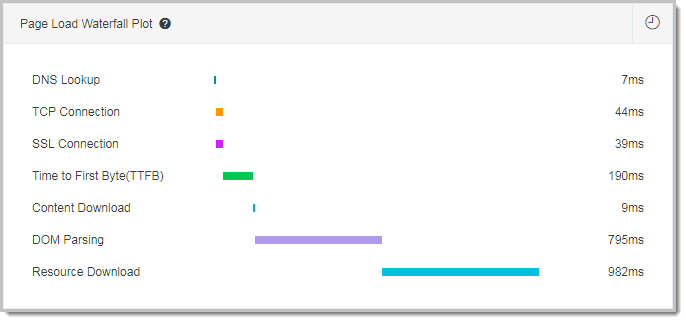
Waterfall chart of page loading data
In the Page Load Waterfall Plot section, the waterfall chart shows the response time of each page loading stage in sequence. The chart displays the average value of a specific metric within a specified time range. To improve page loading performance, we recommend that you implement the countermeasures for stages based on the specific issues.
Distribution of pages with different loading speeds
The Performance Distribution section shows the distribution of the pages with different loading speeds.
The Performance Stacked Area Chart tab displays a stack line chart that uses time as the horizontal axis. You can view the distribution of pages with different loading speeds at each point in time.
Figure 1. Performance Stacked Area Chart tab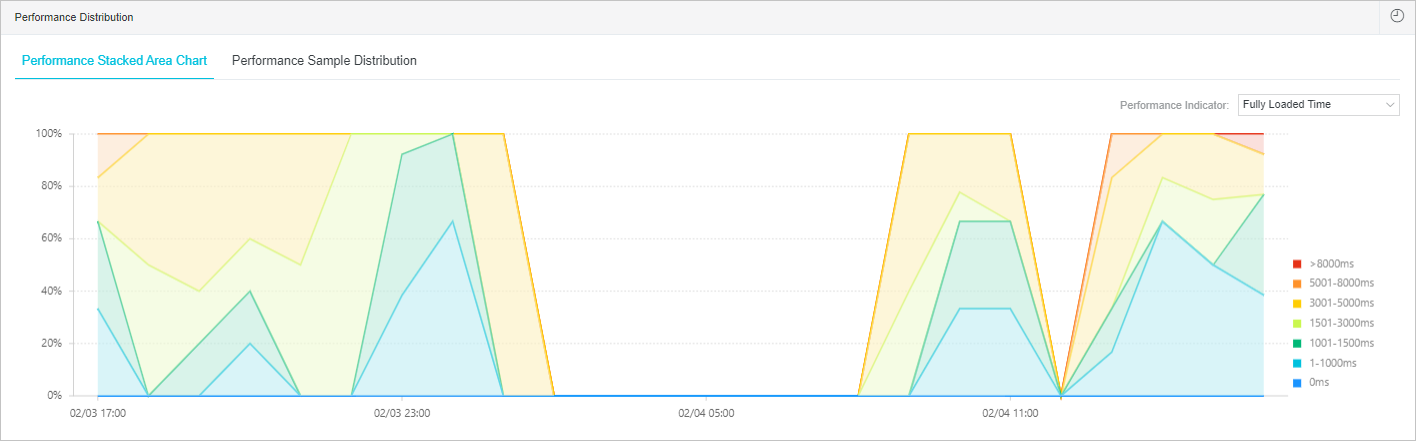
On the Performance Sample Distribution tab, you can view the proportion of the sample pages with a specific loading speed in a time range. For example, you can view the number of pages that can be opened within 1 second and the proportion of samples of long-tail users.
Figure 2. Performance Sample Distribution tab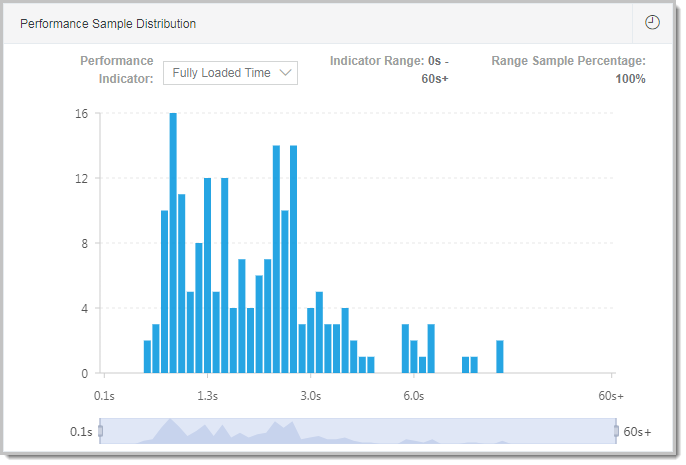
Traces of slow page sessions
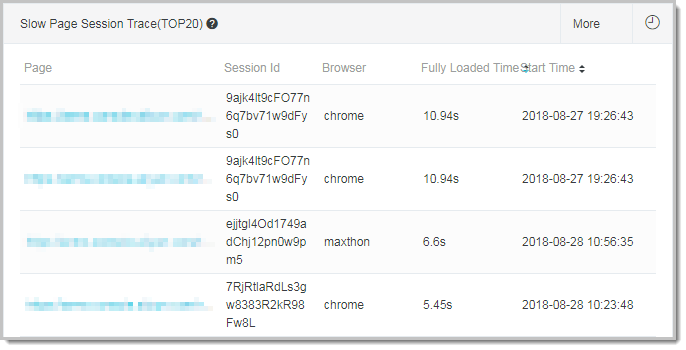
The Slow Page Session Trace(TOP20) section provides a performance waterfall chart of static resource loading during the page loading process. In this section, you can view the status of page resource loading based on page performance data. This allows you to identify and handle performance bottlenecks at the earliest opportunity. For more information, see Session tracing.
Factors that affect page loading performance
A page is loaded on the browser of a user. The loading time is determined by specific factors. These factors include the geographical location, network condition, browser, and carrier. Therefore, the browser monitoring feature provides the statistics on geographical distribution, terminal distribution, network distribution, and version distribution. This allows you to identify performance bottlenecks.
Figure 3. Terminal distribution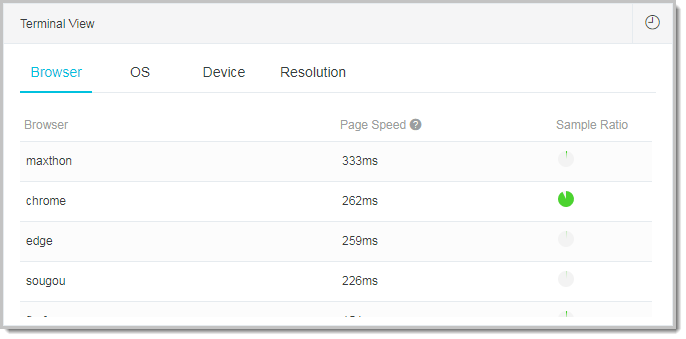
Figure 4. Network condition distribution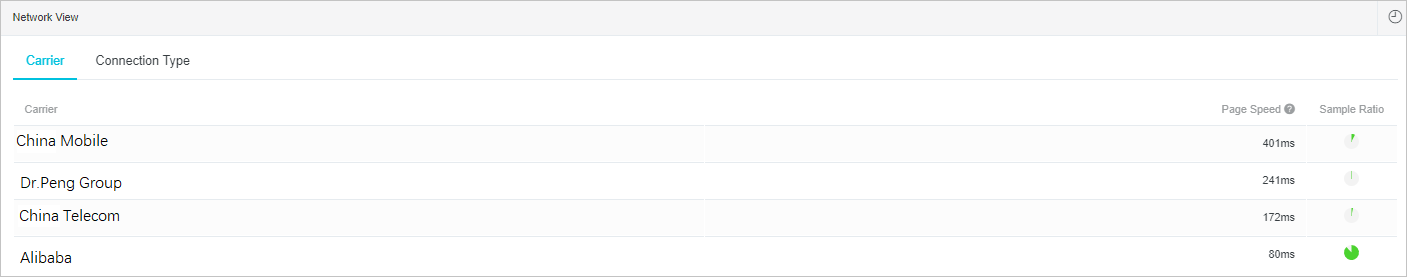
Figure 5. Version distribution
Performance metrics
Table 1. Key performance metrics of web pages
Reported field | Description | Formula | Remarks |
FMP | The First Meaningful Paint (FMP). | N/A | None |
FPT | The FPT. | responseEnd - fetchStart | This field indicates the duration from the point in time when a request is initiated to the point in time when the browser begins to parse the bytes of the first batch of HTML documents. |
TTI | The Time to Interactive (TTI). | domInteractive - fetchStart | This field indicates the point in time when the browser starts to load resources after it resolves all HTML documents and constructs the document object model (DOM). |
Ready | The time consumed to complete HTML loading, which is the time consumed to construct the DOM. | domContentLoadEventEnd - fetchStart | If a JS script is synchronously executed on the page, the execution time of the JS script can be calculated based on the following formula: Execution time of the JS script = Ready - TTI. |
Load | The time consumed to completely load the page. | loadEventStart - fetchStart | This field can be calculated based on the following formula: Load = FPT + DOM + (Ready - TTI) + Res. |
FirstByte | The time consumed to receive the first data packet from the server. | responseStart - domainLookupStart | None |
Table 2. Fields that describe the time consumed in each phase
Reported field | Description | Formula | Remarks |
DNS | The time consumed for Domain Name System (DNS) query. | domainLookupEnd - domainLookupStart | None |
TCP | The time consumed for Transmission Control Protocol (TCP) connection. | connectEnd - connectStart | None |
TTFB | The time to first byte (TTFB), which indicates the time consumed to respond to a request. | responseStart - requestStart | TTFB can be calculated in different ways. For more information about how TTFB is calculated in ARMS, see Google development definition. |
Trans | The time consumed for data transmission. | responseEnd - responseStart | None |
DOM | The time consumed for DOM resolution. | domInteractive - responseEnd | None |
Res | The time consumed for resource loading. | loadEventStart - domContentLoadedEventEnd | The time consumed to synchronously load resources on the page. |
SSL | The time consumed for Secure Sockets Layer (SSL) connection. | connectEnd - secureConnectionStart | This field is valid only when HTTPS is used to transmit data. |