Mobile Analysis Service (MAS) helps you monitor app stability, track user behavior, and diagnose issues across platforms — giving your team the data to ship faster and keep users engaged.
Features
Easy integration: Import the Mobile Analysis component to automatically collect behavioral logs, network logs, and exception logs — no manual instrumentation required.
Comprehensive analysis: Analyze app performance across user behavior, device health, traffic, power consumption, communication links, and performance.
Multi-dimensional views: Slice and compare data by device type, OS version, region, network type, and device model.
Fast problem diagnosis: Crash and exception logs capture the API name, exception cause, and runtime environment — giving you the context to identify and fix issues quickly.
Functions
User behavior analysis: Track how users engage with your app through metrics such as active users, sign-ins, and new users. Compare data across platforms, versions, regions, and time periods to understand usage patterns.
Mini Program analysis: Get full data coverage for mini programs on the Alipay, WeChat, and mPaaS platforms. Dedicated modules for user, page, and sharing behavior report metrics including new and active users, user sources, session duration, retention rate, and sharing performance.
Stability analysis: Monitor app stability through crash monitoring, exception monitoring, performance monitoring, and user diagnostics — so you can find and fix issues before they affect users at scale.
Problem diagnosis: Diagnose issues at the individual user level. User-level diagnosis retrieves client behavior in real time; diagnostic log collection sends instructions to the client via push notifications to pull local logs on demand.
Use cases
Data-driven decisions: Use MAS data to guide product roadmap, operations planning, and promotion strategy — replacing assumptions with evidence.
Crash recovery and retention: Locate crash sources quickly and deploy hotpatching without a full app release. Resolving crashes faster improves user experience and keeps retention high.
How it works
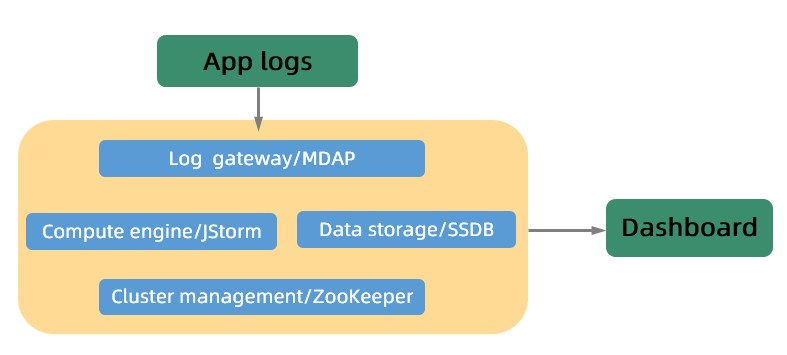
MAS is built on four components that handle the full data pipeline from collection to storage:
mdap: A log collection gateway that collects client instrumentation logs and forwards them to a JStorm cluster for processing.
JStorm: A real-time computing engine that parses incoming logs against processing rules and writes the results to storage.
SSDB: A key-value (KV) storage layer backed by LevelDB, supporting billions of records in a non-partitioned table.
ZooKeeper: Manages cluster coordination and service discovery across all components.