Simple Log Service allows you to save query and analysis results as charts to a dashboard. This topic describes how to add a chart to a dashboard.
Prerequisites
Data is collected.
Simple Log Service can collect log, metric, and trace data. For more information, see Log data collection, Metric data collection, and Trace data collection.
Important Before you can obtain a chart based on log data and add the chart to a dashboard, you must store the data in a Standard Logstore. For more information, see Manage a Logstore.If log data is collected, you must configure indexes for the data. For more information, see Create indexes.
A dashboard is created. For more information, see Create a dashboard.
Limits
The number of charts that can be added to a dashboard is limited. For more information about the upper limit, see Basic resources.
Entry point
You can add a chart on a Logstore page or a dashboard page. The configuration items are the same regardless of the entry point that you use. In the following procedure, a chart is added on a dashboard page.
Logstore page
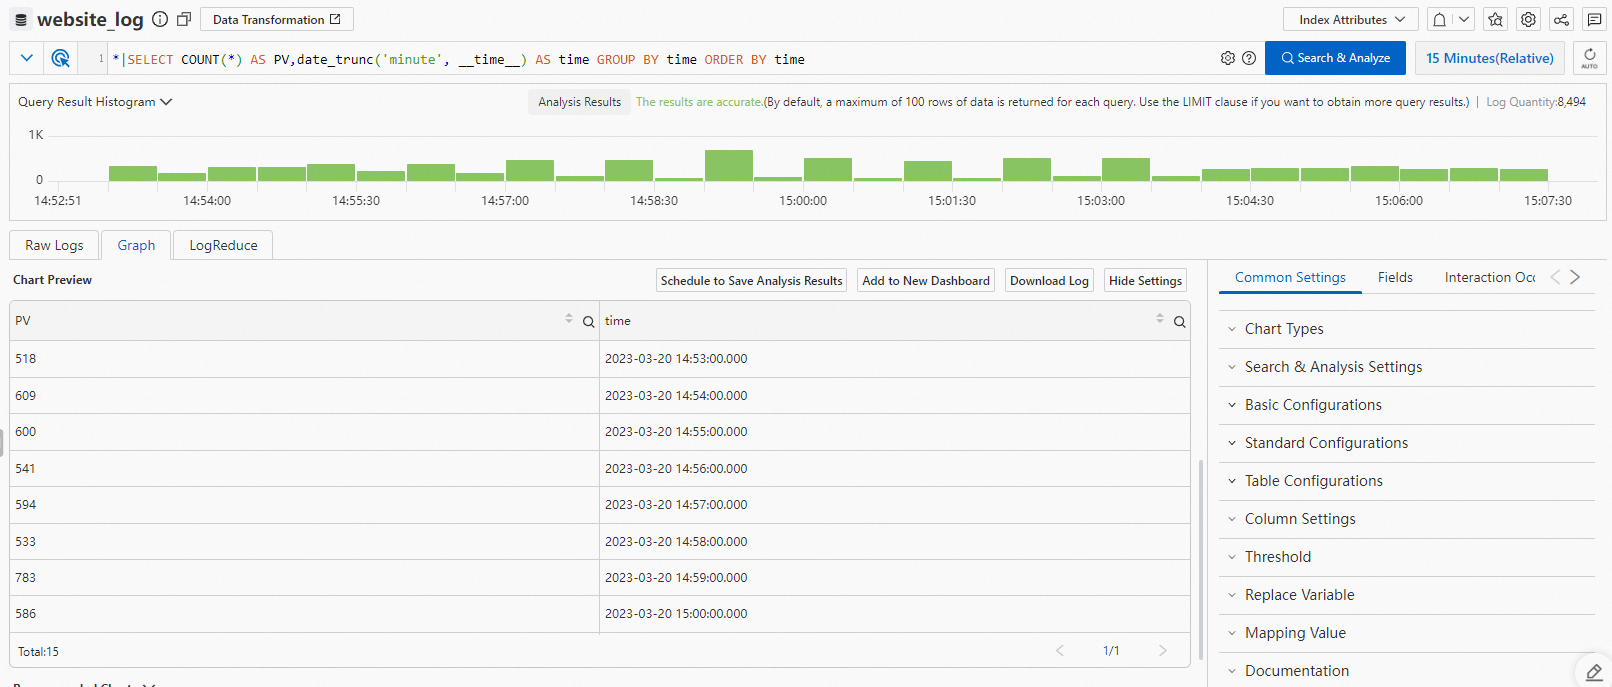
If you want to add a chart on a Logstore page, you must execute a query statement, select a chart type, and then save the chart to a dashboard. For more information about how to access a Logstore page, see Query and analyze logs.
Dashboard page
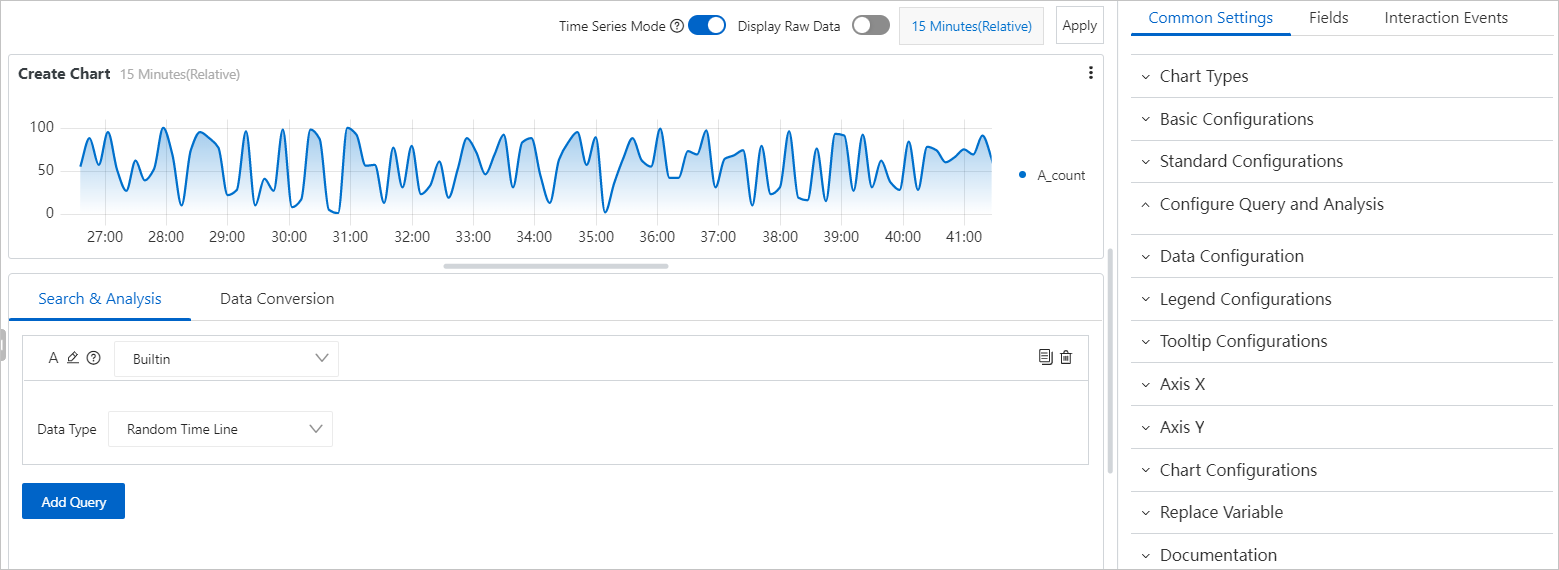
If you want to add a chart on a dashboard page, you must select a dashboard, select a chart, and then execute a query statement. For more information about how to access a dashboard page, see Create a dashboard.
Procedure
You can add multiple charts to a dashboard. You can add one chart to the dashboard at a time.
Log on to the Simple Log Service console.
Go to the page on which you can create a chart.
In the Projects section, click the project that you want to manage.
In the left-side navigation pane, choose .
In the Dashboard list, click the dashboard that you want to manage.
In the upper-right corner of the dashboard page, click Edit.
Choose Add > Add Chart.
In edit mode, choose General Configurations >
 .
.
Add query statements.
You can add multiple query statements. For more information, see Query and analysis.
Optional. Configure data conversion rules.
Before you use charts to display the results of query statements, you can configure data conversion rules to process the results. For example, you can configure a rule to merge the results of multiple query statements or classify the results of a query statement. For more information, see Data conversion.
Optional. Configure chart attributes.
Simple Log Service automatically configures chart attributes based on the results of your query statements. If the default settings meet your requirements for visualization, you do not need to configure chart attributes.
Configure settings on the General Configurations tab.
You can configure global settings for the chart on the General Configurations tab. For more information, see General Configurations.
Configure settings on the Field Configuration tab.
You can configure custom display settings for the results of a single query statement or for a single column of data in the results. For more information, see Field Configuration.
Optional. Configure an interaction occurrence.
You can configure an interaction occurrence for the results of a single query statement or for a single column of data in the results to analyze data from a finer-grained dimension. For more information, see Interaction occurrences.
On the Edit Chart page, click OK.
On the dashboard page, click Save.