Event alerting notifies you of DDoS attacks on your services. This helps you quickly identify and resolve issues, reduce troubleshooting time, and restore your services as soon as possible. This topic describes how to set up alert notifications for DDoS Basic and Anti-DDoS Origin attack events.
Alerting methods
Alibaba Cloud Anti-DDoS Origin provides alerting through Message Center, Cloud Monitor, and the log analysis feature. You can compare these methods across several dimensions to choose the right solution.
Comparison Item | Message Center Alerting | Cloud Monitor Alerting | Log Analysis Feature Alerting | |
Supported product types | DDoS Basic | Anti-DDoS Origin | Anti-DDoS Origin | Anti-DDoS Origin |
Scenarios | General alerts, for when you only need to know that an attack is happening. | General alert. You only need to be notified Under attack. | General alerts, with simple filters to notify you only about important events. | Enterprise-level alerts. Supports custom condition combinations, alerting methods, notification methods, and notification content. Also generates statistical reports based on filter conditions. |
Configuration complexity | Simple | Simple | Moderate | Complex |
Flexibility | Low Supports alerts at the start and end of an event. | Low Supports alerts at the start and end of an event. | Medium Supports alerts for specific, filtered events at the start and end of an event. | High Supports alerts at the start and end of an event, alerts based on traffic thresholds, and alerts based on various combined conditions. |
Notification methods |
|
|
|
|
Reliability and timeliness | Reliability and timeliness are not fully guaranteed. Message throttling may occur during periods of extremely high concurrent system requests. Important Build your own traffic monitoring system. For example, monitor traffic for IP addresses for sudden increases or decreases, or use external probes to check availability. | High reliability. Alert latency is typically within 5 minutes. | High reliability. Alert latency is typically 5 to 10 minutes. | High reliability. Alert latency is typically 5 to 10 minutes. |
Configure alerts in Message Center (DDoS Basic and Anti-DDoS Origin)
Message Center is a notification service for your Alibaba Cloud account. It supports various types of notifications related to Alibaba Cloud services.
Log on to the Message Center console.
Configure alert notifications.
Notification method
Configuration
Internal Message, Email
In the navigation pane on the left, click .
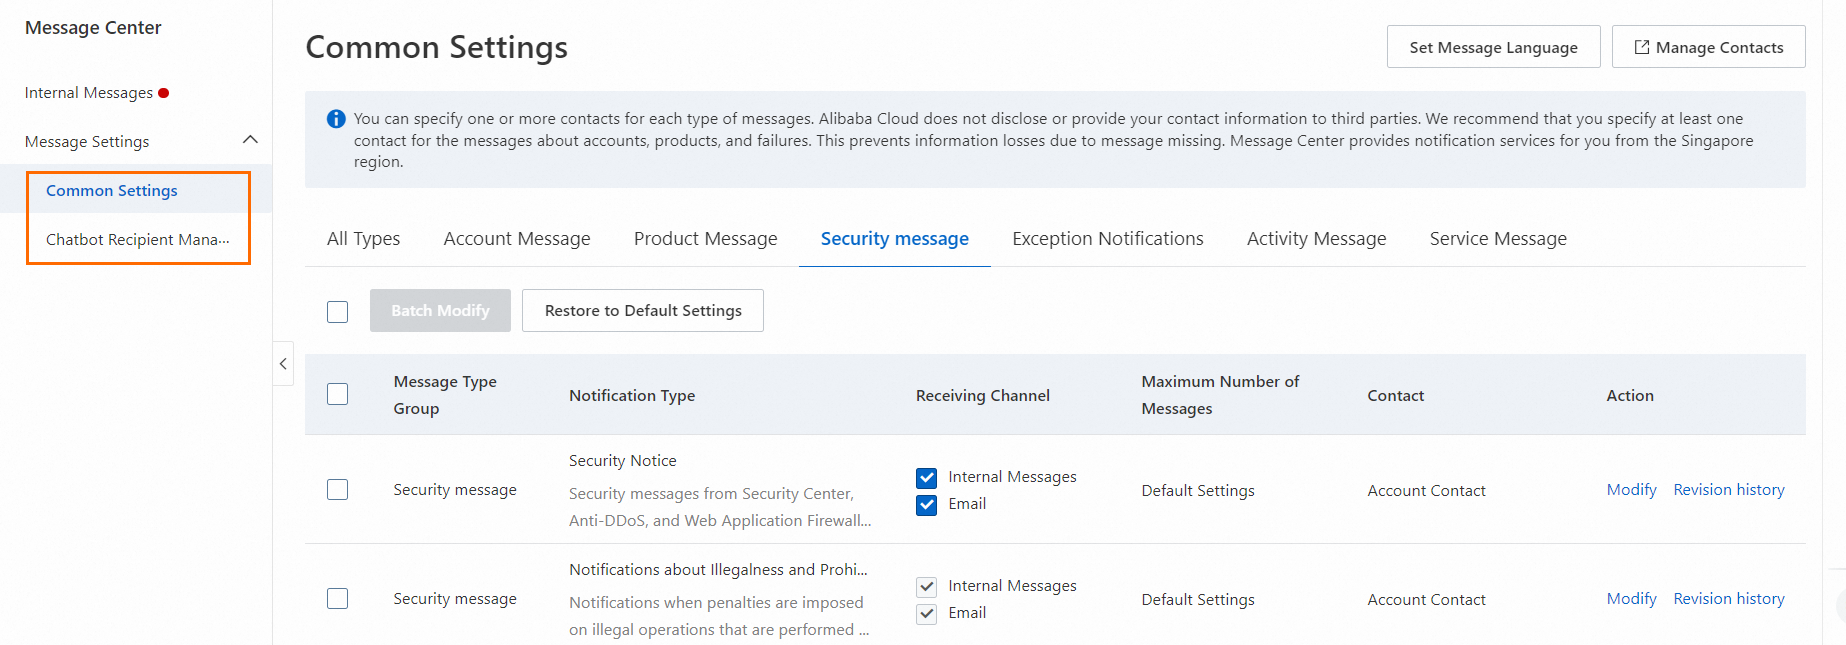
Select Security Notice under Security Messages. Then, select the checkboxes for Internal Message, or Email as needed.
Click Modify to change the message recipients.
Webhook
In the navigation pane on the left, click .
Find Security Notice under Security Messages and click Modify to add or remove a chatbot.
Configure alerts in Cloud Monitor (Anti-DDoS Origin)
Cloud Monitor is a service that monitors Alibaba Cloud resources and internet applications. Cloud Monitor can monitor blackhole filtering events and traffic scrubbing events for Anti-DDoS Origin instances. When an event occurs, Alibaba Cloud sends an alert notification to the contacts in the specified alert contact group.
- Log on to the CloudMonitor console.
Create an alert contact group to receive notifications.
Create an alert contact. If you already have a contact, skip this step.
In the navigation pane on the left, choose .
On the Alert Contacts tab, click Create Alert Contacts. In the Set Alert Contact panel, enter the contact information, complete the slider verification, and then click OK.
Create an alert contact group. If you already have a contact group, skip this step.
NoteAlert notifications must be sent to a contact group. You can add one or more contacts to a contact group.
In the navigation pane on the left, choose .
On the Alert Contact Group tab, click Create Alert Contact Group. In the Create Alert Contact Group panel, enter the required information, select contacts, and then click OK.
In the navigation pane on the left, choose . Click Create Subscription Policy, and then click Submit to complete the alert configuration.
Area
Configuration item
Description
Basic Information
Name
The name of the subscription policy.
Description
The description of the subscription policy.
Alert Subscription
Subscription Type
Select System Event.
Products
Select Anti-DDoS Origin.
Event Type
Select DDoS Attack.
Event Name
Select the events for which to receive notifications. Options: ddosbgp_event_black,holeddosbgp_event_clean.
Event Level
Select the level of events for which to receive notifications. All DDoS alert events are of the Critical level. This parameter only supports Critical.
Application Group
Notifications are sent only when an event occurs for a resource in the specified application group.
Event Content
An alert is reported only if the event contains this content.
Event Resource
An alert is reported only if the event contains this resource.
Combined Noise Reduction
Merge Content
Select a dimension from the Subscription Scope of the Subscription Type to merge alerts.
Noise Reduction
Reduces the frequency of alert notifications. Configure this as needed.
Notification
Notification Configuration
When a system event or threshold-triggered event meets the alert conditions, notifications are sent directly to alert contacts or to different contacts based on the alert level.
You can select an existing notification configuration or click Create Notification Configuration to create a new one.
For more information about how to set parameters for a notification configuration policy, see Manage notification configurations.
Custom Notification Method
Customize the alert notification method.
Click Modify next to a notification method to change the Notification Template and Alert Level.
Push And Integration
Push Channel
The channel to which alert notifications are pushed. To create a push channel:
Click Add Channel.
Select an existing push channel, or click Increase Channels to create a new one.
For more information about how to set parameters for a push channel, see Manage Push Channels.