Data Quality uses two building blocks to check data: monitors and monitoring rules. A monitor defines what data to check and when—the scope (such as a partition) and the trigger. A monitoring rule defines how to check—the specific logic that determines whether data meets quality requirements. Each monitor can have multiple rules attached to it.
This topic explains how to configure monitoring rules for a single table or multiple tables, and describes the operations available on the Rules page.
Configure monitoring rules
Choose the approach that fits your workflow:
| Approach | Best for |
|---|---|
| Single-table configuration | Configuring rules with different logic per partition, or per-table customization |
| Template-based configuration | Applying the same rule across multiple tables or fields at once |
Single-table configuration
To configure monitoring rules for one table:
-
Select the table whose data quality you want to check.
-
Create a monitor for the table. When creating the monitor, specify:
-
Data range: the scope of table data to check, such as a specific partition. Different monitors can cover different partitions of the same table, each with its own set of rules.
-
Trigger method: run the monitor automatically when the scheduling node that generates the table executes, or trigger it manually.
-
Alert conditions: send alerts based on the severity of check results. When data changes are checked automatically, block the task that generates the monitored table if data quality issues exceed the configured severity threshold.
-
-
Associate monitoring rules with the monitor. Select the rules that define the check logic for the table data. Two rule types are available:
-
Built-in rule templates: predefined templates provided by DataWorks, covering common quality checks.
-
Custom rule templates: rules you define using custom SQL logic, for cases where built-in templates cannot meet your requirements for monitoring the quality of data specified by partition filter expressions. Save frequently used custom rules as templates for reuse.
-
-
Test the monitor and configure alert subscriptions.
For step-by-step instructions, see Configure rules for a single table.
A single table can have multiple monitoring rules configured at the same time.
Template-based configuration
To apply a monitoring rule across multiple tables or fields at once:
-
Select a rule template and configure the rule parameters. Built-in rule templates come in two types: After selecting a template, configure the rule parameters to define what "good data" looks like for the target tables.
-
Table-level templates: check data at the table level.
-
Field-level templates: check data at the column level.
-
-
Add the tables or fields to check. Select the tables or fields to apply the rule to. The rule runs the same check logic against all selected targets.
-
Associate the rule with a monitor. Link the rule to a new or existing monitor to set the data range for checks. For partitioned tables, the data range is a partition.
For step-by-step instructions, see Configure a monitoring rule for multiple tables based on a template.
Go to the Rules page
-
Log on to the DataWorks console. In the top navigation bar, select the region. In the left-side navigation pane, choose Data Governance > Data Quality. Select the workspace from the drop-down list and click Go to Data Quality.
-
In the left-side navigation pane, choose Assets > Rule List.
View and manage monitoring rules
The Rules page is organized into five areas.
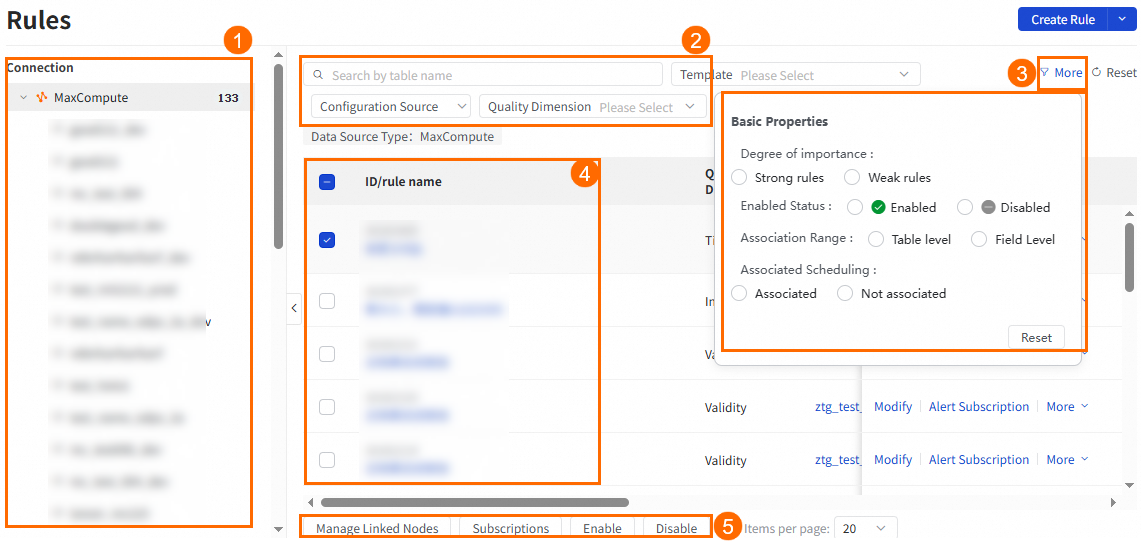
| Area | Feature | Description |
|---|---|---|
| ① | Database selection | Select the database where the table for which you configure rules resides. |
| ②③ | Filter conditions | Filter the rule list by Table Name, Template, Configuration Source, Quality Dimension, Degree of importance, Enabled Status, Association Range, or Associated Scheduling. |
| ④ | List of monitoring rules | View rule details, including ID/rule name, Quality Dimension, Table Name, Association Range, Template, Monitoring Threshold, Data range of quality inspection task, Degree of importance, Enabled Status, and Associated Scheduling. The Actions column provides the following operations for each rule: Alert Subscription (subscribe to check results for nodes based on this rule; notifications are sent via Email, Email and SMS, DingTalk Chatbot, DingTalk Chatbot @ALL, Lark Group Chatbot, Enterprise Wechat Chatbot, Custom Webhook, or Telephone), Operation Logs (view the operation history of this rule), and options to modify or delete the rule. |
| ⑤ | Batch operations | Select multiple rules and apply an action to all of them at once: Manage Linked Nodes, Subscriptions, Enable, Disable, or Delete. |