Relationship diagram
The relationship diagram feature in DataWorks Data Modeling provides a visual canvas to design, build, and display the architectural models of a data warehouse. These models include dimensions, dimension tables, fact tables, aggregate tables, and application tables. Each relationship diagram represents a single data warehouse model, and you can create multiple relationship diagrams under one account.
Before you begin
Create the models required for the relationship diagram. DataWorks Data Modeling supports various types of models. You need to perform data warehouse planning and dimensional modeling based on your specific business requirements.
Data warehouse planning
Before you start data modeling, your data warehouse architect, data developers, and model designers must collaborate to comprehensively analyze your business and data. This process helps clarify the overall data structure and complete the design for data layers, business categories, data domains, business processes, data marts, and subject areas. For more information, see Data warehouse planning.
Dimensional modeling
Conceptual model - dimension: A dimension represents a perspective for viewing your business operations. In dimensional modeling, you can plan and create dimensions. You can then associate these dimensions with dimension tables. After you establish this association, you can analyze business data from various perspectives.
Logical model - dimension table: Based on your data domain plan, identify the potential dimensions for data analysis within each business data domain. Store these dimensions and their attributes in dimension tables.
Logical model - fact table: Based on your business process plan, identify and analyze the data from each business process. Store these data fields in fact tables.
Logical model - aggregate table: Organizes statistical data for multiple derived metrics that share the same time period and dimensions within a data domain. An aggregate table is a highly abstracted summary of business data that provides a foundation for business queries, online analytical processing (OLAP), and data distribution.
Logical model - application table: Designed for specific business scenarios, an application table organizes statistical data for multiple atomic metrics and derived metrics that share the same time period, dimensions, and statistical granularity. It provides a foundation for business queries, OLAP, and data distribution.
Go to the Relationship diagrams page
Log on to the DataWorks console. In the target region, click in the left-side navigation pane. Select a workspace from the drop-down list and click Go to Data Modeling.
Go to the Relationship Diagrams page.
On the Data Modeling page, click Relationship Diagrams in the top navigation bar.
If you are using this feature for the first time, you can create a new relationship diagram from one of the following entry points.
The three entry points are the + New button at the top of the left-side navigation pane, the New Relationship Diagram button in the center of the welcome page, and the New button at the bottom of the left-side navigation pane.
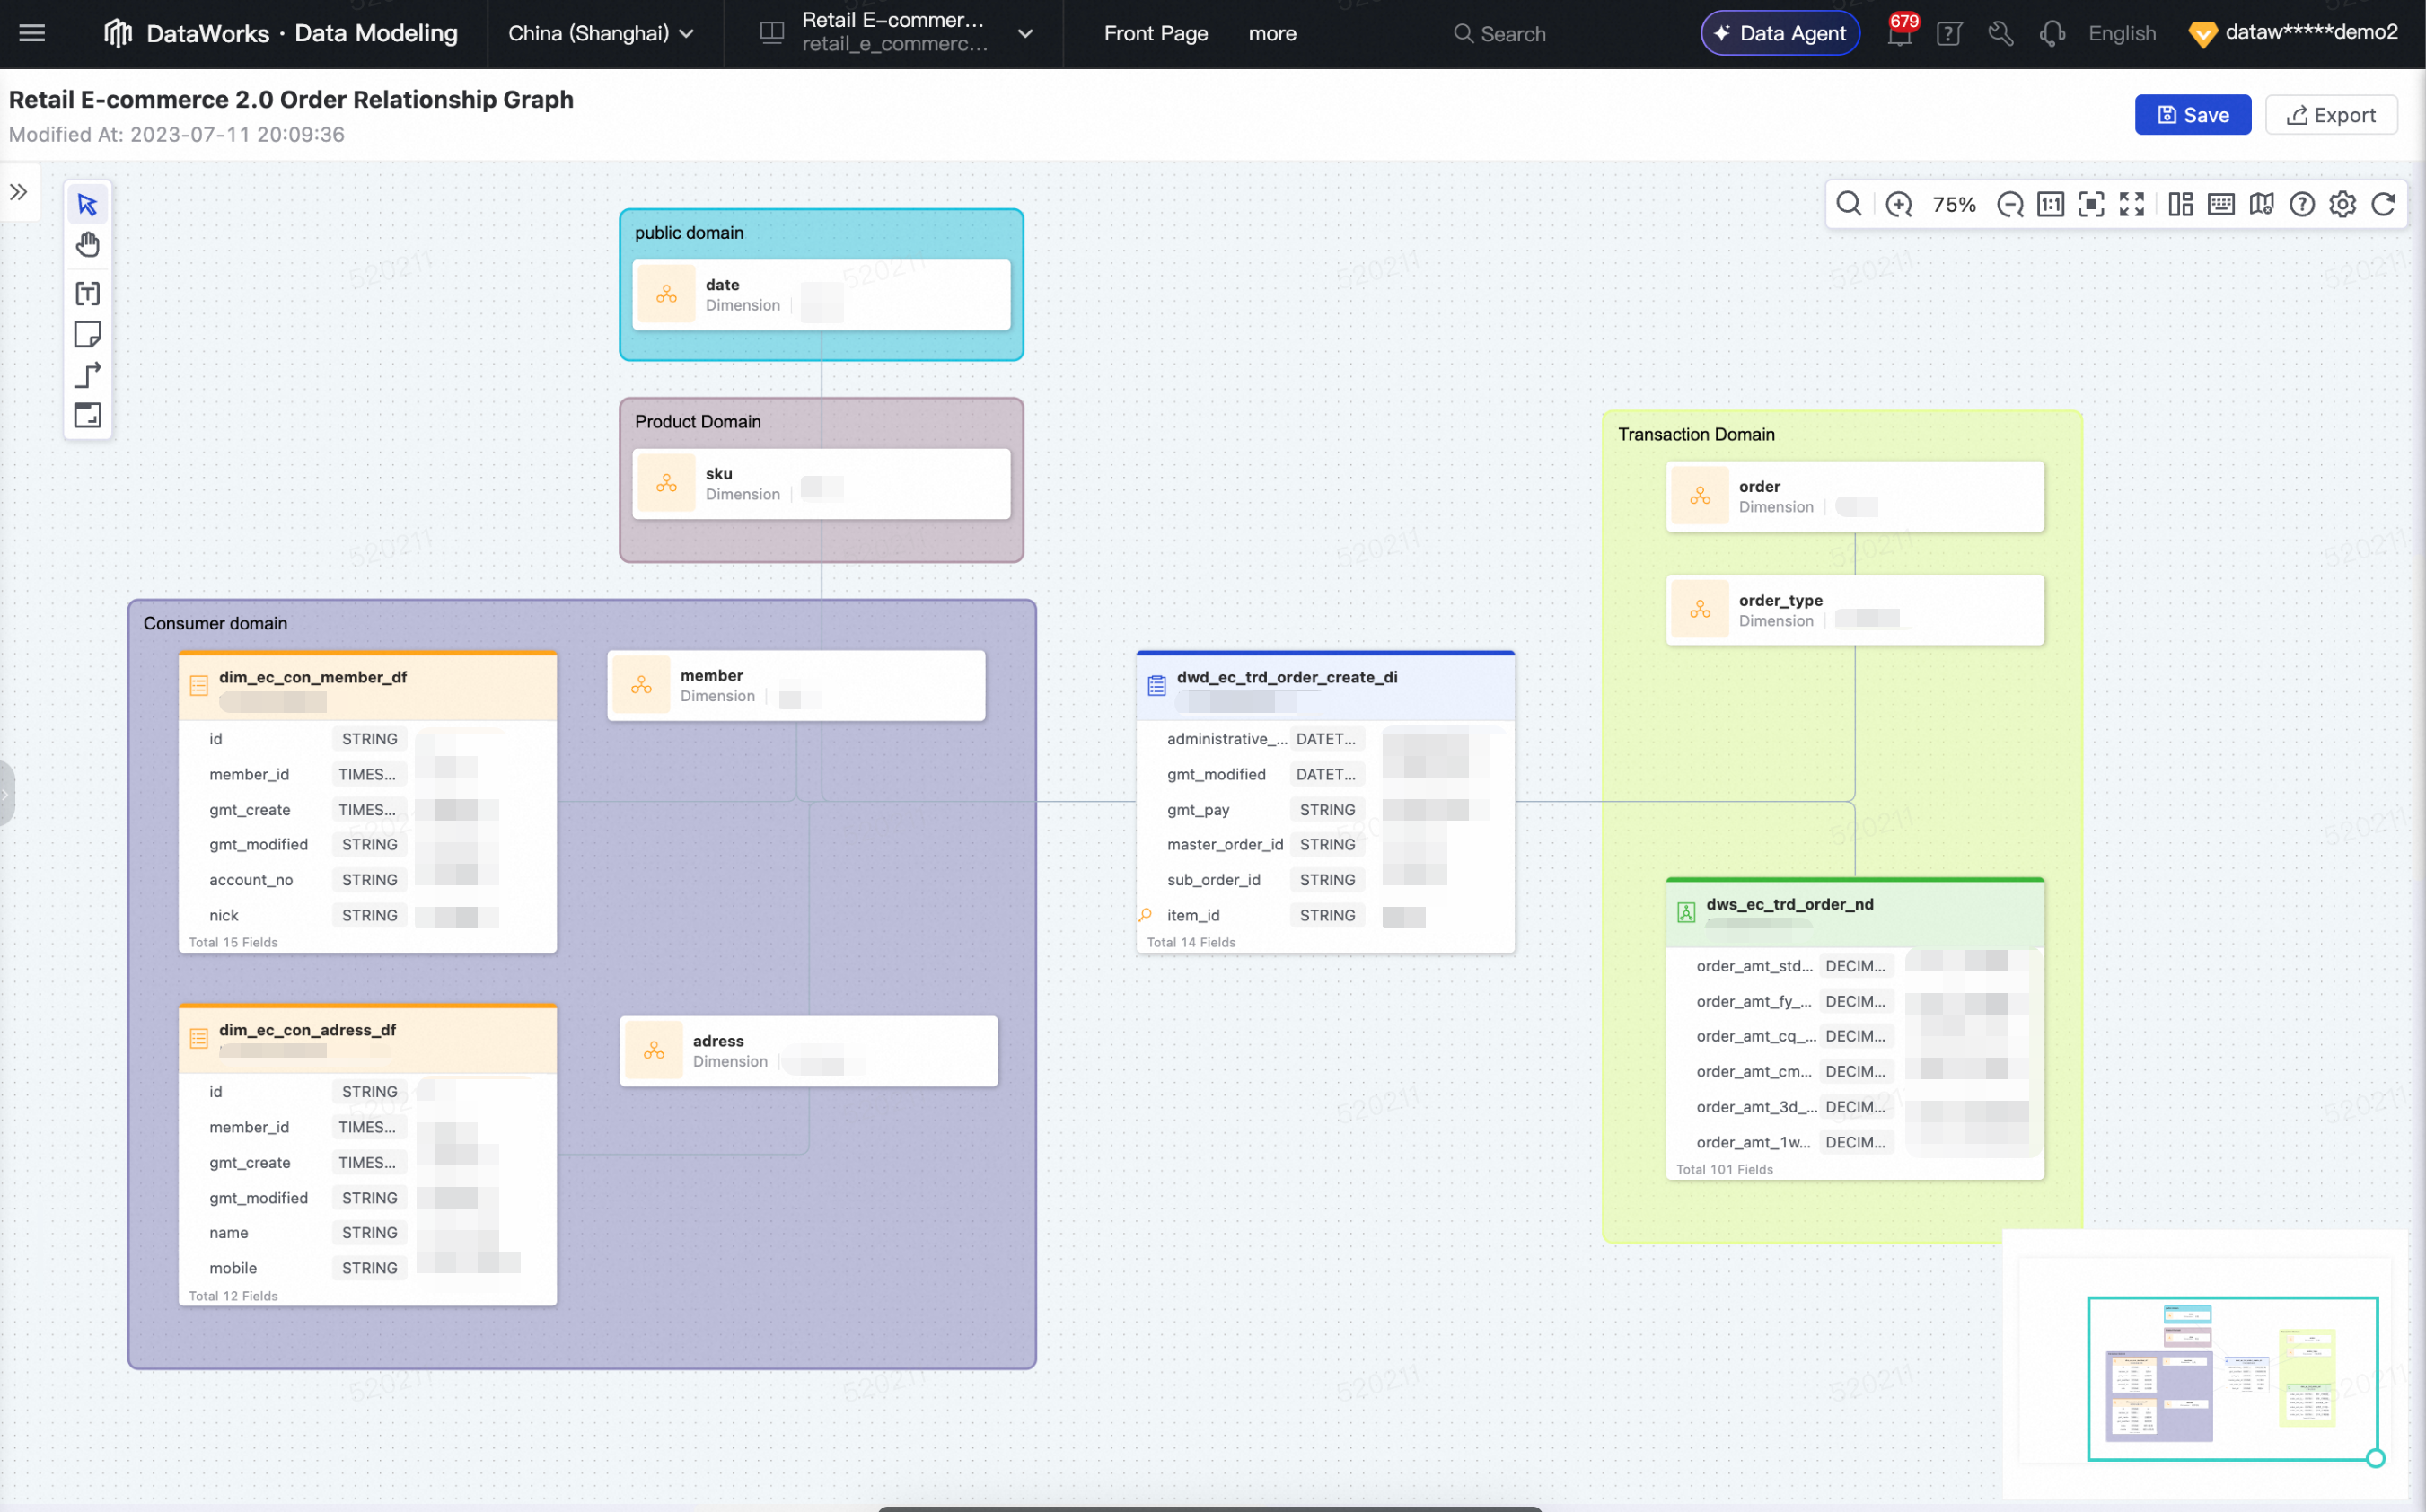
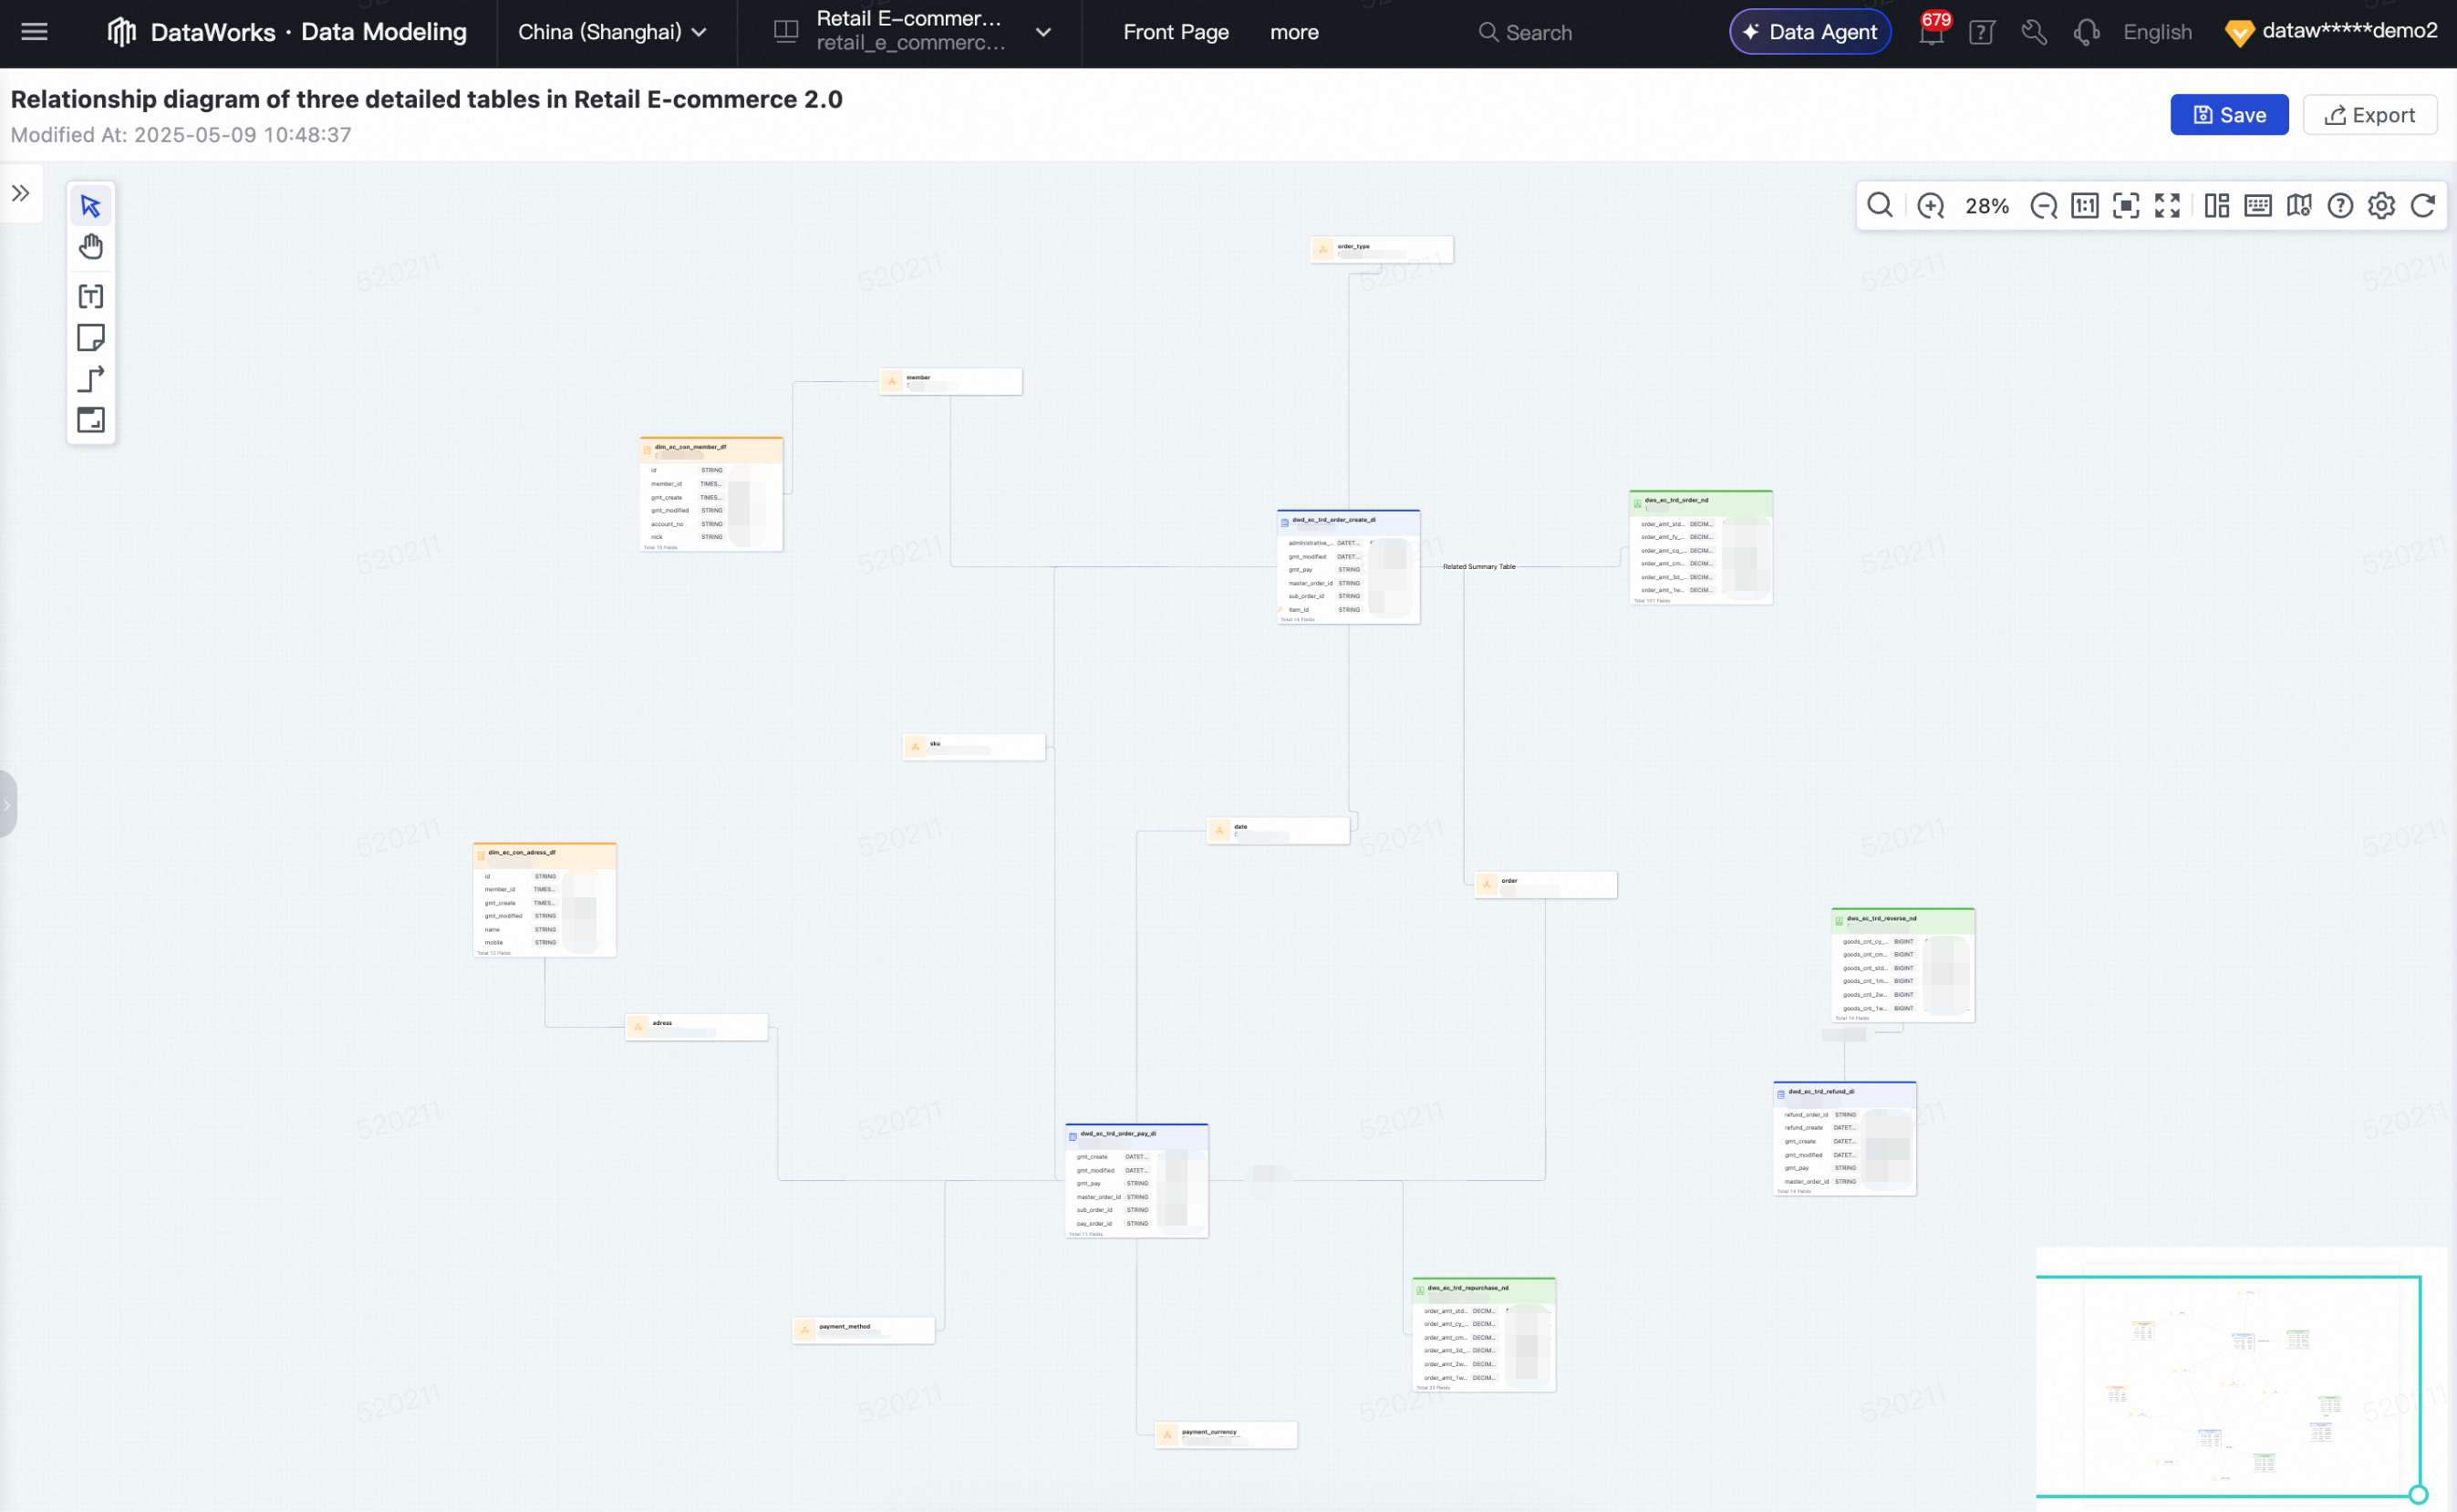
Build a model architecture diagram
On a new relationship diagram canvas, build your model as follows:
Add models: The To-Be-Added Objects panel on the left lists all the models that you have created in Data Modeling. Find the target model in the directory tree and drag it to the canvas on the right.
Build relationships: Use the connection line tool to create associations between models. These lines represent data flows or logical dependencies. You can double-click a connection line to add a description.
Enhance the diagram: Use tools such as sticky notes, text boxes, and groups to add comments and explanations to your model architecture diagram.
Save andExport: The content on the canvas is automatically saved. Click Export to download the model architecture diagram as an image file.
After a model is added to the canvas, you can click the ![]() icon on the model and then click the
icon on the model and then click the ![]() icon above the model to quickly go to the model details page. For more information about the icons on the relationship diagram canvas, see Canvas feature reference.
icon above the model to quickly go to the model details page. For more information about the icons on the relationship diagram canvas, see Canvas feature reference.
The Canvas serves not merely as a visualization of table schemas, but as an interactive modeling workspace designed for business analysts and data modeling experts. In this environment, entities, attributes, and their relationships are transformed into a shared, visual business semantic graph, empowering downstream Data Agents to precisely resolve business inquiries. Leveraging existing metadata and lineage information, the platform intelligently recommends entities and relationships, significantly lowering the barrier to entry for modeling. Building upon this foundation, users can further refine annotations—including association keys, cardinality, and business definitions, ensuring that the model encapsulates not only structural data but also deeply embeds critical business logic and semantic assets.
Canvas feature reference
The icons on the relationship diagram canvas are categorized into object icons and function icons.
Object icons
Element
Description

Represents a conceptual model dimension.

Represents a logical model fact table.
Represents a logical model dimension table.
Represents a logical model application table.
Represents a logical model aggregate table.
Represents a sticky note. You can use sticky notes to record information about your data warehouse model for future reference, such as the method used to create the model architecture.
Function icons
Icon
Description
Select: Select elements such as models and sticky notes to move, edit, or delete them.
Move canvas: Press and hold the mouse button and drag to move the entire canvas.
Add text: Click anywhere on the canvas to add a text box and enter a description.
Add sticky note: Click anywhere on the canvas to add a sticky note.
Connection line: Connect two models to establish a relationship. The arrow indicates the direction of the relationship. You can double-click the connection line to add a description.
Group: Box-select multiple elements to create a group. You can customize the group name and background color. Groups are usually placed on the bottom layer of the canvas.
Shortcuts: View supported shortcuts. For example, press
Ctrl + Zto undo the previous operation.Edit: Select a text box or sticky note and then click this icon to edit its content.
Delete: Delete the selected element from the canvas.
ImportantDeleting an element also deletes any elements connected to it.
Refresh:
In the To-Be-Added panel on the left: After you add or modify models in other modules, such as dimensional modeling, click this icon to refresh the To-Be-Added list. This operation does not affect the content on the canvas.
In the canvas toolbar on the right: Refresh the entire canvas.
Search: Find elements on the canvas. You can perform a fuzzy search by an element's Chinese name, English name, code, or universally unique identifier (UUID), or by the content of text boxes and sticky notes.
